-
-
WebSocket communication between VDA and Delivery Controller™
-
-
Migrate workloads between resource locations using Image Portability Service
-
-
-
-
This content has been machine translated dynamically.
Dieser Inhalt ist eine maschinelle Übersetzung, die dynamisch erstellt wurde. (Haftungsausschluss)
Cet article a été traduit automatiquement de manière dynamique. (Clause de non responsabilité)
Este artículo lo ha traducido una máquina de forma dinámica. (Aviso legal)
此内容已经过机器动态翻译。 放弃
このコンテンツは動的に機械翻訳されています。免責事項
이 콘텐츠는 동적으로 기계 번역되었습니다. 책임 부인
Este texto foi traduzido automaticamente. (Aviso legal)
Questo contenuto è stato tradotto dinamicamente con traduzione automatica.(Esclusione di responsabilità))
This article has been machine translated.
Dieser Artikel wurde maschinell übersetzt. (Haftungsausschluss)
Ce article a été traduit automatiquement. (Clause de non responsabilité)
Este artículo ha sido traducido automáticamente. (Aviso legal)
この記事は機械翻訳されています.免責事項
이 기사는 기계 번역되었습니다.책임 부인
Este artigo foi traduzido automaticamente.(Aviso legal)
这篇文章已经过机器翻译.放弃
Questo articolo è stato tradotto automaticamente.(Esclusione di responsabilità))
Translation failed!
Analyze the effectiveness of Autoscale™ settings
To use this feature, enable the toggle Autoscale Insights in DaaS > Home > Preview features. It might take about 15 minutes for Autoscale Insights to show up after enabling it.
You can analyze the effectiveness of the Autoscale settings based on machine usage from the previous week. Through the analysis, you can gain these insights into the effectiveness of Autoscale settings:
-
Identify financial waste resulting from over-provisioning.
-
Determine whether the user experience is negatively impacted due to under-provisioning.
-
Ensure that the capacity provisioned is properly aligned with the machine usage.
To achieve this goal, follow these steps:
- Select an Autoscale-enabled delivery group.
-
In the bottom pane, click the Autoscale Insights tab.
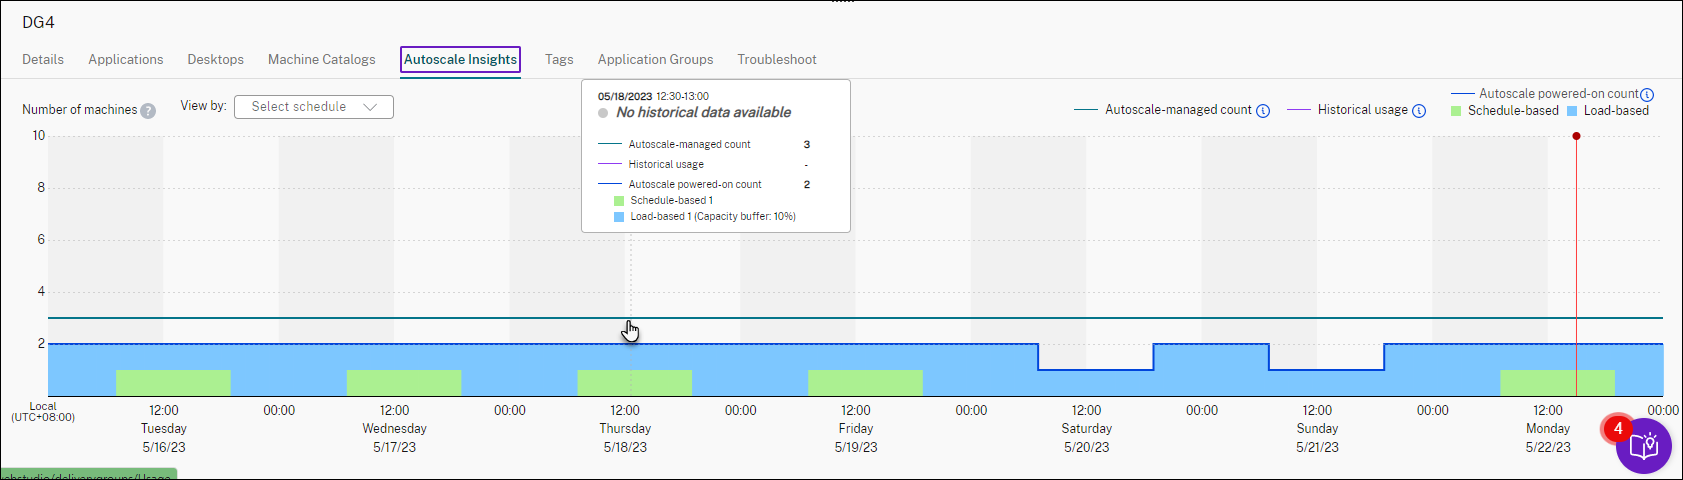
The following graph appears, showing the comparison between machine usage data from the previous week and the number of machines to be powered on based on Autoscale settings.
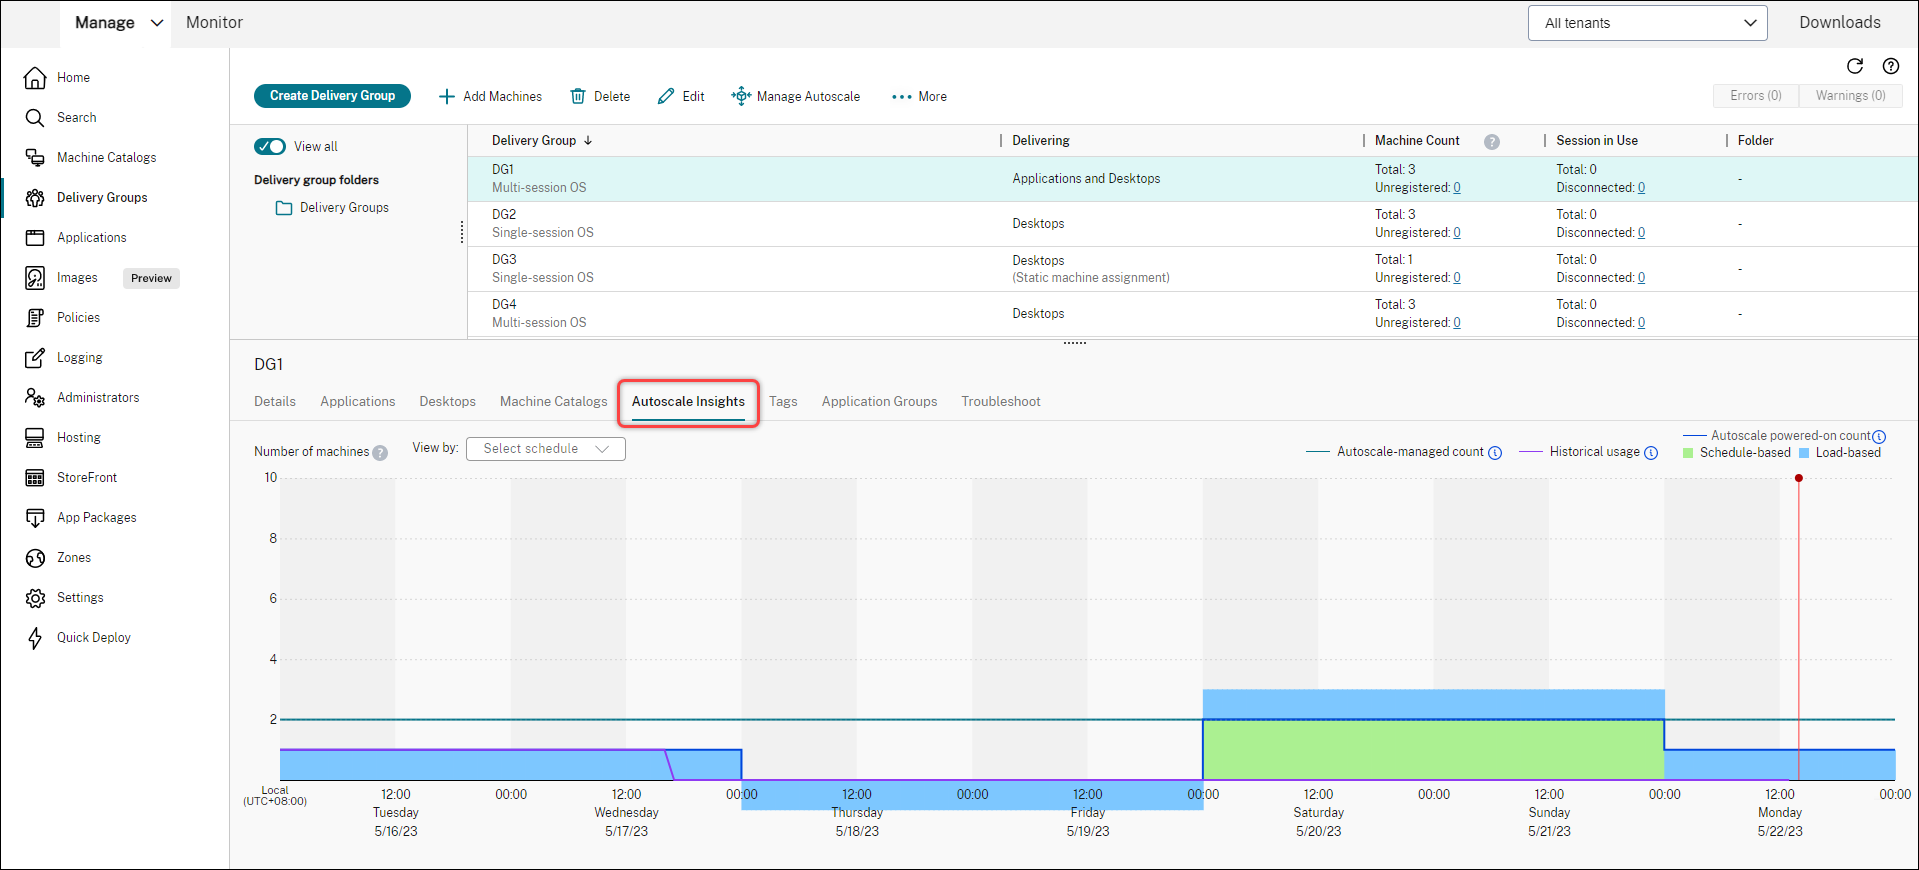
* The red vertical line identifies the current time.
The following table provides descriptions of the metrics shown in this graph.
Metric Description Autoscale-managed count Total number of machines managed by Autoscale. Autoscale-managed count = Total number of machines in the delivery group – Number of machines in maintenance mode – Number of machines not tagged for Autoscale (If tagged Autoscale feature is enabled). Autoscale powered-on count Total number of machines powered on by Autoscale. Autoscale powered-on count = Schedule-based machine count + Load-based machine count. Historical usage Number of machines that were delivered to users. Schedule-based Number of machines that are powered on based on the Autoscale schedule-based settings ( Note: Schedule-based settings don’t apply to delivery groups of the static single-session OS type). Load-based Number of machines that are powered on based on the Autoscale load-based settings. -
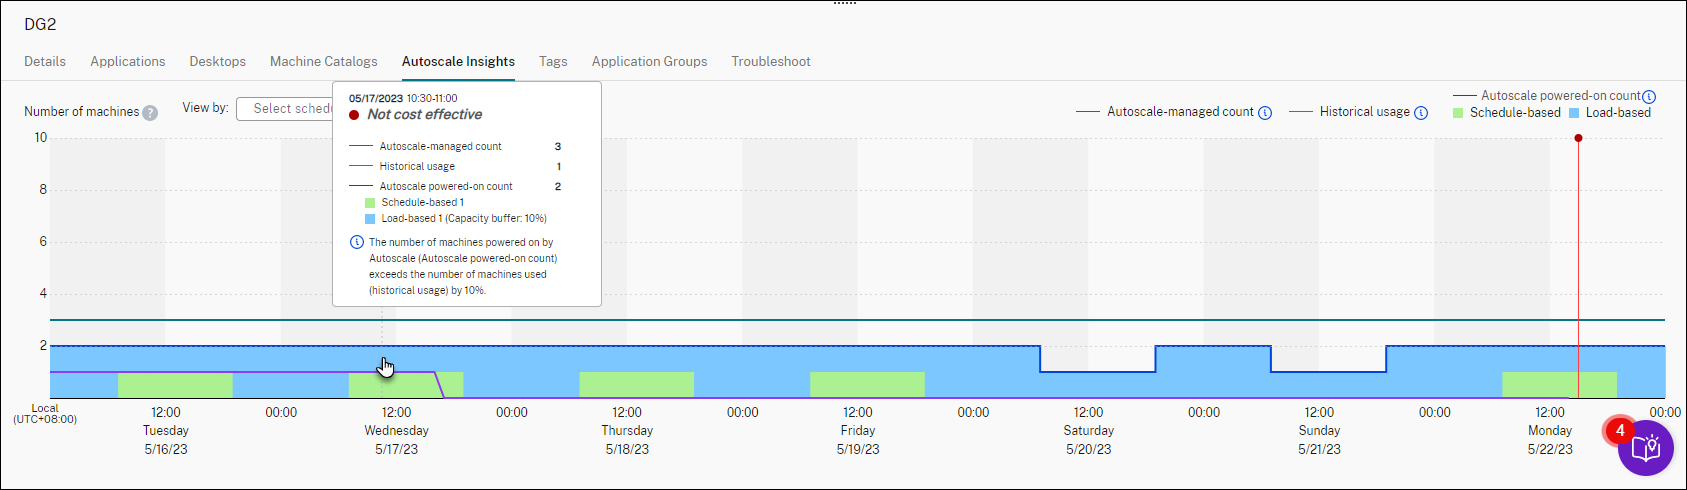
To check the effectiveness of Autoscale settings at a specific time slot, hover your mouse over that slot on the graph. An information box appears, showing the comparison results and detailed machine counts:
-
Not cost effective. The historical usage is less than 90% of the Autoscale settings (Autoscale powered-on count). As a result, wasted capacity might exist.
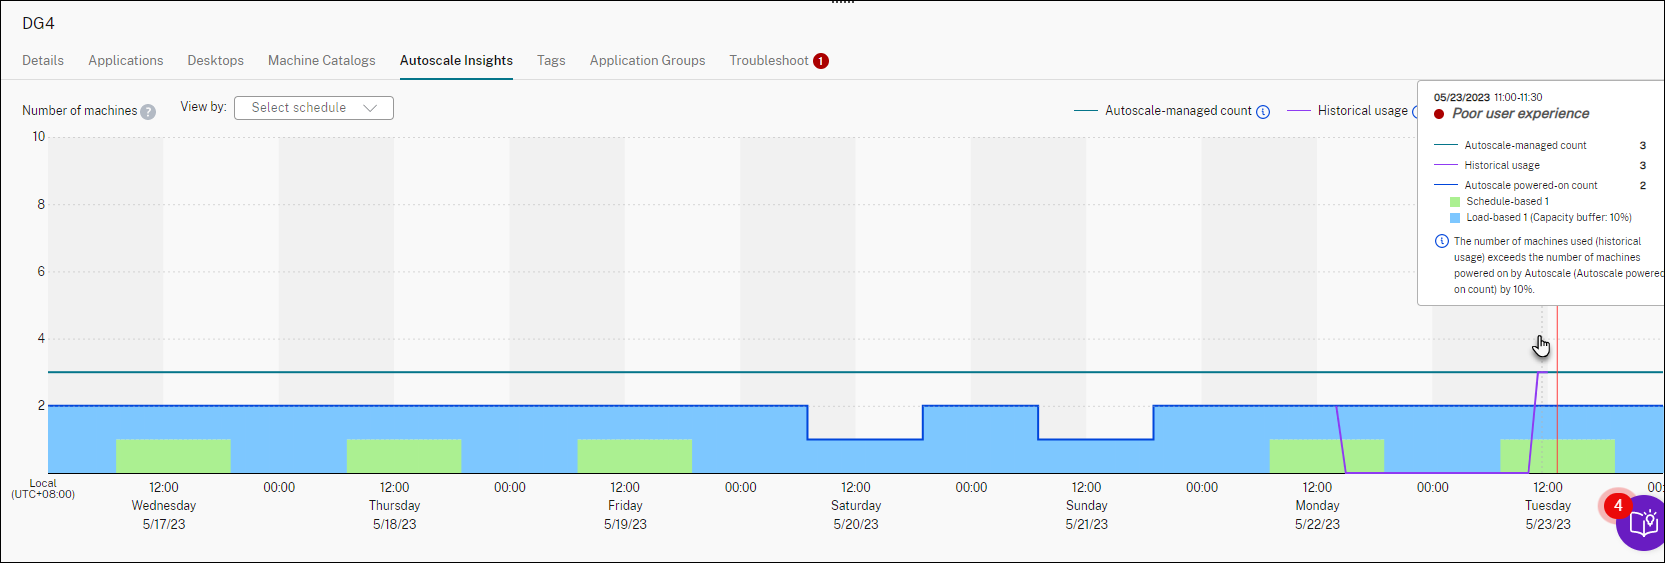
-
Poor user experience. The historical usage is more than 110% of the Autoscale settings (Autoscale powered-on count). As a result, users might experience longer wait times for machines to power on.
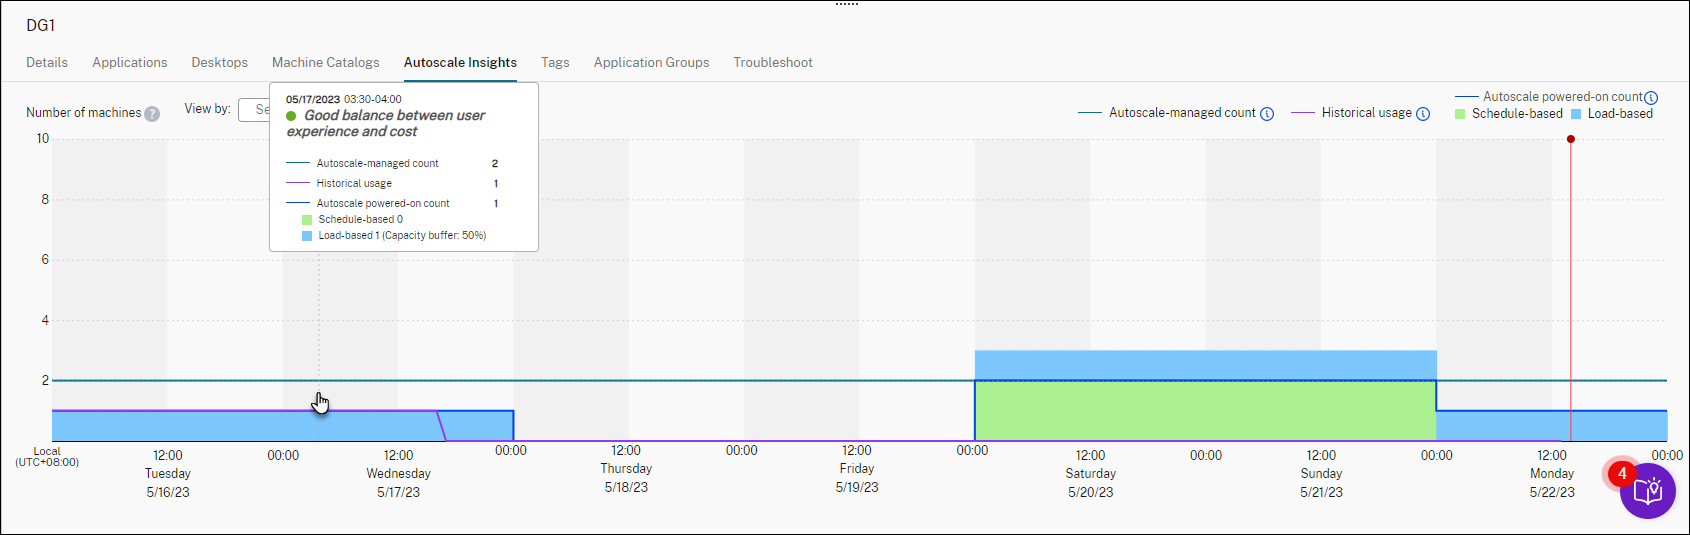
-
Good balance between user experience and cost. The difference between the historical usage and the Autoscale settings (Autoscale powered-on count) is less than 10%. The Autoscale settings are aligned with the historical usage.
-
No historical data available. No historical data is available. Possible causes include that Autoscale was enabled for the delivery group less than a week ago.
-
-
To highlight a date range based on an Autoscale schedule, select the schedule from the View by field.
- Based on your analysis, adjust the Autoscale settings. For more information, see Schedule-based and load-based settings.
Share
Share
In this article
This Preview product documentation is Citrix Confidential.
You agree to hold this documentation confidential pursuant to the terms of your Citrix Beta/Tech Preview Agreement.
The development, release and timing of any features or functionality described in the Preview documentation remains at our sole discretion and are subject to change without notice or consultation.
The documentation is for informational purposes only and is not a commitment, promise or legal obligation to deliver any material, code or functionality and should not be relied upon in making Citrix product purchase decisions.
If you do not agree, select I DO NOT AGREE to exit.