 View PDF


Profile applications
Aug 14, 2017
Application profiling works in tandem with install capture, however, application profiling collects runtime data from your installed applications. Metrics, like CPU, memory usage, and network utilization are captured while an application is running. Using this information, AppDNA helps you design your virtualization infrastructure requirements. For example, the AppDNA profiling analysis may indicate that a memory intensive application should be spread among multiple RDS servers.
To use application profiling:
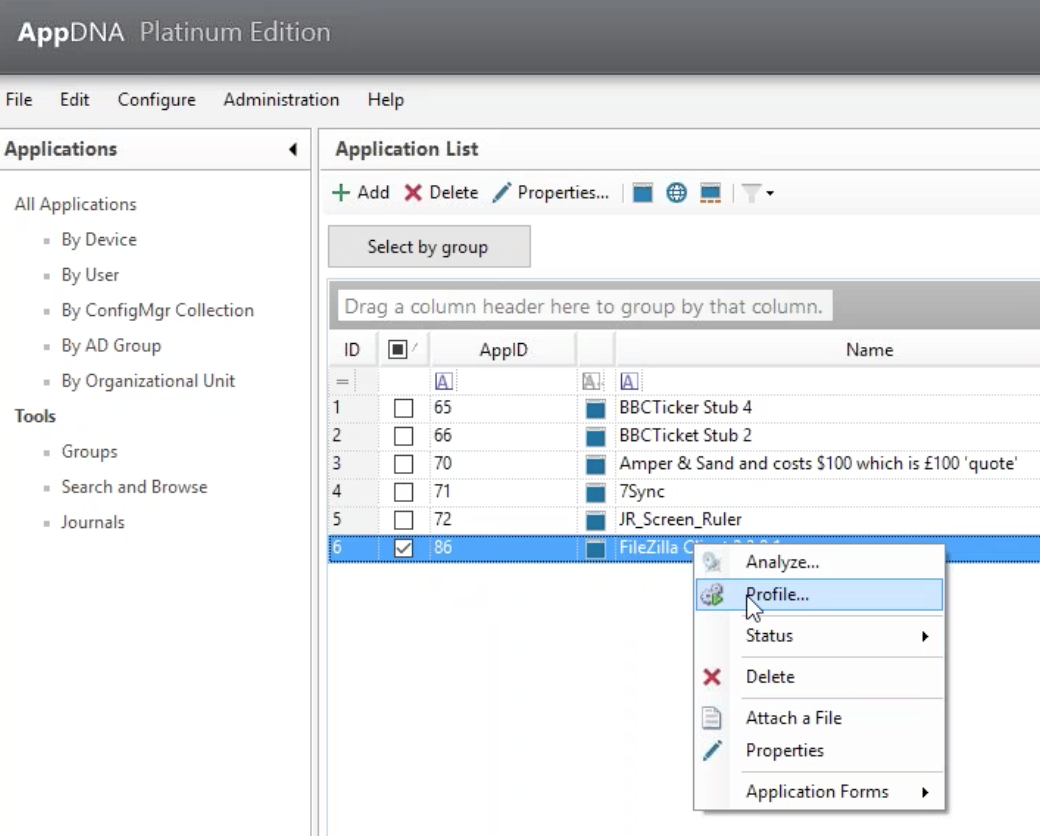
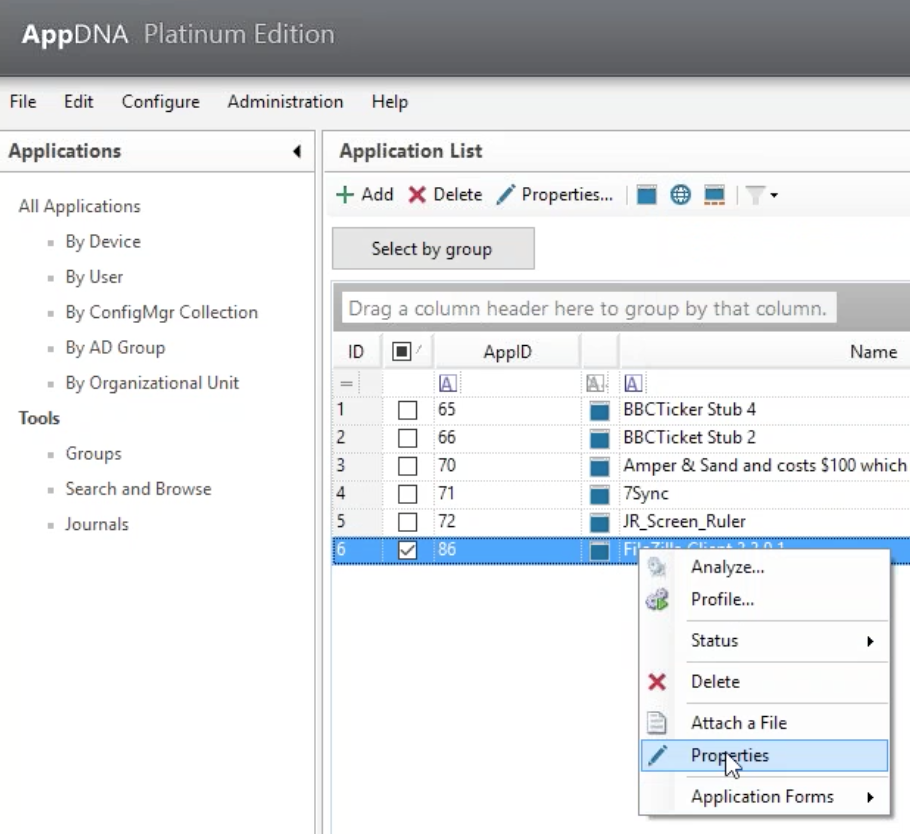
- In the Applications tab, select the application you want to profile.
- Right click to display a context menu; select Profile.
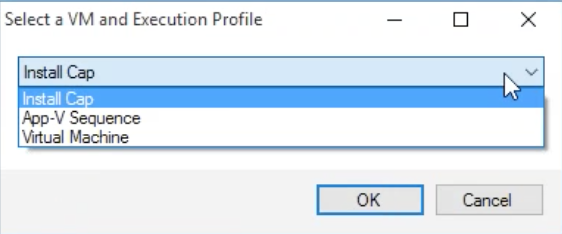
Application profiling uses an existing VM configuration profile based on what you specified for install capture.
3. In the drop-down menu, select Install Cap, click OK to begin the profiling process.
AppDNA displays a status message indicating the state of the profiling process.
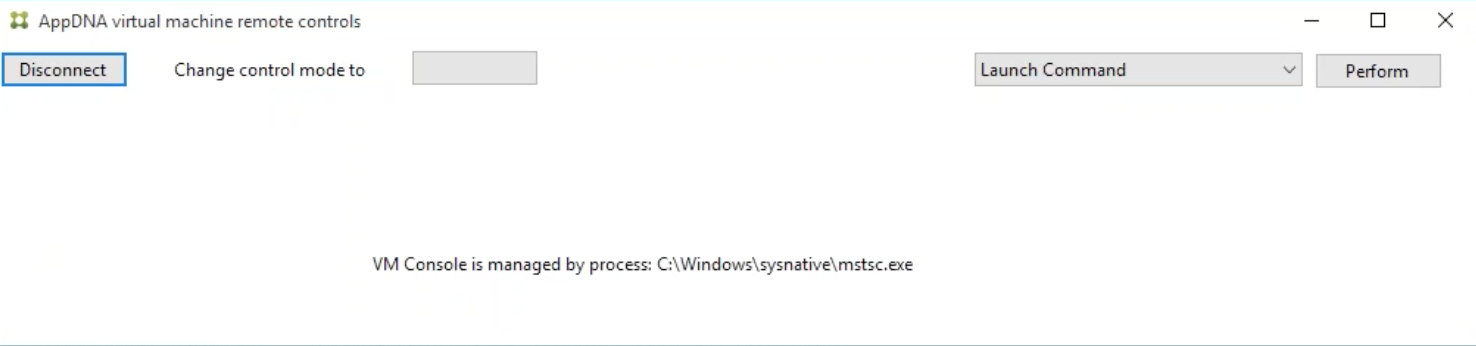
When application profiling begins, AppDNA starts up the machine defined in the selected profile and initiates a RDP session giving you visibility and control over the process.
AppDNA injects (into the machine) the setup file for the application that will be profiled; the application is setup in the same way as it would be for an install capture process, the main difference is that no snapshots of the base OS are taken.
After starting the application profiling process, the auto clicker process is invoked to install the application.
The selected application (in this example, FileZilla) launches its installation Wizard and prompts for RDP connection verification. With auto clicker enabled, no user input is required.
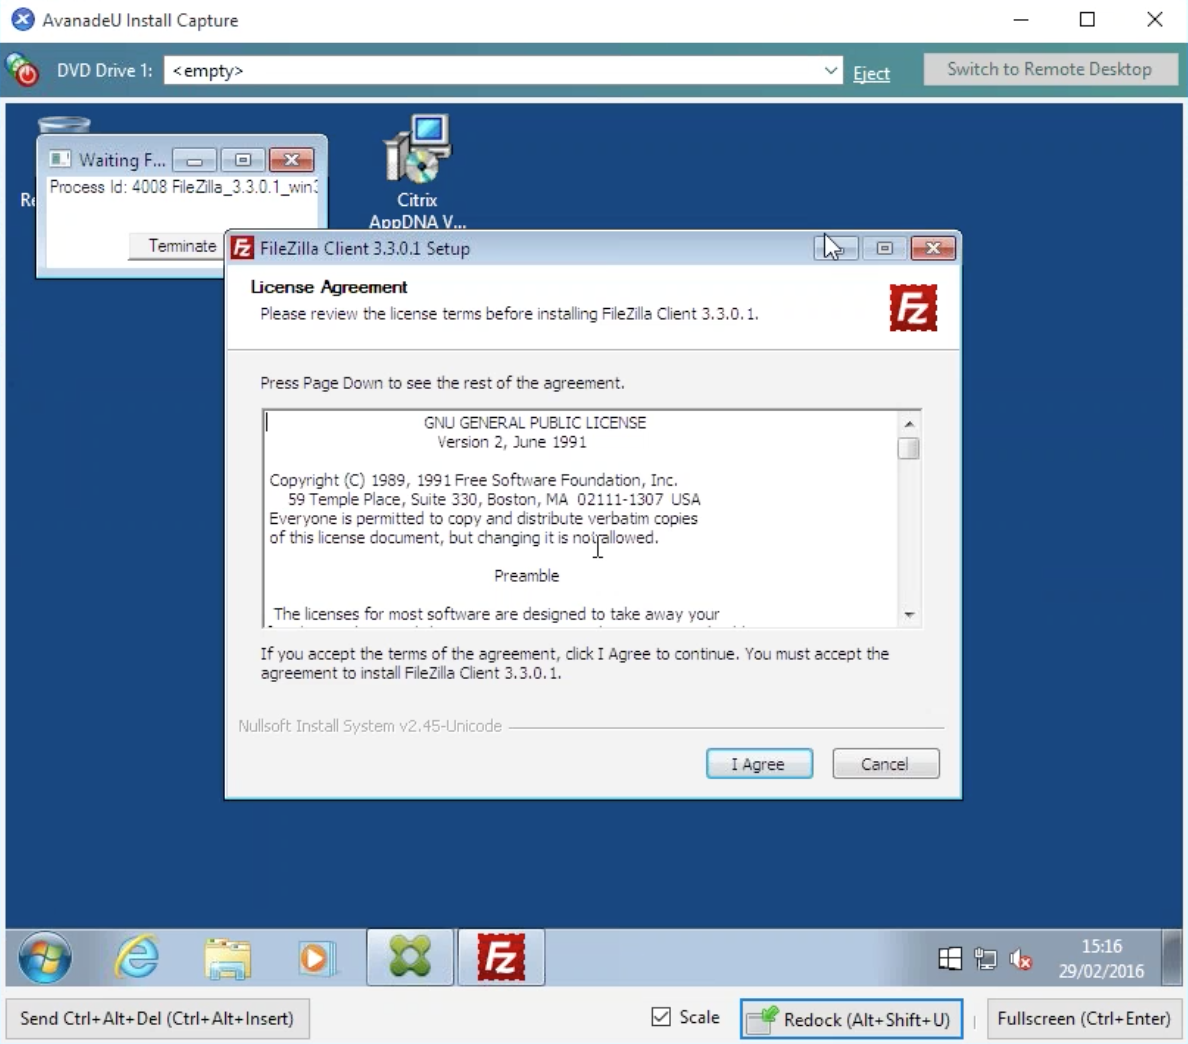
Auto clicker automatically finishes the installation process.
Once auto clicker finishes installing the application, a dialog window appears in the RDS window allowing you to start profiling the application.
4. Click Start to begin, or click Browse to locate the application’s executable file.
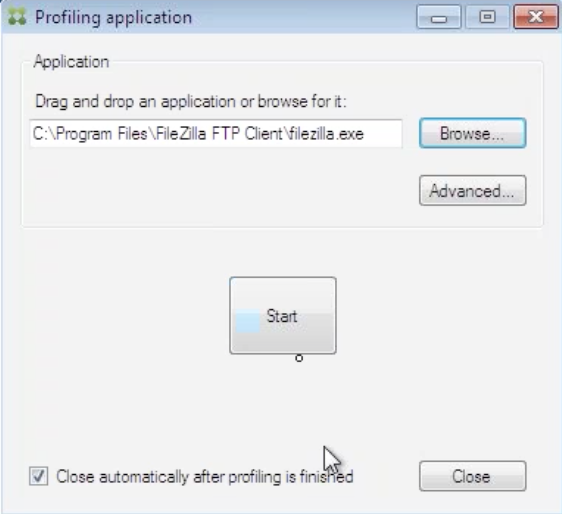
Tip
If the application you want to profile does not automatically launch after clicking Start, click Browse to locate it and manually launch it.
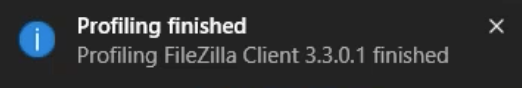
After clicking Start to initiate app profiling, AppDNA begins scanning the application to determine key metrics. When the process finishes, the interface displays a status message.
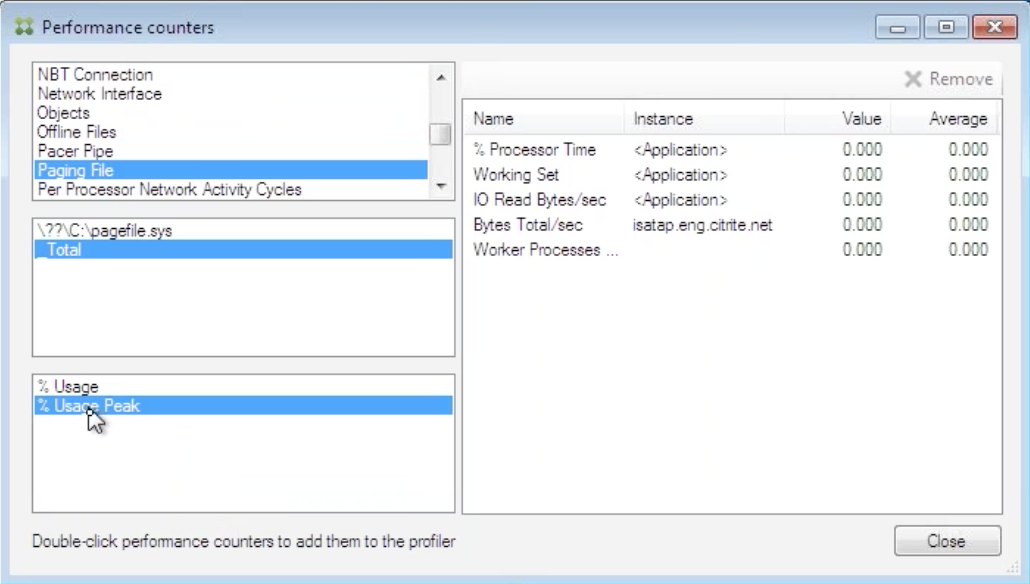
5. To view information related to performance counters, click Advanced in the profiling application window.
View profiling data
To view application profiling data:
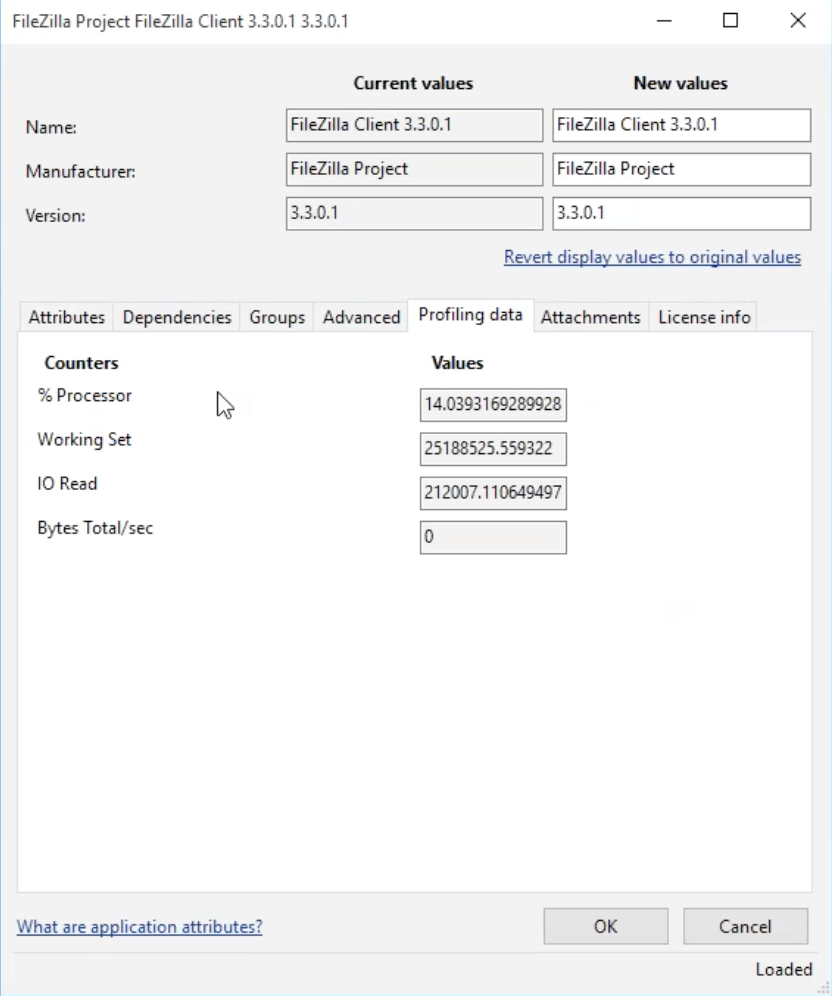
1. Select the application, right click and select Properties.
2. In the Properties screen, select the Profiling data tab.
Tip
When using application profiling to display performance metrics for an application, you can set thresholds to address any counters that may exceed an acceptable level. For example, % Processor, Working Set, IO Read, and Bytes Total/sec. Adjust these thresholds using the Performance data tab in the Settings screen.
Setting performance related thresholds
To set application profiling performance thresholds:
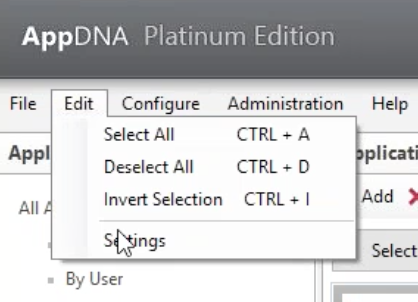
1. Select Edit > Settings.
2. In the Settings screen, select Reporting > Performance tab.
3. In the Performance tab, set thresholds for the following counters:
- % Processor. Displays the threshold for percentage of processor utilized by the selected application.
- Working Set. Defines the amount of memory that a process requires in a given time interval.
- IO Read. Defines the number of input/output reads performed by the application.
- Bytes Total/sec. Represents the total number of bytes used by the application each second.
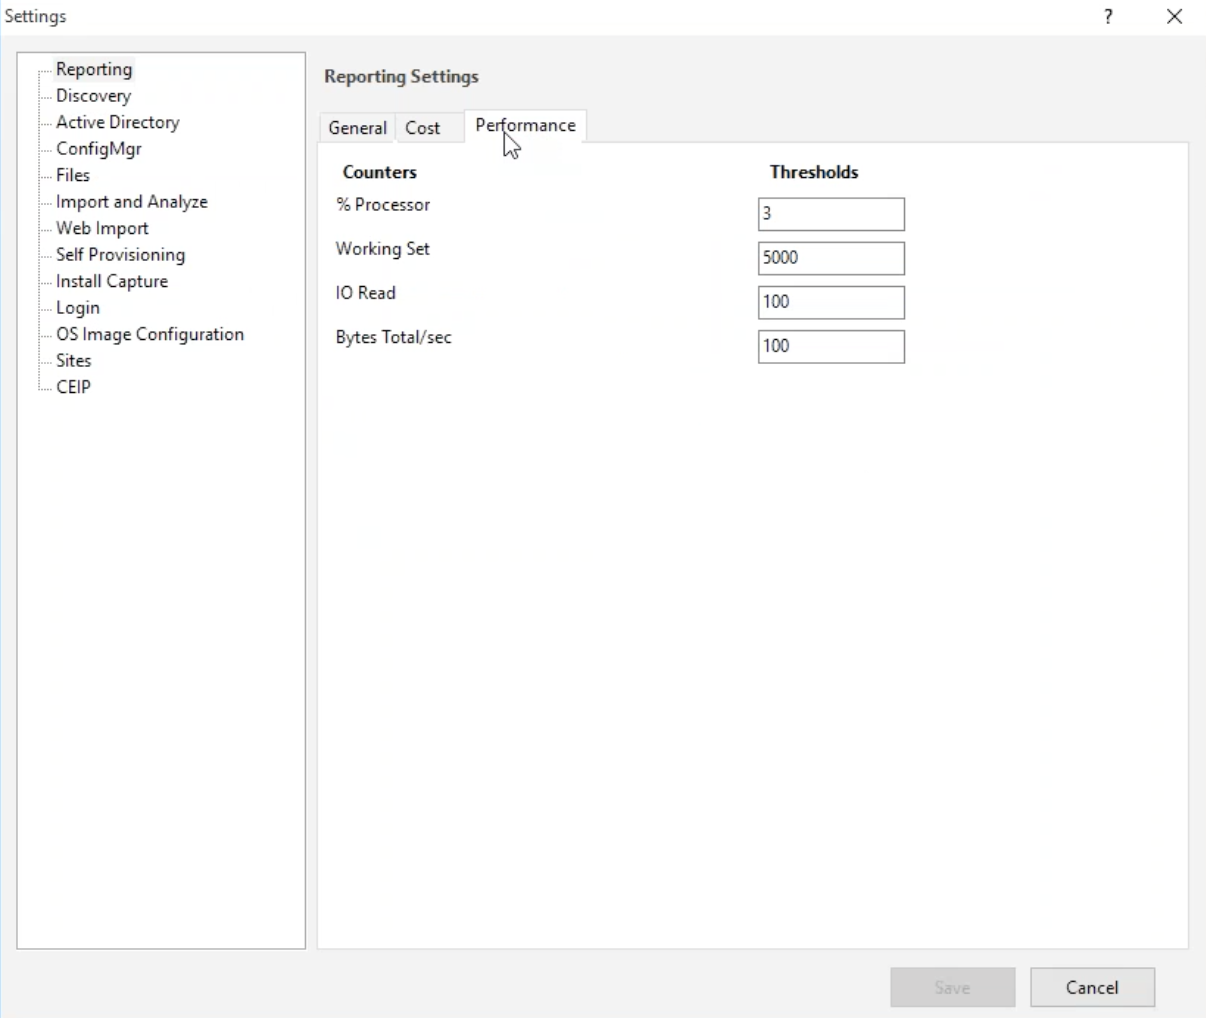
4. Click Save.
View additional performance information
Additional performance information is available for profiled applications.
To view this information:
1. Select Reports: Applications > Performance Summary.
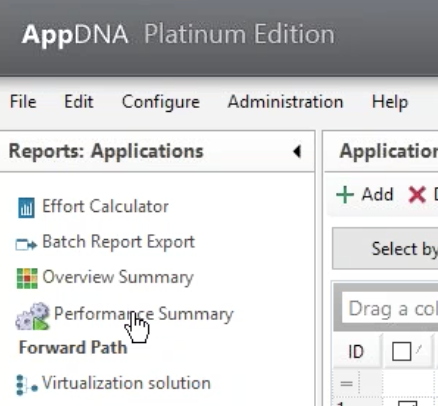
The Profiling Summary screen provides comprehensive, at-a-glance information related to performance characteristics for a profiled application.
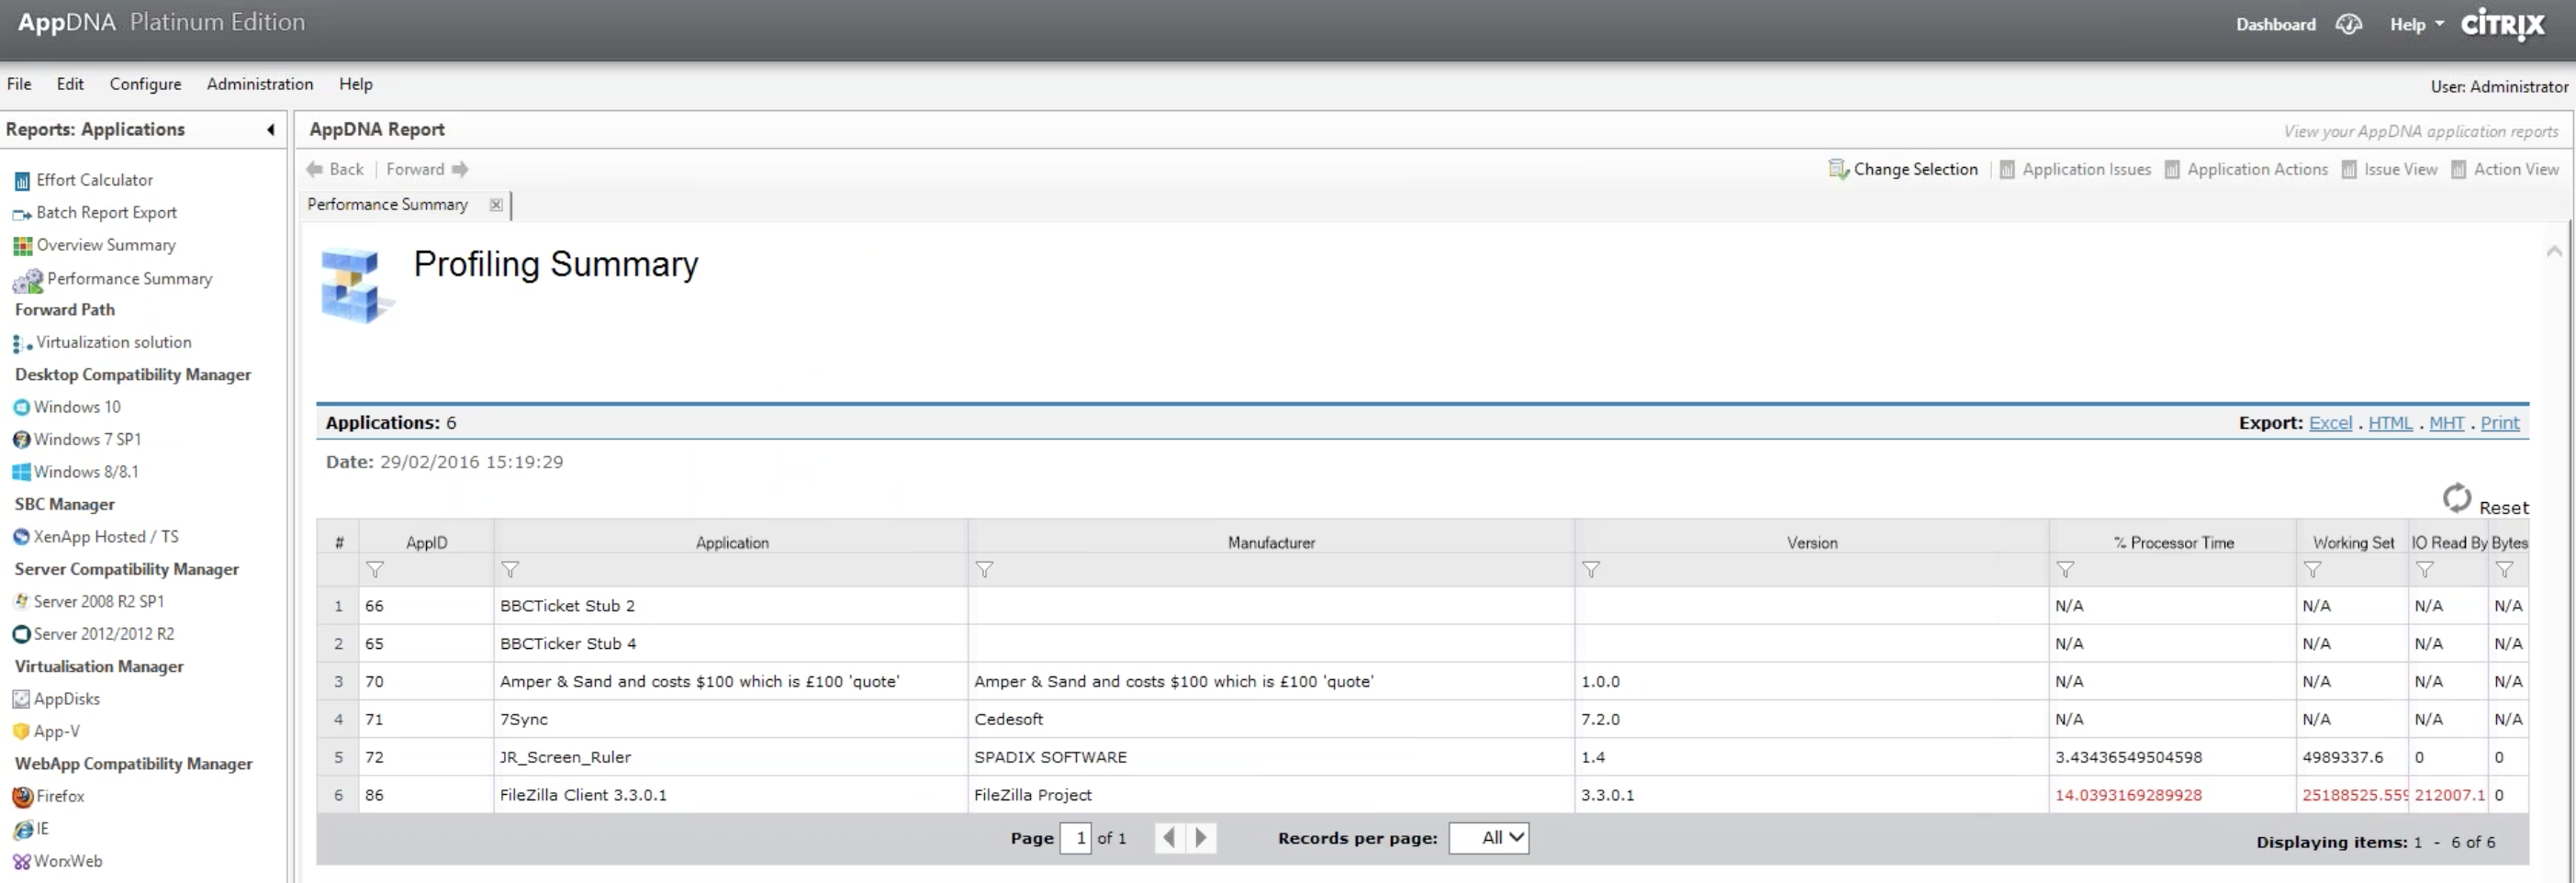
Tip
Use the information in the Profiling Summary screen to view thresholds; use the settings screen to set thresholds to improve the performance of your application. For example, if an application uses an extraneous amount of processing, it appears in red. In this example, the application FileZilla allocates a large percentage of available processor. To resolve this, set a lower % Processor threshold in the Settings screen.