 View PDF


Report views
Aug 14, 2017
Analysis results are presented in report views, such as the Overview Summary, Application Issues, and Issue View. The annotations in the following sample report describe the tasks you can perform while viewing a report.
Overview Summary
The Overview Summary is a dashboard that provides a high-level view of the state of your application portfolio. For each of the selected applications, it shows the overall RAG (red, amber, green) status for each of the active reports. Click the RAG icons to go to the Remediation report views for an application. These give the full details of the remediation required along with an MST fix where applicable. For the lower-level Remediation report views, see Remediate application issues.
For information about the RAG icons, see Understanding RAG Icons.
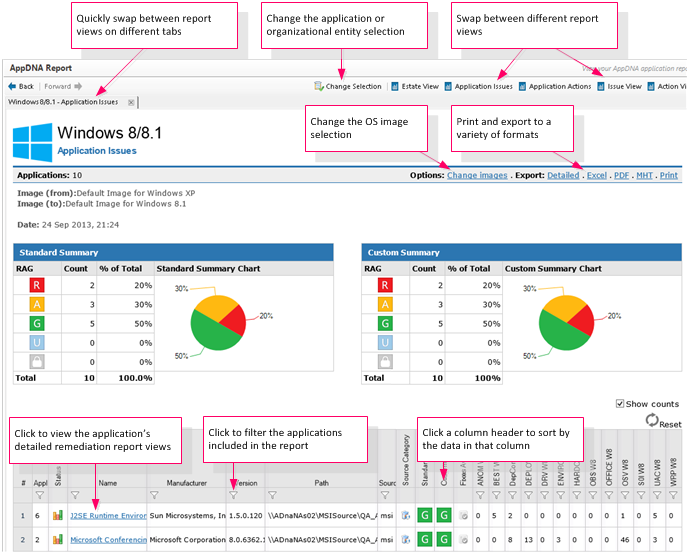
Application Issues
Application Issues provides a summary of the issues found in the selected applications. Pie charts summarize the standard and custom RAG status of the items included in the report.
A list of the applications shows for each application the standard and custom RAG status and whether AppDNA provides an automatic fix. The Source and Source Category columns indicate the installation type and the Status column indicates whether the application analysis for this report is up to date.
Depending on whether you select the Show counts check box, this report view also shows the number of times the application triggered an algorithm in each of the algorithm groups in the report. An application can trigger an algorithm multiple times because multiple components within the application can each trigger the same algorithm. The application name is a link that takes you to the Remediation report views.
Application Actions
In the Application Actions, a pie chart summarizes the RAG status of the selected applications before and after the remediation actions.
A list of the selected applications shows for each application the before and after action RAGs and indicators of the application complexity and action effort. The action effort is categorized as easy, medium, hard, or no remediation is required. The action effort is associated with the remediation actions and can be customized, as described in Configure algorithms.
Using the information in Application Actions, you can quickly see which applications are ready for user acceptance testing (UAT), because these applications have green before and after action RAGs. Applications that are probably not suitable for migration have a red after action RAG, and those that require some remediation work before migration have an amber or red before action RAG and a green or amber after action RAG. When remediation is required, the application complexity and the action effort provide a rough indication of the amount of work involved.
Depending on whether you select the Show counts check box, this report view also shows the number of issues that require remediation, broken down by the various remediation action types. The application name is a link that takes you to the Remediation report views.
Issue View
Issue View provides a breakdown of the number of applications that triggered each algorithm within the report. It includes a pie chart summary of the standard, custom, and after action RAG status of the applications included in the report. AppDNA does not show the custom RAG pie chart if the custom RAGs are the same as the standard RAGs for all of the report’s algorithms.
A bar chart shows the number of applications that have triggered one or more algorithms in each algorithm group.
A list of the algorithms includes the standard, custom, and after action RAGs, whether a fix is available, and the number of applications that are affected. You can expand each algorithm to show a list of the affected applications and an explanation of both the algorithm and its remediation actions. The application name is a link that takes you to the Remediation report views.
Action View
The Action View provides a breakdown of the prevalence of the actions required to remediate the applications in your portfolio. It includes a pie chart summary of the standard, custom, and after action RAG status of the applications included in the report. AppDNA does not show the custom RAG pie chart if the custom RAGs are the same as the standard RAGs for all of the report’s algorithms.
A bar chart shows the number of applications that require each type of remediation.
The view includes a list of the remediation action types and subtypes (also known as actions and action details), the after action RAG, and the number of applications that require this type of remediation. You can expand each individual action and action detail combination to show a list of the associated applications. The application name is a link that takes you to the Remediation report views.
Estate View
The Estate View, available for trial licenses only, provides a high-level overview of the consolidated status of the entire application portfolio for a target technology. This report is useful when you are evaluating AppDNA, because it does not rely on individual application licenses.
The Estate View includes a pie chart summary of the standard, custom, and after action RAG status of the applications in the portfolio. AppDNA does not show the custom RAG pie chart if the custom RAGs are the same as the standard RAGs for all of the report’s algorithms.
A bar chart shows the number of applications that have triggered one or more algorithms in each algorithm group.
A list of the algorithms includes the standard and custom RAGs, whether AppDNA provides an automatic fix, and the number of applications that are affected. You can expand each algorithm to show an explanation of both the algorithm and its remediation actions.
View the reports
- From the AppDNA side bar, click Reports: Applications.
- In the Application List screen, select the applications you want to include in the report.
- Do one of the following:
-
On the toolbar in the Application List, select the report you want to view in the drop-down list and click View Report.
-
From the AppDNA side bar, choose Reports: Applications > Module > Report > Report view, where Module, Report and Report view identify the report view that you want to see.
After you have opened a report view, you can use the links in the top right corner of the screen to move to a different report view for the same report.
You can view reports in multiple tabs within AppDNA. This makes it easy to switch between different reports and report views quickly. You can also open a report in a browser window.
- To open a report view in a new tab: On the side bar, right-click the report view you want to view, and from the shortcut menu, choose Open in New Tab.
- To open a report view in a browser window: On the side bar, right-click the report view you want to view, and from the shortcut menu, choose Open in New Window.