 View PDF


Effort Calculator
Aug 14, 2017
Use the AppDNA Effort Calculator to estimate the time, cost, and effort associated with migrating a portfolio to a new platform – for example, that it will take five people six months and cost $500,000. Effort Calculator uses a number of variables that define, for example, the cost of a tester per day, the number of working hours in the day, and the time to test an application of a given complexity. You can configure the variables to reflect the specifics of your organization. AppDNA produces a detailed breakdown of the cost and how much time it will take to remediate the applications as well as the potential savings that AppDNA can provide.
To open the Effort Calculator, from the side bar choose Reports: Applications > Effort Calculator.
Using Effort Calculator involves the following steps:
- Select the report
- Configure variables and view the results
- Export the results
1. Select the report
The first step in using Effort Calculator is to select the report that represents the project for which you want to calculate the effort. For example, if you want to calculate the effort for a Windows 7 migration project, select the Windows 7 report. AppDNA lists the available reports on the left side of the screen.
When you select a report, the right side of the screen provides a summary that shows the overall status of the currently selected applications that have been analyzed for that report.
To change the applications that are selected, click Change Selection on the right side of the toolbar. In the Application List, select the applications you want to include and then click Select to apply them.
Note:
- Effort Calculator ignores any applications that have not been analyzed or that are stale (need re-analyzing). This can sometimes lead to an apparent discrepancy between the number of applications that you select and the number of applications that are shown. For example, if you select 10 applications but only 8 of them have been analyzed for the selected report, Effort Calculator will show the total number of applications as 8.
- If you select a group and any of the applications in the group are unanalyzed or stale, the name of the group is shown with an asterisk (*) beside it.
Click Next to move to the next step.
2. Configure variables and view the results
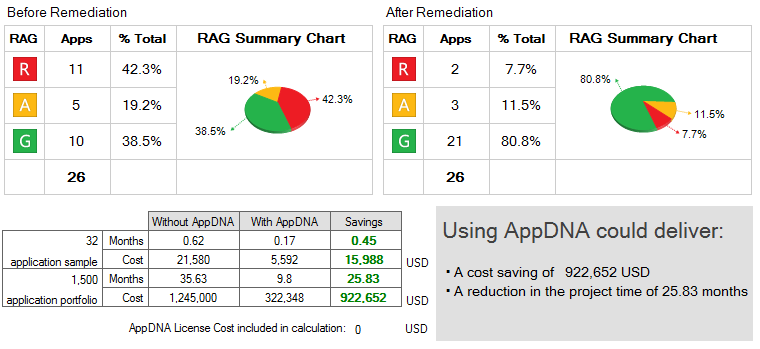
The main Effort Calculator screen provides a summary that gives an estimate of the effort required to remediate the applications in the portfolio for which there are known remediations while highlighting applications that require further testing or need to be treated as exceptions. Applications are considered exceptions if remediation is not possible. This means that the application may need to be redeveloped or decommissioned.
The summary includes two pie charts:
- Before remediation. The pie chart on the left side shows the current status of the applications.
- After remediation. The pie chart on the right side shows the expected status of the applications after the remediation steps have been completed. For example, if the current status of an application is amber but remediation options are available, the after remediation RAG is typically green, which indicates that the application is ready for UAT. However, if the standard RAG is red and the only remediation option is to redevelop the application, the after remediation RAG is also red to indicate that complex development and/or replacement is required. Effort Calculator considers these applications exceptions, because they fall outside of the scope of issues that can be resolved relatively easily. An amber after remediation RAG indicates that the application requires more testing than an application that has a green after action RAG.
Below the summary there are four tabs.
-
Variables. Provides a variety of variables that are used in the calculation. You can configure to suit the needs of your enterprise. The following table provides information about some of the less obvious variables.
Variable Description Number of applications in the full portfolio Defaults to the number of applications already imported. You can increase this to reflect the size of your actual application portfolio. AppDNA then extrapolates the effort to migrate the entire portfolio, based on the sample results. Currency See http://www.xe.com/iso4217.php for a list of international currency codes. Smoke testing time The time in hours to perform an initial install and run test, commonly known as a smoke test. This is not usually an in-depth test. - Default Value: 8 - Average time to complete the initial test phase with no dependencies on external parties or processes.
- Alternative A: 24 - When enterprise-specific processes are to be taken into account. For example, when the smoke test includes part of the application certification process and so there are time allotments for application owner expertise for installation, documentation, and initial testing.
- Alternative B: 4 - Light smoke-test process with automated installation and an execution script to test functionality at a very high level only.
Applications that are expected to have issues The number of applications that are expected to have issues as a percentage of the portfolio. The default value is derived from a variety of market sources, from analysts to technical engagement feedback. The value can vary based on enterprise-specific processes and application readiness. Applications that are expected to be exceptions The percentage of applications that cannot be remediated, or where a decision has been made not to remediate. This variable can change dramatically based on the application portfolio's age. An older portfolio typically has a greater percentage of incompatible applications. - Default Value: 10% - Based on empirical application rationalization data, organizations 'end of life' anywhere between 10% and 30%, depending on enterprise initiatives. Application incompatibility is often a key driver in the retirement decision. If variables such as the portfolio age are unknown, the default value should be used.
- Alternative A: 35% - Enterprise-specific mandates around application lifecycle management can stipulate an aggressive application retirement initiative tied to desktop migrations and refreshes.
- Alternative B: 5% - Enterprise-specific mandates can also be driven around ensuring that all applications are migrated, regardless of the mixtures of platforms necessary to support them.
Time to identify the cause of a failure and resolve it A per-application estimate of how long in hours it generally takes to identify a failure and fix it when AppDNA is not in use. - Default Value: 24 - Average time associated with a typical manual process around application testing and remediation with no external dependencies. Single point of testing and remediation.
- Alternative: 60 - Average time when additional enterprise-specific processes are to be taken into account - such as application owner expertise for installation, in-depth application-to-application testing, application-to-OS image testing from baseline to gold images, with all permutations in between.
Staging time The average number of hours to install an application in the target environment and ensure it is running. Size of remediation team This depends on the size of the application portfolio. Typically, there is one remediation specialist for every 250 applications. Size of testing/staging team This depends on the size of the application portfolio. Typically, there is one tester/stager for every 100 applications. Remediation time The rows represent the complexity of applications. AppDNA measures application complexity in terms of the number of files and registry entries. Configurable thresholds define whether an application is considered simple, normal or complex. You can configure the thresholds in Reporting Settings. For more information, see Reporting settings.
The columns represent the complexity of the remediation. AppDNA identifies issues in applications by running sophisticated heuristic algorithms during the analysis process. Each algorithm identifies a specific issue and has a recommended remediation action to mitigate that issue. The effort associated with these actions is categorized as easy, medium, or hard. The overall remediation effort for an application is based on the highest effort associated with the algorithms that the application triggers. You can optionally configure the remediation actions in the Algorithm Groups screen. For more information, see Configure algorithms.
- Results worksheet. Shows a breakdown of the applications in terms of the type of remediation (easy, medium, and hard) and the application complexity, along with the estimated testing and remediation times.
- Effort estimation with AppDNA. Shows an estimation of the total cost of the project if you use AppDNA.
- Effort estimation without AppDNA. Shows an estimation of the total cost of the project if you do not use AppDNA.
3. Export the results
You can export all of the Effort Calculator results (along with explanatory information) to a Word document. This requires Microsoft Word to be installed on the same computer as the AppDNA client.
To export this report, click Export on the main toolbar. After a short delay, Microsoft Word opens and displays the exported report.
Export variables
You can export your Effort Calculator variables - as an XML file for later retrieval. This makes it easy to compare different scenarios.
To export your Effort Calculator settings:
- From the AppDNA menus, choose Administration > Action Administration.
- On the toolbar in the Action Administration screen, click Export Action Settings.
- In the Save As dialog box, give the file an appropriate name and save it in an appropriate location.
To import the settings:
- From the AppDNA menus, choose Administration > Action Administration.
- On the toolbar in the Action Administration screen, click Import Action Settings.
- In the Open dialog box, navigate to the file that was previously exported.
- Click OK.