 View PDF


Variables
Aug 14, 2017
This topic documents the Effort Calculator variables. You can configure these to meet the needs of your enterprise. When you have finished, click Save on the toolbar at the top of the screen to save the changes.
General variables
These variables customize the report at a high level by defining project-specific information.
Customer name. The name of the company to be used in the report export.
Number of applications in the full portfolio. The total number of applications that you want to migrate to the new platform. This value defaults to the number of applications you have already imported into AppDNA. You can increase this to reflect the size of your actual application portfolio. AppDNA then extrapolates the effort to migrate the entire portfolio from the results for the sample.
Currency – The currency to be used in the report. Typically you express this using the three-character currency code. See http://www.xe.com/iso4217.php for a list of international currency codes.
Working hours per day. The number of hours in a typical working day. This affects all calculations relating to time, and can help improve the accuracy of time estimations.
Average working days in a month. The average number of days in a working month. This allows further refining of the time estimations.
Without AppDNA variables
These variables assist in the accuracy of the project estimation where AppDNA is not being used. This section provides the default values and some alternatives along with explanation about when they might be appropriate.
Smoke testing time. The time in hours to perform an initial install and run test, commonly known as a ‘smoke test’. This is not usually an in-depth test.
- Default Value: 8 - Average time to complete the initial test phase with no dependencies on external parties or processes.
- Alternative A: 24 - When enterprise-specific processes are to be taken into account. For example, when the smoke test includes part of the application certification process and so there are time allotments for application owner expertise for installation, documentation, and initial testing.
- Alternative B: 4 - Light smoke-test process with automated installation and an execution script to test functionality at a very high level only.
Applications that are expected to have issues. The number of applications that are expected to have issues as a percentage of the portfolio. The default value is 30%, which is derived from a variety of market sources, from analysts to technical engagement feedback. This varies from organization to organization based on enterprise-specific processes and application readiness.
Applications that are expected to be exceptions. Defines the percentage of applications that cannot be remediated, or where a decision has been made not to remediate. This variable can change dramatically based on the application portfolio’s age. An older portfolio typically has a greater percentage of incompatible applications than a new portfolio.
- Default Value: 10% - Based on empirical application rationalization data, organizations ‘end of life’ anywhere between 10% and 30%, depending on enterprise initiatives. Application incompatibility is often a key driver in the retirement decision. If variables such as the portfolio age are unknown, the default value should be used.
- Alternative A: 35% - Enterprise-specific mandates around application lifecycle management can stipulate an aggressive application retirement initiative tied to desktop migrations and refreshes.
- Alternative B: 5% - Enterprise-specific mandates can also be driven around ensuring that all applications are migrated, regardless of the mixtures of platforms necessary to support them.
Time to identify the cause of a failure and resolve it - This is a per-application estimate of how long in hours it generally takes to identify a failure and fix it when AppDNA is not in use.
- Default Value: 24 - Average time associated with a typical manual process around application testing and remediation with no external dependencies. Single point of testing and remediation.
- Alternative: 60 - Average time when additional enterprise-specific processes are to be taken into account - such as application owner expertise for installation, in-depth application-to-application testing, application-to-OS image testing from baseline to gold images, with all permutations in between.
With AppDNA variables
AppDNA uses these variables when estimating time and cost for handling the portfolio when AppDNA is in use.
Applications that have MSI installation package. Enter this value as a percentage of the entire portfolio. You import Windows applications into AppDNA using their installation packages. These can be MSI installation packages, App-V .sft or .appv files, or any other type of installation files. MSIs, and .sft and .appv files are more straight-forward to import than other types of installation packages. Effort Calculator takes the figure entered here into account when estimating the time AppDNA will take to process the applications.
AppDNA license cost. This variable can optionally be used to provide a more accurate cost breakdown in the ROI results.
Staffing variables
These variables affect the calculations with and without AppDNA.
Staging time. The average time (in hours) to install an application in the target environment and ensure it is running. The default value is 2 hours.
Size of remediation team. The number of staff that are in the remediation team for the project. This depends on the size of the application portfolio. Typically, there is one remediation specialist for every 250 applications. The default value is 3.
Size of testing/staging team. The number of staff that are in the testing and/or staging team for the project. This depends on the size of the application portfolio. Typically, there is one tester/stager for every 100 applications. The default value is 5.
Remediator cost per day. The average cost per day of remediation staff.
Tester/stager cost per day. The average cost per day of testers and stagers.
Project manager cost per day. The average cost per day of project managers.
Testing and remediation variables
The testing and remediation variables section provides a grid in which you can enter the time it takes to remediate and test applications of different complexities. Enter the time in hours.
Remediation time. Enter the average number of hours it takes to remediate applications of the different complexities.
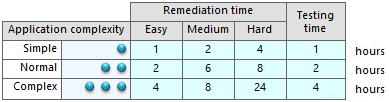
The rows represent the complexity of applications. AppDNA measures application complexity in terms of the number of files and registry entries. Configurable thresholds define whether an application is considered simple, normal or complex. You can configure the thresholds in Reporting Settings. See Reporting settings for more information.
The columns represent the complexity of the remediation. AppDNA identifies issues in applications by running sophisticated heuristic algorithms during the analysis process. Each algorithm identifies a specific issue and has a recommended remediation action to mitigate that issue. The effort associated with these actions is categorized as easy, medium, or hard. The overall remediation effort for an application is based on the highest effort associated with the algorithms that the application triggers. You can optionally configure the remediation actions in the Algorithm Groups screen. See Configure algorithms for more information.
Testing time. Enter the average number of hours it takes to test applications of different complexities.
When you have finished entering the variables, click Save on the toolbar at the top of the screen to save the changes.