 View PDF


Effort Calculator Worksheets
Aug 14, 2017
Results worksheet
The Results worksheet tab shows:
- The number of applications that require easy, medium, and hard remediation for each application complexity level.
- The number of applications that do not require remediation, broken down into no issues detected (No Issues), need to be tested (To test), and exceptions (Exceptions).
- A breakdown of the remediation and testing hours required for applications that require remediation.
- A breakdown of the number of testing hours required for applications that do not require remediation.
- The total remediation and testing times.
Results worksheet walk through
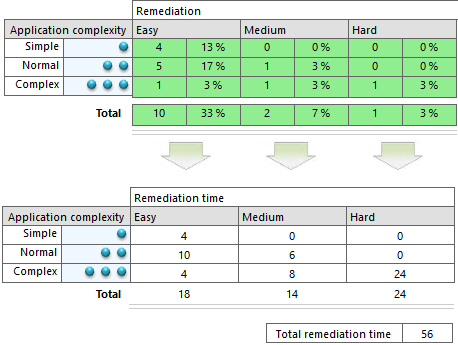
In the excerpt from the results worksheet shown above, take a look at the applications that have issues that require an easy level of remediation effort – there are 4 simple applications, 5 normal applications, and 1 complex application.
Now take a look at the “Testing and remediation” variables. This is where you enter the time it takes to remediate applications of different complexities for each of the three categories of remediation effort (easy, medium and hard). Similarly, you enter the time it takes to test applications of the three complexity levels.
The default values for the easy remediation effort are 1 hour for simple applications, 2 hours for normal applications, and 4 hours for complex applications. These values are used to derive the results in the Easy column in the Remediation table:
pre codeblock
6 simple applications x 1 hour = 6 hours
4 normal complexity applications x 2 hours = 8 hours
3 complex applications x 4 hours = 12 hours
AppDNA uses similar calculations to derive the other values in the worksheet.
Effort estimation with AppDNA
The Effort estimation with AppDNA tab shows the total cost of the project using AppDNA, a breakdown of the cost per application, and the remediation and testing times. The report shows results for the selected applications, and extrapolated results for all of the applications in the portfolio.
This tab focuses on applications that were green before remediation (no remediation required), amber after remediation (issues that require testing), and green after remediation (applications with issues for remediation). Applications marked as red are considered exceptions and are not included because they require redevelopment or replacement and fall outside of the scope of issues that can be resolved easily.
The following table explains the table columns:
| Column | Description |
|---|---|
| Applications | The number of applications falling in each of the remediation categories shown on the side (“Green before”, “Green after”, and “Amber after”). |
| Staging | The time in hours to stage the applications for testing. |
| Testing | The time in hours to test the applications. |
| Remediation | The time in hours to remediate the issues. |
Notice that the “Green before” and “Amber after” rows do not have any remediation hours. This is because “Green before” requires no testing or remediation and “Amber after” only requires testing.
The total number of hours and days are provided along with the cost and the elapsed days to execute the project. These are dependent on the numbers entered for the “Size of remediation team” and “Size of staging/testing team” variables in the “Staffing variables” sections on the Variables tab.
Effort estimation without AppDNA
The Effort estimation without AppDNA tab shows the total cost of the project without using AppDNA, a breakdown of the cost, and the remediation and testing times. The report shows results for the selected applications and for all the applications in the portfolio.
The following table explains the table columns:
| Column | Description |
|---|---|
| % | The percentage of applications that require staging, testing, and for which issues need to be identified and fixed. |
| Apps | The number of applications selected. |
| hr | The time in hours. |
The second set of tables show the estimated number of days for staging, testing, and fixing and identifying issues, along with the cost of each stage. In calculating these figures, AppDNA uses the values entered in the Without AppDNA variables section. For example, the percentage for “Fix and identify” comes from the value entered for the “Applications that are expected to have issues” variable. The value entered for the “Time to identify the cause of a failure and resolve it” variable contributes to the time calculations.
The time to execute the project is calculated in elapsed days. These are dependent on the numbers entered for the “Size of remediation team” and “Size of staging/testing team” variables in the “Staffing variables” section on the Variables tab.