 View PDF


Reporting settings
Aug 14, 2017
The Settings dialog box contains general AppDNA options. To open this dialog box, choose Edit > Settings from the menus.
The options on the Reporting page are:
Records per page – Specifies the number of applications that appear on a report view page. When the value is very large (for example, more than 500), performance may deteriorate – for example, scrolling may become jerky and the page may take too long to display. The default is 100.
This setting is automatically updated when you change the number of records on the page in the Report Viewer itself. However, it is useful to be able to change the value here if it has inadvertently been set it to a very large value and the page becomes unusably slow.
This setting does not affect the AppDNA web client. For information about changing the number of records per page in the AppDNA web client, see Report issues.
Show counts in PDF exports – Select this check box to show in the Report Data section of the PDF exports, columns for all of the algorithm groups in the report. These columns show how many times the application has triggered the algorithms in the group. (An application can potentially trigger the same algorithm multiple times – for example, when the same issue is detected in multiple components.) By default, those columns are hidden in PDF exports so that reports with many algorithm groups fit the available space.
Application complexity thresholds – The more files and registry entries an application has, the more complex it is to remediate and test. Therefore application complexity is measured by the number of files and registry entries within the application. AppDNA defines three levels of application complexity – simple, normal, and complex. The thresholds define the lower and upper bounds of what constitutes a normal complexity application.
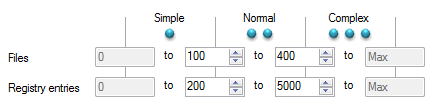
The default threshold values are based on extensive testing, but you can adjust them if required. The default threshold values are:
| Lower threshold | Upper threshold | |
|---|---|---|
| Number of files | 100 | 400 |
| Number of registry entries | 200 | 5,000 |
The following table shows the icon for each application complexity level and provides an example based on the default thresholds.
| Icon | Definition | Example |
|---|---|---|
 |
Simple – Applications that have fewer files than the lower files threshold and fewer registry entries than the lower registry entries threshold. | 90 files and 150 registry entries. |
 |
Normal – Applications whose file or registry entry count is equal to or greater than the respective lower threshold and both counts are less than the upper thresholds. | 132 files and 195 registry entries. |
 |
Complex – Applications whose file or registry entry count is equal to or greater than the respective upper threshold. | 832 files and 5,175 registry entries. |
The Effort Calculator uses the application complexity when estimating the time and effort involved in a migration project. In addition, the application complexity icons are shown in some of the report views – for example, the Overview Summary.