-
-
Monitor and support
This content has been machine translated dynamically.
Dieser Inhalt ist eine maschinelle Übersetzung, die dynamisch erstellt wurde. (Haftungsausschluss)
Cet article a été traduit automatiquement de manière dynamique. (Clause de non responsabilité)
Este artículo lo ha traducido una máquina de forma dinámica. (Aviso legal)
此内容已经过机器动态翻译。 放弃
このコンテンツは動的に機械翻訳されています。免責事項
이 콘텐츠는 동적으로 기계 번역되었습니다. 책임 부인
Este texto foi traduzido automaticamente. (Aviso legal)
Questo contenuto è stato tradotto dinamicamente con traduzione automatica.(Esclusione di responsabilità))
This article has been machine translated.
Dieser Artikel wurde maschinell übersetzt. (Haftungsausschluss)
Ce article a été traduit automatiquement. (Clause de non responsabilité)
Este artículo ha sido traducido automáticamente. (Aviso legal)
この記事は機械翻訳されています.免責事項
이 기사는 기계 번역되었습니다.책임 부인
Este artigo foi traduzido automaticamente.(Aviso legal)
这篇文章已经过机器翻译.放弃
Questo articolo è stato tradotto automaticamente.(Esclusione di responsabilità))
Translation failed!
Monitor and support
You can use the XenMobile® Dashboard and the XenMobile Support page to monitor and troubleshoot your XenMobile Server. Use the XenMobile Support page to access support-related information and tools.
For an on-premises XenMobile Server, you can also perform actions from the XenMobile CLI. For details, see Command-line interface options.
In the XenMobile console, click the wrench icon in the upper-right corner.

The Troubleshooting and Support page appears.
Use the XenMobile Support page to:
- Access diagnostics.
- Create support bundles (on-premises installations only).
- Access links to Citrix Product Documentation and the Knowledge Center.
- Access log operations.
- Use advanced configuration options.
- Access a set of tools and utilities.
You can also view information at a glance by accessing your XenMobile console dashboard. With this information, you can see issues and successes quickly by using widgets.
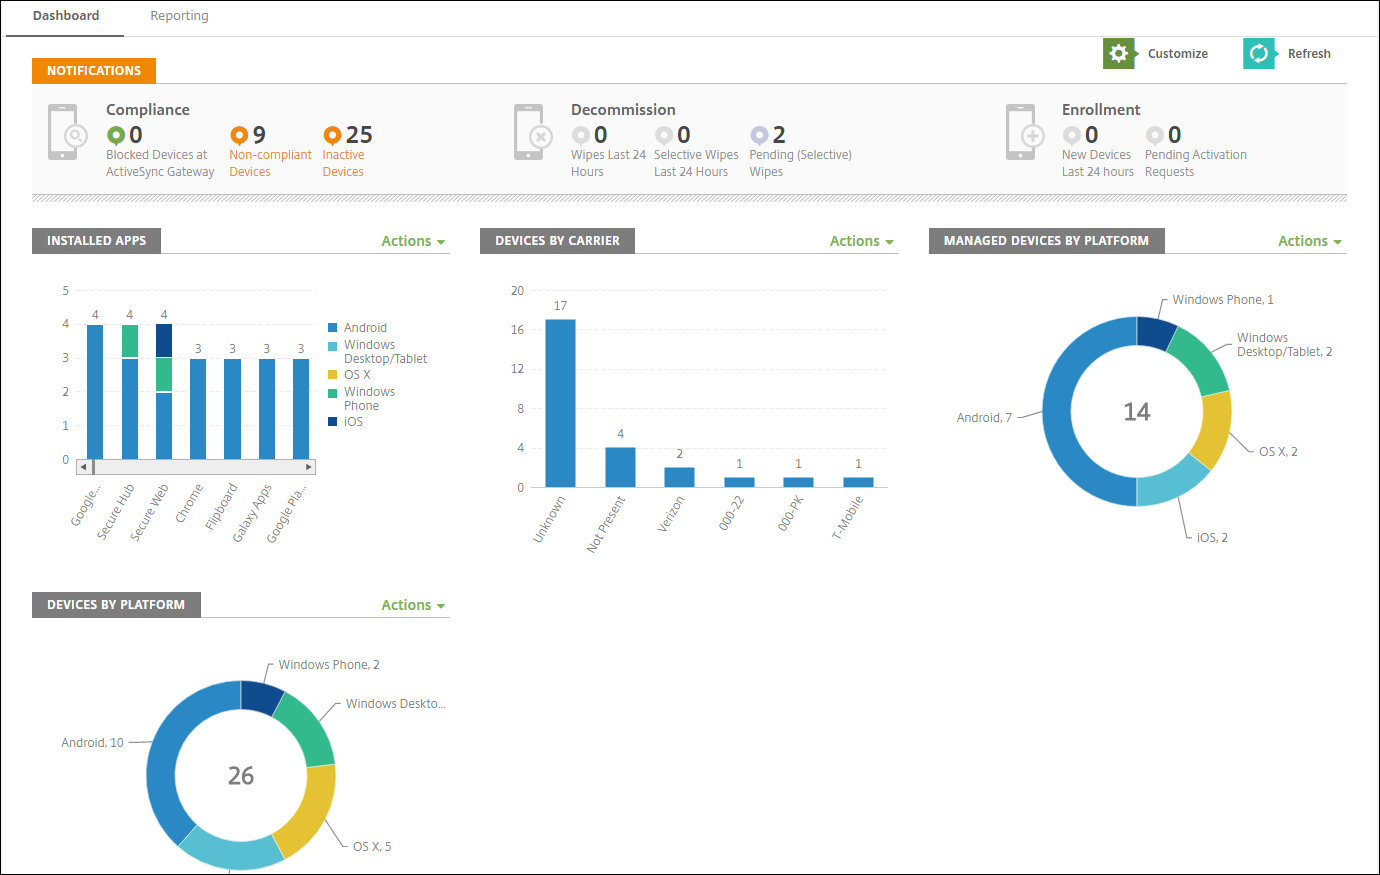
The dashboard is usually the page that first appears when you sign on to the XenMobile console. To access the dashboard from elsewhere in the console, click Analyze. Click Customize on the dashboard to edit the layout of the page and to edit the widgets that appear.
- My Dashboards: You can save up to four dashboards. You can edit these dashboards separately and view each one by selecting the saved dashboard.
- Layout Style: In this row, you can select how many widgets appear on your dashboard and how the widgets are laid out.
-
Widget Selection: You can choose which information appears on your dashboard.
- Notifications: Mark the checkbox above the numbers on the left to add a Notifications bar above your widgets. This bar shows the number of compliant devices, inactive devices, and devices wiped or enrolled in the last 24 hours.
- Devices By Platform: Displays the number of managed and unmanaged devices by platform.
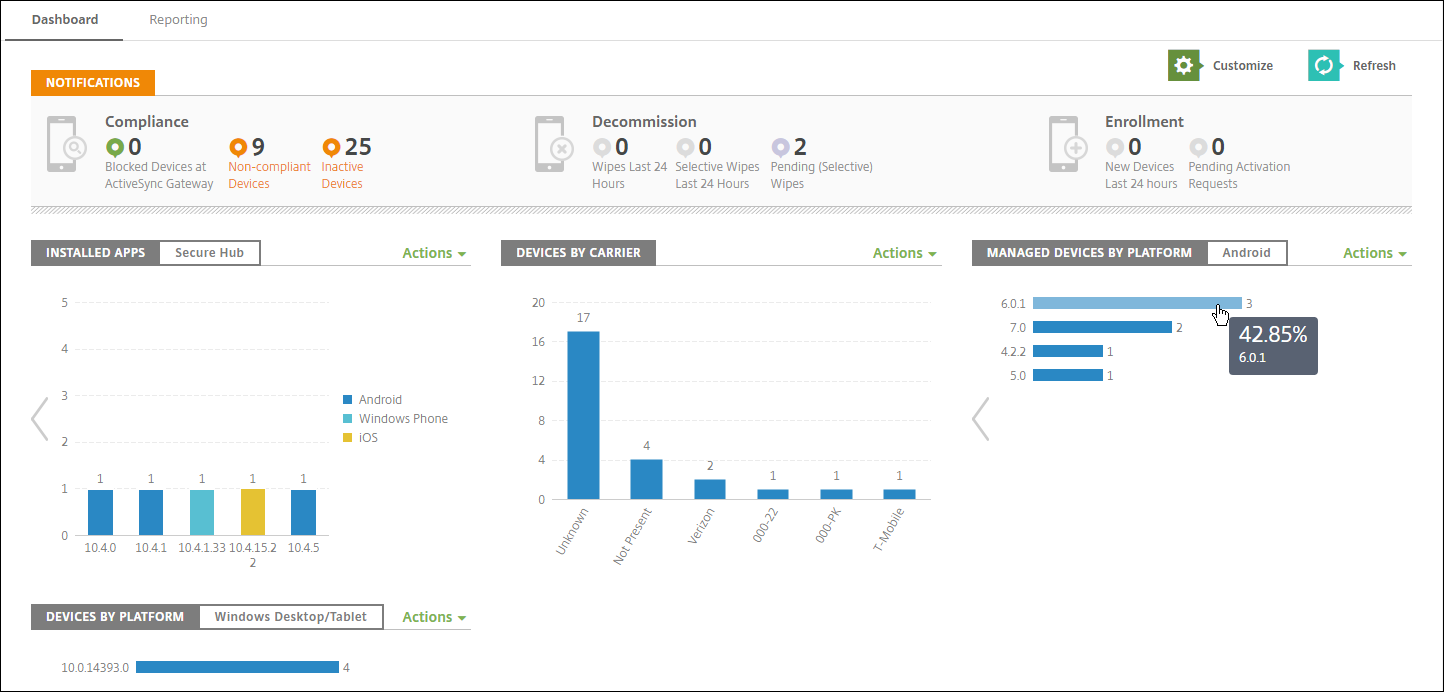
- Devices By Carrier: Displays the number of managed and unmanaged devices by carrier. Click each bar to see a breakdown by platform.
- Managed Devices By Platform: Displays the number of managed devices by platform.
- Unmanaged Devices By Platform: Displays the number of unmanaged devices by platform. Devices that appear in this chart might have an agent installed on them, but have had their privileges revoked or have been wiped.
- Devices By ActiveSync Gateway Status: Displays the number of devices grouped by ActiveSync Gateway status. The information shows Blocked, Allowed, or Unknown status. You can click each bar to break down the data by platform.
- Devices By Ownership: Displays the number of devices grouped by ownership status. The information shows corporate-owned, employee-owned, or unknown ownership status.
- Failed Delivery Group Deployments: Displays the total number of failed deployments per package. Only packages that have failed deployments appear.
- Devices By Blocked Reason: Displays the number of devices blocked by ActiveSync
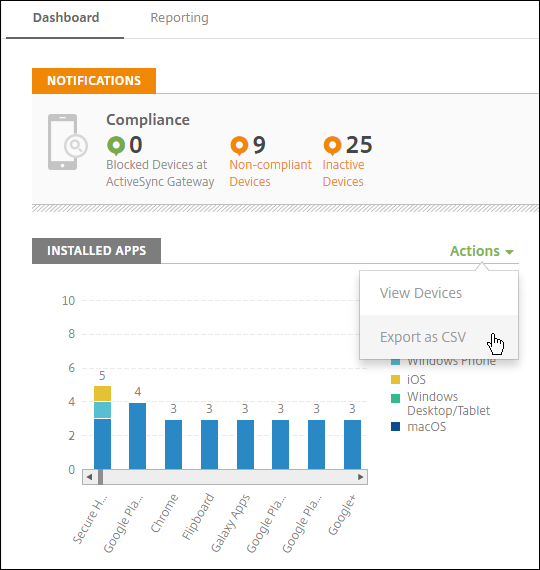
- Installed Apps: Type an app name for a graph of app information.
- Volume Purchase Apps License Usage: Displays license usage statistics for Apple volume purchase apps.
With each widget, you can click the individual parts to drill down for more information.
You can also export the information as a .csv file by clicking the Action menu.
Share
Share
In this article
This Preview product documentation is Citrix Confidential.
You agree to hold this documentation confidential pursuant to the terms of your Citrix Beta/Tech Preview Agreement.
The development, release and timing of any features or functionality described in the Preview documentation remains at our sole discretion and are subject to change without notice or consultation.
The documentation is for informational purposes only and is not a commitment, promise or legal obligation to deliver any material, code or functionality and should not be relied upon in making Citrix product purchase decisions.
If you do not agree, select I DO NOT AGREE to exit.