-
Getting Started with Citrix ADC
-
Deploy a Citrix ADC VPX instance
-
Install a Citrix ADC VPX instance on Microsoft Hyper-V servers
-
Install a Citrix ADC VPX instance on Linux-KVM platform
-
Prerequisites for Installing Citrix ADC VPX Virtual Appliances on Linux-KVM Platform
-
Provisioning the Citrix ADC Virtual Appliance by using OpenStack
-
Provisioning the Citrix ADC Virtual Appliance by using the Virtual Machine Manager
-
Configuring Citrix ADC Virtual Appliances to Use SR-IOV Network Interface
-
Configuring Citrix ADC Virtual Appliances to use PCI Passthrough Network Interface
-
Provisioning the Citrix ADC Virtual Appliance by using the virsh Program
-
Provisioning the Citrix ADC Virtual Appliance with SR-IOV, on OpenStack
-
Configuring a Citrix ADC VPX Instance on KVM to Use OVS DPDK-Based Host Interfaces
-
-
Deploy a Citrix ADC VPX instance on Microsoft Azure
-
Network architecture for Citrix ADC VPX instances on Microsoft Azure
-
Configure multiple IP addresses for a Citrix ADC VPX standalone instance
-
Configure a high-availability setup with multiple IP addresses and NICs
-
Configure a high-availability setup with multiple IP addresses and NICs by using PowerShell commands
-
Configure HA-INC nodes by using the Citrix high availability template with Azure ILB
-
Configure address pools (IIP) for a Citrix Gateway appliance
-
-
Upgrade and downgrade a Citrix ADC appliance
-
Solutions for Telecom Service Providers
-
Load Balance Control-Plane Traffic that is based on Diameter, SIP, and SMPP Protocols
-
Provide Subscriber Load Distribution Using GSLB Across Core-Networks of a Telecom Service Provider
-
Authentication, authorization, and auditing application traffic
-
Configuring authentication, authorization, and auditing policies
-
Configuring Authentication, authorization, and auditing with commonly used protocols
-
Use an on-premises Citrix Gateway as the identity provider for Citrix Cloud
-
Troubleshoot authentication issues in Citrix ADC and Citrix Gateway with aaad.debug module
-
-
-
-
-
-
Persistence and persistent connections
-
Advanced load balancing settings
-
Gradually stepping up the load on a new service with virtual server–level slow start
-
Protect applications on protected servers against traffic surges
-
Retrieve location details from user IP address using geolocation database
-
Use source IP address of the client when connecting to the server
-
Use client source IP address for backend communication in a v4-v6 load balancing configuration
-
Set a limit on number of requests per connection to the server
-
Configure automatic state transition based on percentage health of bound services
-
-
Use case 2: Configure rule based persistence based on a name-value pair in a TCP byte stream
-
Use case 3: Configure load balancing in direct server return mode
-
Use case 6: Configure load balancing in DSR mode for IPv6 networks by using the TOS field
-
Use case 7: Configure load balancing in DSR mode by using IP Over IP
-
Use case 10: Load balancing of intrusion detection system servers
-
Use case 11: Isolating network traffic using listen policies
-
Use case 12: Configure Citrix Virtual Desktops for load balancing
-
Use case 13: Configure Citrix Virtual Apps for load balancing
-
Use case 14: ShareFile wizard for load balancing Citrix ShareFile
-
-
-
-
-
Authentication and authorization
-
-
Configuring a CloudBridge Connector Tunnel between two Datacenters
-
Configuring CloudBridge Connector between Datacenter and AWS Cloud
-
Configuring a CloudBridge Connector Tunnel Between a Datacenter and Azure Cloud
-
Configuring CloudBridge Connector Tunnel between Datacenter and SoftLayer Enterprise Cloud
-
Configuring a CloudBridge Connector Tunnel Between a Citrix ADC Appliance and Cisco IOS Device
-
CloudBridge Connector Tunnel Diagnostics and Troubleshooting
This content has been machine translated dynamically.
Dieser Inhalt ist eine maschinelle Übersetzung, die dynamisch erstellt wurde. (Haftungsausschluss)
Cet article a été traduit automatiquement de manière dynamique. (Clause de non responsabilité)
Este artículo lo ha traducido una máquina de forma dinámica. (Aviso legal)
此内容已经过机器动态翻译。 放弃
このコンテンツは動的に機械翻訳されています。免責事項
이 콘텐츠는 동적으로 기계 번역되었습니다. 책임 부인
Este texto foi traduzido automaticamente. (Aviso legal)
Questo contenuto è stato tradotto dinamicamente con traduzione automatica.(Esclusione di responsabilità))
This article has been machine translated.
Dieser Artikel wurde maschinell übersetzt. (Haftungsausschluss)
Ce article a été traduit automatiquement. (Clause de non responsabilité)
Este artículo ha sido traducido automáticamente. (Aviso legal)
この記事は機械翻訳されています.免責事項
이 기사는 기계 번역되었습니다.책임 부인
Este artigo foi traduzido automaticamente.(Aviso legal)
这篇文章已经过机器翻译.放弃
Questo articolo è stato tradotto automaticamente.(Esclusione di responsabilità))
Translation failed!
How to record a packet trace on Citrix ADC
You can record a packet trace using the Citrix ADC GUI. The trace is stored in nstrace.cap.
- Navigate to System > Diagnostics.
- Click Start new trace under Technical Support Tools.
-
In the Start Trace page update the following fields:
-
Packet Size - Enter the size of the packet to capture during the trace. Enter 0 for full packet trace.
- Default value: 164
- Minimum value: 0
- Maximum value: 1514
-
Capture trace in .pcap format - You have the option to capture a packet trace in nstrace (.cap) or TCP dump (.pcap) format. By default, the packet trace is captured in nstrace format (.cap) and it is the recommended format. To capture trace in TCP dump format, select Capture trace in .pcap format.
-
Capture SSL Master keys - To analyze the traces better, enable the Capture SSL Master keys option. This setting captures SSL keys for the current session, which are necessary to decrypt encrypted data. The SSL keys are stored in a file named
nstrace.sslkeys.- When you click Start to initiate the trace with the Capture SSL Master keys option enabled, a security warning message is displayed. Acknowledge this warning to proceed.
- When the private key is not available or not shared, consider exporting SSL session keys as an alternative to the private key.
-
Number of trace files - Enter the number of trace files to be generated during the trace.
- Default value: 24
- Minimum value: 1
- Maximum value: 100
- Trace File name - Enter the name for the trace file.
- Trace File ID - Enter the file ID for the trace file.
-
Duration of data per file (seconds) - Enter the time (in seconds) to capture the data for each trace file.
- Default value: 3600
- Minimum value: 1
-
File size - Enter the file size (in MB) for each trace file.
- Default value: 1024
- Minimum value: 0
- Maximum value: 10240
When the trace reaches the specified file size, a new trace starts. If the free disk space is less than 2 GB, the trace stops.
-
Trace Buffers - Enter the number of trace buffers (temporary storage) to store the packet capture. Each buffer is about 16 KB.
- Default value: 5000
- Minimum value: 1000
-
-
Enter the Filter Expression.
Adding filter expressions for IP address, port, VLAN, or interface ensures capturing only the relevant traffic and reduces the load on Citrix ADC during the packet trace.
-
Select the Merge option from the list.
- ONSTOP - The temporary trace files are merged into a single trace file.
- NOMERGE - The trace files are not merged.
- ONTHEFLY - The trace files are merged without creating any temporary file.
Default value: ONSTOP
-
Select the relevant option from the additional packet capture options available.
Default value: Do Runtime cleanup
-
Select the required options in Capturing Mode.
By default, Packets buffered for Transmission (TXB) and Receive packets after NIC pipelining (NEW_RX) are selected. To decrypt the trace without a private key, select Decrypted SSL packets (SSLPLAIN).
-
Click Start to start recording the network packet trace.
-
In the Stop Trace page, click Stop and Download to stop recording the network packet trace after the test is complete.
-
In the Delete/Download Trace files page, select the file, click Download, and then click Close.
Open the trace file with the Wireshark utility to display the content of the file.
We recommend you to use the recent Wireshark version from the automated build section available in the following webpage: http://www.wireshark.org/download/automated.
Use case to capture a packet trace with virtual server IP filter (both front-end and back end)
Using a filter of the virtual server IP address and enabling the option “–link” in CLI or select the option “Trace filtered connection peer traffic” in GUI, you can capture both the front end and back-end traffic for that particular IP address. With this option it is not recommended to mention a source IP or destination IP filter.
start nstrace -size 0 -filter "CONNECTION.IP.EQ(1.1.1.1)" -link ENABLED

show nstrace
        State:  RUNNING          Scope:  LOCAL            TraceLocation:  "/var/nstrace/24Mar2017_16_00_19/..." Nf:  24                  Time:  3600              Size:  0                 Mode:  TXB NEW_RX
        Traceformat:  NSCAP      PerNIC:  DISABLED        FileName:  24Mar2017_16_00_19 Filter:  "CONNECTION.IP.EQ(1.1.1.1)" Link:  ENABLED           Merge:  ONSTOP           Doruntimecleanup:  ENABLED
        TraceBuffers:  5000      SkipRPC:  DISABLED       Capsslkeys:  DISABLED    InMemoryTrace:  DISABLED
<!--NeedCopy-->
Capturing cyclic traces
It is always challenging to troubleshoot an intermittent issue. Cyclic tracing is best suited for issues which are intermittent. The traces can be run over a span of few hours or days before the issue occurs. Also, you can use a specific filter and evaluate the size of the trace files that are generated before you run it for a longer time.
Run the following command from the CLI:
start nstrace -nf 60 -time 30 -size 0
This particular trace will create 60 files each of them for 30 sec. This means the files will start getting overwritten after 60 trace files or 30 mins
Show nstrace - To check the status of the nstrace
Stop nstrace - To stop the nstrace.

<!--NeedCopy-->
Best Practices
On a unit handling GB of traffic per second, capturing traffic is a very resource intensive process. The impact to resources is mainly in terms of the CPU and the disk space. Disk space impact can be reduced by using filtering expressions. However, the impact on the CPU remains and sometimes causes a slight increase as the appliance now needs to process packets according to the filter before capturing them.
The best practice about tracing is:
- The duration for which the trace is run must be as limited as possible when you still ensure the packets of interest are captured.
- Schedule the tracing activity to happen at a time when the number of users (and hence the traffic) is greatly reduced, such as during off hours.
How the Citrix ADC traces are decrypted
This section explains how to ensure that the Citrix ADC traces are decrypted.
Points to remember
You ensure that several configuration settings for SSL virtual server and ServiceGroups are done. It helps to make sure that traces are decrypted. Citrix also provides additional information on what is needed and how to take the traces. It helps in capturing relevant data.
Instructions to ensure Citrix ADC traces are decrypted
While taking a Citrix ADC trace, you must start determining what kind of traces you are taking. Also, you must be aware of all the components involved. Consider an example, a content switch might redirect to a load balancing virtual server with a Service Group, or a Gateway virtual server. It might point the Session Profile to the load balancing virtual server, which uses a Service Group. Citrix recommends you to remove the load balancer to simplify troubleshooting. If that is not possible, you suspect the load balancer as part of the problem. You have three options (Gateway virtual server, load balance virtual server, and load balance Service Group) to modify and ensure traces are decrypted.
Note
The steps to decrypt the traces remain the same for content switching and other SSL virtual servers.
-
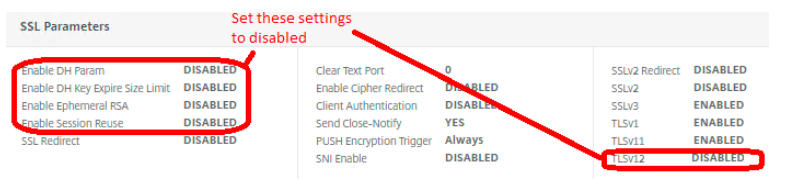
Gateway virtual server. In Gateway virtual server, modify the SSL parameters as per the following:
- Disable DH param
- Disable DH Key Expire Size
- Disable Ephemeral RSA
- Disable Session Reuse
- Disable TLS 1.2, but ensure TLS 1.1 and 1.0 is enabled
-
Load balancing SSL virtual server. The settings in a load balancing SSL virtual server remains the same as the Gateway virtual server.
- Disable DH param
- Disable DH Key Expire Size
- Disable Ephemeral RSA
- Disable Session Reuse
- Disable TLS 1.2, but ensure TLS 1.1 and 1.0 is enabled
-
Finally, adjust the Service Group.
-
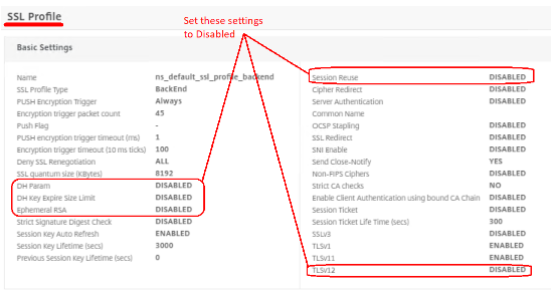
Service Group SSL parameters (no SSL profile)
- Disable Session Reuse
- Disable TLS 1.2, but ensure TLS 1.1 and is enabled

Note
You repeat this step for each service if using individual services. Also, if using an SSL Profile, you have to adjust it, either for each Service or for the Service Group.
-
Service Group SSL Profile or individual services
- Disable DH param
- Disable DH Key Expire Size
- Disable Ephemeral Reuse
- Disable session Reuse
- Disable TLS 1.2, but ensure TLS 1.1 and 1.0 is enabled
-
-
Ensure the following settings are done to set up the trace. Do not modify the rest of the settings.
- Packet Size: 0
- File Size: 0
- Trace Filtered connections peer traffic: Checked
- Capture SSL Master Keys: Checked
- Click Start. You receive a warning. Click OK.
- You receive a notice that the trace is started.
-
Open a new incognito browser window. It is for the SSL Client Hello, so it is not missed. If using a mobile device, close all the apps before beginning, it is important. If the beginning of the SSL handshake is not captured, the Citrix ADC cannot decrypt the traces. You ensure the trace is started before accessing a login webpage or opening any mobile app.
-
Login and duplicate the issue. Once the issue is duplicated, wait for 1-2 minutes. The waiting time might be because of an interruption or loading error or ICA timeout. It results in a RESET packet being sent and if you do not wait, you might miss the reset, which can contain valuable information.
-
You can stop the trace once the issue is replicated and have waited as recommended. Download both the
sslkeysfiles (there can be more than 1) and the ns trace file. -
Gather IPs of all relevant devices: Citrix ADC, Client, Gateway URL, back-end Server, VDA if ICA traffic, and StoreFront.
-
Now that you have the traces and IPs, generate a new Support file from the Citrix ADC. You can do it after taking the traces. It allows you to corelate logs and counters from the support file with events in the traces. It can be essential when troubleshooting the complex issues.
The following section describes the purpose and impact of the settings:
-
SSL Session Reuse. It is a mechanism that speeds up the SSL transaction, which speeds up the client communication. The impact of disabling is that some clients using SSL Reuse might have to reconnect to the SSL Session. However, you cannot always decrypt when Session Reuse is enabled.
-
DH Parameters. DH refers to Diffie-Hellman and ciphers which use DH often do not decrypt. It is better to disable DH parameters to ensure decryption.
-
Ephemeral RSA. You disable Ephemeral RSA to prevent the Citrix ADC from trying to use ECC curve ciphers, which you cannot decrypt. Users reconnect if using the ECC Curves when disabled.
-
TLS 1.2. It is not necessary to disable TLS 1.2. However, you tend to have fewer decryption issues when disabling TLS 1.2. Users have to reconnect if using TLS 1.2, when disabled.
Share
Share
This Preview product documentation is Cloud Software Group Confidential.
You agree to hold this documentation confidential pursuant to the terms of your Cloud Software Group Beta/Tech Preview Agreement.
The development, release and timing of any features or functionality described in the Preview documentation remains at our sole discretion and are subject to change without notice or consultation.
The documentation is for informational purposes only and is not a commitment, promise or legal obligation to deliver any material, code or functionality and should not be relied upon in making Cloud Software Group product purchase decisions.
If you do not agree, select I DO NOT AGREE to exit.