-
Getting Started with Citrix ADC
-
Deploy a Citrix ADC VPX instance
-
Optimize Citrix ADC VPX performance on VMware ESX, Linux KVM, and Citrix Hypervisors
-
Apply Citrix ADC VPX configurations at the first boot of the Citrix ADC appliance in cloud
-
Install a Citrix ADC VPX instance on Microsoft Hyper-V servers
-
Install a Citrix ADC VPX instance on Linux-KVM platform
-
Prerequisites for Installing Citrix ADC VPX Virtual Appliances on Linux-KVM Platform
-
Provisioning the Citrix ADC Virtual Appliance by using OpenStack
-
Provisioning the Citrix ADC Virtual Appliance by using the Virtual Machine Manager
-
Configuring Citrix ADC Virtual Appliances to Use SR-IOV Network Interface
-
Configuring Citrix ADC Virtual Appliances to use PCI Passthrough Network Interface
-
Provisioning the Citrix ADC Virtual Appliance by using the virsh Program
-
Provisioning the Citrix ADC Virtual Appliance with SR-IOV, on OpenStack
-
Configuring a Citrix ADC VPX Instance on KVM to Use OVS DPDK-Based Host Interfaces
-
-
Deploy a Citrix ADC VPX instance on AWS
-
Deploy a VPX high-availability pair with elastic IP addresses across different AWS zones
-
Deploy a VPX high-availability pair with private IP addresses across different AWS zones
-
Configure a Citrix ADC VPX instance to use SR-IOV network interface
-
Configure a Citrix ADC VPX instance to use Enhanced Networking with AWS ENA
-
Deploy a Citrix ADC VPX instance on Microsoft Azure
-
Network architecture for Citrix ADC VPX instances on Microsoft Azure
-
Configure multiple IP addresses for a Citrix ADC VPX standalone instance
-
Configure a high-availability setup with multiple IP addresses and NICs
-
Configure a high-availability setup with multiple IP addresses and NICs by using PowerShell commands
-
Configure a Citrix ADC VPX instance to use Azure accelerated networking
-
Configure HA-INC nodes by using the Citrix high availability template with Azure ILB
-
Configure a high-availability setup with Azure external and internal load balancers simultaneously
-
Configure address pools (IIP) for a Citrix Gateway appliance
-
Upgrade and downgrade a Citrix ADC appliance
-
Solutions for Telecom Service Providers
-
Load Balance Control-Plane Traffic that is based on Diameter, SIP, and SMPP Protocols
-
Provide Subscriber Load Distribution Using GSLB Across Core-Networks of a Telecom Service Provider
-
Authentication, authorization, and auditing application traffic
-
Basic components of authentication, authorization, and auditing configuration
-
On-premises Citrix Gateway as an identity provider to Citrix Cloud
-
Authentication, authorization, and auditing configuration for commonly used protocols
-
Troubleshoot authentication and authorization related issues
-
-
-
-
-
-
-
Persistence and persistent connections
-
Advanced load balancing settings
-
Gradually stepping up the load on a new service with virtual server–level slow start
-
Protect applications on protected servers against traffic surges
-
Retrieve location details from user IP address using geolocation database
-
Use source IP address of the client when connecting to the server
-
Use client source IP address for backend communication in a v4-v6 load balancing configuration
-
Set a limit on number of requests per connection to the server
-
Configure automatic state transition based on percentage health of bound services
-
-
Use case 2: Configure rule based persistence based on a name-value pair in a TCP byte stream
-
Use case 3: Configure load balancing in direct server return mode
-
Use case 6: Configure load balancing in DSR mode for IPv6 networks by using the TOS field
-
Use case 7: Configure load balancing in DSR mode by using IP Over IP
-
Use case 10: Load balancing of intrusion detection system servers
-
Use case 11: Isolating network traffic using listen policies
-
Use case 12: Configure Citrix Virtual Desktops for load balancing
-
Use case 13: Configure Citrix Virtual Apps for load balancing
-
Use case 14: ShareFile wizard for load balancing Citrix ShareFile
-
Use case 15: Configure layer 4 load balancing on the Citrix ADC appliance
-
-
-
-
Authentication and authorization for System Users
-
-
Configuring a CloudBridge Connector Tunnel between two Datacenters
-
Configuring CloudBridge Connector between Datacenter and AWS Cloud
-
Configuring a CloudBridge Connector Tunnel Between a Datacenter and Azure Cloud
-
Configuring CloudBridge Connector Tunnel between Datacenter and SoftLayer Enterprise Cloud
-
Configuring a CloudBridge Connector Tunnel Between a Citrix ADC Appliance and Cisco IOS Device
-
CloudBridge Connector Tunnel Diagnostics and Troubleshooting
This content has been machine translated dynamically.
Dieser Inhalt ist eine maschinelle Übersetzung, die dynamisch erstellt wurde. (Haftungsausschluss)
Cet article a été traduit automatiquement de manière dynamique. (Clause de non responsabilité)
Este artículo lo ha traducido una máquina de forma dinámica. (Aviso legal)
此内容已经过机器动态翻译。 放弃
このコンテンツは動的に機械翻訳されています。免責事項
이 콘텐츠는 동적으로 기계 번역되었습니다. 책임 부인
Este texto foi traduzido automaticamente. (Aviso legal)
Questo contenuto è stato tradotto dinamicamente con traduzione automatica.(Esclusione di responsabilità))
This article has been machine translated.
Dieser Artikel wurde maschinell übersetzt. (Haftungsausschluss)
Ce article a été traduit automatiquement. (Clause de non responsabilité)
Este artículo ha sido traducido automáticamente. (Aviso legal)
この記事は機械翻訳されています.免責事項
이 기사는 기계 번역되었습니다.책임 부인
Este artigo foi traduzido automaticamente.(Aviso legal)
这篇文章已经过机器翻译.放弃
Questo articolo è stato tradotto automaticamente.(Esclusione di responsabilità))
Translation failed!
Understand load monitors
Load monitors use SNMP polled OIDs to calculate load. The load monitor uses the IP address of the service to which it is bound (the destination IP address) for polling. It sends an SNMP query to the service, specifying the OID for a metric. The metrics can be CPU, memory, or number of server connections. The server responds to the query with a metric value. The metric value in the response is compared with the threshold value. The Citrix ADC appliance considers the service for load balancing only if the metric is less than the threshold value. The service with the lowest load value is considered first.
The following diagram illustrates a load monitor configured for the services described in the basic load balancing setup discussed in Setting Up Basic Load Balancing.
Figure 1. Operation of Load Monitors
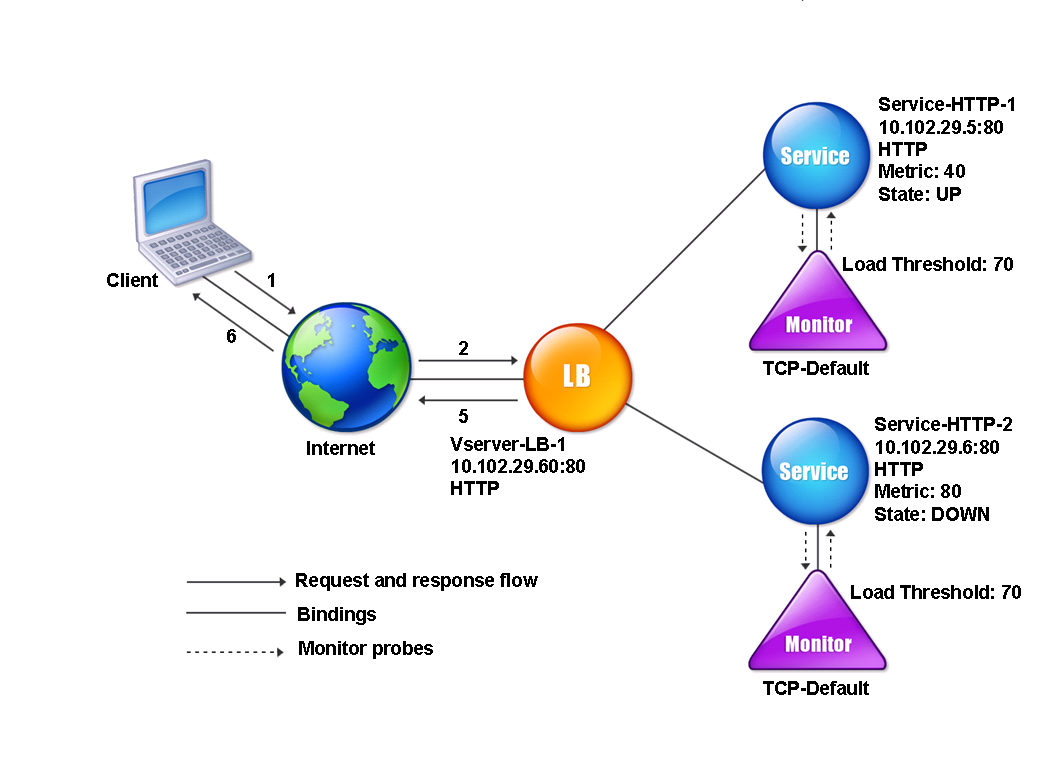
Note: The load monitor does not determine the state of the service. It only enables the appliance to consider the service for load balancing.
After you configure the load monitor, you must then configure the metrics that the monitor will use. For load assessment, the load monitor considers server parameters known as metrics, which are defined within the metric tables in the appliance configuration. Metric tables can be of two types:
- Local. By default, this table exists in the appliance. It consists of four metrics: connections, packets, response time, and bandwidth. The appliance specifies these metrics for a service, and SNMP queries are not originated for these services. These metrics cannot be changed.
- Custom. A user-defined table. Each metric is associated with an OID.
By default, the appliance generates the following tables:
- NetScaler
- RADWARE
- CISCO-CSS
- LOCAL
- FOUNDRY
- ALTEON
You can either add the appliance-generated metric tables, or you can add tables of your own choosing, as shown in the following table. The values in the metric table are provided only as examples. In an actual scenario, consider the real values for the metrics.
| Metric name | OIDs | Weight | Threshold |
|---|---|---|---|
| CPU | 1.2.3.4 | 2 | 70 |
| Memory | 4.5.6.7 | 3 | 80 |
| Connections | 5.6.7.8 | 4 | 90 |
To calculate the load for one or more metrics, you assign a weight to each metric. The default weight is 1. The weight represents the priority given to each metric. If the weight is high, the priority is high. The appliance chooses a service based on the SOURCEIPDESTIP hash algorithm.
You can also set the threshold value for each metric. The threshold value enables the appliance to select a service for load balancing if the metric value for the service is less than the threshold value. The threshold value also determines the load on each service.
Share
Share
In this article
This Preview product documentation is Cloud Software Group Confidential.
You agree to hold this documentation confidential pursuant to the terms of your Cloud Software Group Beta/Tech Preview Agreement.
The development, release and timing of any features or functionality described in the Preview documentation remains at our sole discretion and are subject to change without notice or consultation.
The documentation is for informational purposes only and is not a commitment, promise or legal obligation to deliver any material, code or functionality and should not be relied upon in making Cloud Software Group product purchase decisions.
If you do not agree, select I DO NOT AGREE to exit.