-
Getting Started with Citrix ADC
-
-
Enhancing Clickstream analytics in AWS using Citrix ADC
-
Citrix ADC in a Private Cloud Managed by Microsoft Windows Azure Pack and Cisco ACI
-
Deploy a Citrix ADC VPX instance
-
Optimize Citrix ADC VPX performance on VMware ESX, Linux KVM, and Citrix Hypervisors
-
Apply Citrix ADC VPX configurations at the first boot of the Citrix ADC appliance in cloud
-
Install a Citrix ADC VPX instance on Microsoft Hyper-V servers
-
Install a Citrix ADC VPX instance on Linux-KVM platform
-
Prerequisites for Installing Citrix ADC VPX Virtual Appliances on Linux-KVM Platform
-
Provisioning the Citrix ADC Virtual Appliance by using OpenStack
-
Provisioning the Citrix ADC Virtual Appliance by using the Virtual Machine Manager
-
Configuring Citrix ADC Virtual Appliances to Use SR-IOV Network Interface
-
Configuring Citrix ADC Virtual Appliances to use PCI Passthrough Network Interface
-
Provisioning the Citrix ADC Virtual Appliance by using the virsh Program
-
Provisioning the Citrix ADC Virtual Appliance with SR-IOV, on OpenStack
-
Configuring a Citrix ADC VPX Instance on KVM to Use OVS DPDK-Based Host Interfaces
-
-
Deploy a Citrix ADC VPX instance on AWS
-
Deploy a VPX high-availability pair with elastic IP addresses across different AWS zones
-
Deploy a VPX high-availability pair with private IP addresses across different AWS zones
-
Configure a Citrix ADC VPX instance to use SR-IOV network interface
-
Configure a Citrix ADC VPX instance to use Enhanced Networking with AWS ENA
-
Deploy a Citrix ADC VPX instance on Microsoft Azure
-
Network architecture for Citrix ADC VPX instances on Microsoft Azure
-
Configure multiple IP addresses for a Citrix ADC VPX standalone instance
-
Configure a high-availability setup with multiple IP addresses and NICs
-
Configure a high-availability setup with multiple IP addresses and NICs by using PowerShell commands
-
Configure a Citrix ADC VPX instance to use Azure accelerated networking
-
Configure HA-INC nodes by using the Citrix high availability template with Azure ILB
-
Configure a high-availability setup with Azure external and internal load balancers simultaneously
-
Configure address pools (IIP) for a Citrix Gateway appliance
-
Upgrade and downgrade a Citrix ADC appliance
-
Solutions for Telecom Service Providers
-
Load Balance Control-Plane Traffic that is based on Diameter, SIP, and SMPP Protocols
-
Provide Subscriber Load Distribution Using GSLB Across Core-Networks of a Telecom Service Provider
-
Authentication, authorization, and auditing application traffic
-
Basic components of authentication, authorization, and auditing configuration
-
On-premises Citrix Gateway as an identity provider to Citrix Cloud
-
Authentication, authorization, and auditing configuration for commonly used protocols
-
Troubleshoot authentication and authorization related issues
-
-
-
-
-
-
-
Persistence and persistent connections
-
Advanced load balancing settings
-
Gradually stepping up the load on a new service with virtual server–level slow start
-
Protect applications on protected servers against traffic surges
-
Retrieve location details from user IP address using geolocation database
-
Use source IP address of the client when connecting to the server
-
Use client source IP address for backend communication in a v4-v6 load balancing configuration
-
Set a limit on number of requests per connection to the server
-
Configure automatic state transition based on percentage health of bound services
-
-
Use case 2: Configure rule based persistence based on a name-value pair in a TCP byte stream
-
Use case 3: Configure load balancing in direct server return mode
-
Use case 6: Configure load balancing in DSR mode for IPv6 networks by using the TOS field
-
Use case 7: Configure load balancing in DSR mode by using IP Over IP
-
Use case 10: Load balancing of intrusion detection system servers
-
Use case 11: Isolating network traffic using listen policies
-
Use case 12: Configure Citrix Virtual Desktops for load balancing
-
Use case 13: Configure Citrix Virtual Apps for load balancing
-
Use case 14: ShareFile wizard for load balancing Citrix ShareFile
-
Use case 15: Configure layer 4 load balancing on the Citrix ADC appliance
-
-
-
-
Authentication and authorization for System Users
-
-
Configuring a CloudBridge Connector Tunnel between two Datacenters
-
Configuring CloudBridge Connector between Datacenter and AWS Cloud
-
Configuring a CloudBridge Connector Tunnel Between a Datacenter and Azure Cloud
-
Configuring CloudBridge Connector Tunnel between Datacenter and SoftLayer Enterprise Cloud
-
Configuring a CloudBridge Connector Tunnel Between a Citrix ADC Appliance and Cisco IOS Device
-
CloudBridge Connector Tunnel Diagnostics and Troubleshooting
This content has been machine translated dynamically.
Dieser Inhalt ist eine maschinelle Übersetzung, die dynamisch erstellt wurde. (Haftungsausschluss)
Cet article a été traduit automatiquement de manière dynamique. (Clause de non responsabilité)
Este artículo lo ha traducido una máquina de forma dinámica. (Aviso legal)
此内容已经过机器动态翻译。 放弃
このコンテンツは動的に機械翻訳されています。免責事項
이 콘텐츠는 동적으로 기계 번역되었습니다. 책임 부인
Este texto foi traduzido automaticamente. (Aviso legal)
Questo contenuto è stato tradotto dinamicamente con traduzione automatica.(Esclusione di responsabilità))
This article has been machine translated.
Dieser Artikel wurde maschinell übersetzt. (Haftungsausschluss)
Ce article a été traduit automatiquement. (Clause de non responsabilité)
Este artículo ha sido traducido automáticamente. (Aviso legal)
この記事は機械翻訳されています.免責事項
이 기사는 기계 번역되었습니다.책임 부인
Este artigo foi traduzido automaticamente.(Aviso legal)
这篇文章已经过机器翻译.放弃
Questo articolo è stato tradotto automaticamente.(Esclusione di responsabilità))
Translation failed!
Enhancing Clickstream analytics in AWS using Citrix ADC
Customers are increasingly accessing the company products through various applications such as Mobile apps, SaaS apps and so on. Therefore, applications can become a landmine of customer experience data. To track customer behavior online, customer-centric companies form data-driven profiles for each of their customers using this customer behavior data.
A clickstream is a sequence or stream of events that represent user actions (clicks) on a website or a mobile application. However, the scope of clickstream extends beyond clicks. It includes product searches, impressions, purchases, and any such events that might be of relevance to the business. Mere collecting and storing the customer experience data is not of much value. There is a need to distribute the highly complex data seamlessly to the right vendors at the right time. Businesses can derive value from the data and quickly take conscious decisions to improve upon their strategies. Therefore companies increasingly use clickstream analytics to glean insights into the customer experience journey of the apps.
This document provides you a good understanding on why Clickstream data is of utmost importance, how it is collected, stored, distributed, and transformed into meaningful and actionable analytics.
Citrix ADC integrates with Citrix ADM, and adds value to AWS services such as Amazon Kinesis Data Firehose to equip businesses with the best-in-class analytics solution that revolves around user’s Clickstreams.
This Citrix ADC solution helps you to solve complex business issues efficiently and with extreme simplicity. Citrix ADC and AWS Kinesis help to capture the issues with the poorly designed workflow. Citrix ADM helps to capture web app and network performance related issues by applying relevant filters. Conjunction of Citrix ADC with Citrix ADM and AWS Kinesis helps you to manage and analyze the huge influx of clickstream data in each phase. This solution is highly available, scalable, robust, and ensures the delivery is continuous and secure. Thus, you can derive actionable insights.
Why businesses opt for Clickstream analytics?
Businesses opt for clickstream primarily to understand how users interact with the application, and to get insights on improving the goals of the application. Clickstream Analytics is an information retrieval use case that tracks your user’s behavior, navigation habits, and so on. Clickstream analytics gives you information on:
- Which link your customers are clicking more often and at what point in time.
- Where was the visitor before reaching my website?
- How much time did the visitor spend on each page?
- When and where did the visitor click the “back” button on the web browser?
- What items did the visitor add to (or remove from) their shopping cart?
- From which page did the visitor exit my website?
Analytics service to manage Clickstream data using Amazon Kinesis
You can use Amazon Kinesis to perform clickstream analytics. Amazon kinesis enables clickstream analytics with the following services:
With Amazon Kinesis, you can collect and analyze your huge data sets at any scale. AWS Kinesis can handle data from various sources, such as:
- Mobile and web applications (for example, Gaming, ecommerce)
- IoT devices
- Social networking applications
- Financial trading services
- Geospatial services
How Citrix ADC enables Clickstream analytics
The Citrix ADC solution collates and delivers information securely on the activities of users, such as, websites visited, the bandwidth spent, navigation flow. Companies analyze this high throughput and continuous clickstream data to corroborate the effectiveness of the following:
- Site layout
- Marketing campaigns
- New application features
With the Citrix ADC’s ability to provide a resilient network protection for enterprise environments, the server cost is reduced manifolds by offloading computationally intensive tasks, and running sessions on this data. Thereby helping companies to identify events in real-time with high availability, security, and low latency always.
For configuration information, see Configure the Citrix ADC solution for clickstream analytics.
How Citrix ADC and Citrix ADM complement the AWS environment
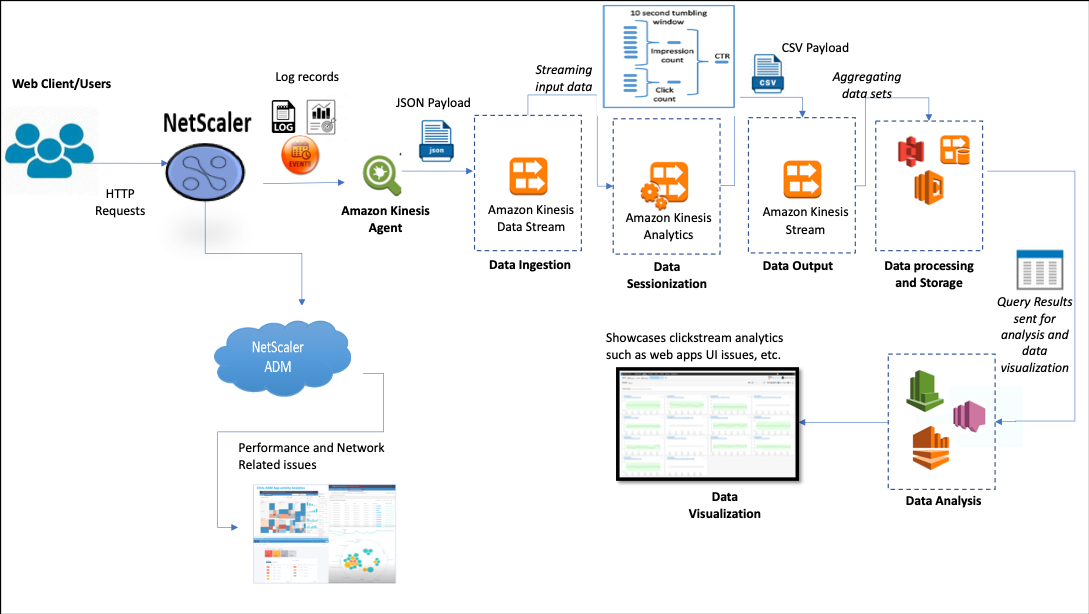
The following diagram illustrates the end-to-end user workflow to perform Clickstream analytics in AWS infrastructure. This diagram helps you understand the following processes:
- How user interacts with Citrix ADC
- How Citrix ADC captures user’s actions and generates clickstream data
- How the clickstream data is delivered to AWS services (Amazon Kinesis)
- How Amazon Kinesis processes the data logs and stores them to produce meaningful clickstream analytics
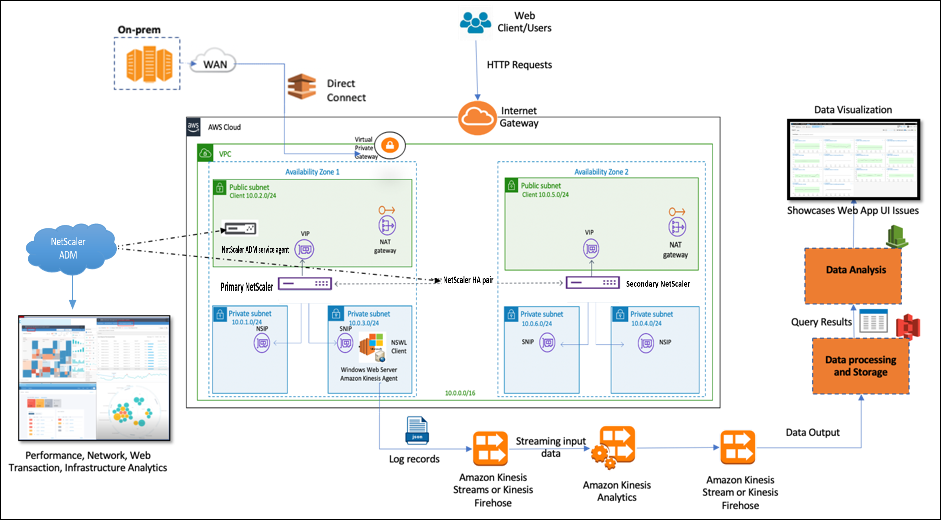
The Citrix ADC seamlessly integrates into the AWS environment and Citrix ADM that helps businesses to be compatible with variable volume and diverse nature of the clickstream data. It provides services to load and analyze streaming knowledge with simplicity. You can also create custom streaming knowledge applications for specialized desires.
Amazon Kinesis
The AWS environment has different services that perform analytics on the user events, logs, and metrics captured by Citrix ADC. The data can be website clickstreams, financial transactions, social media feeds, IT logs, and location-tracking events.
- Amazon Kinesis Data Streams perform analytics in scenarios that involve scalable and durable real-time data streaming that can continuously capture GB of data per second from several sources.
- Amazon Kinesis Data Analytics can be used for scenarios with lower latency between the session generation because it takes less time to aggregate various data sets.
- Amazon Kinesis Agent for Microsoft Windows collects, parses, filters, and streams input data to Kinesis data streams.
- Once the data is up in the cloud, you can implement the exact data pipeline to get the results you want. For example, you can use this information in Amazon Quick Sight, which is a visualization tool that is used to build dashboards.
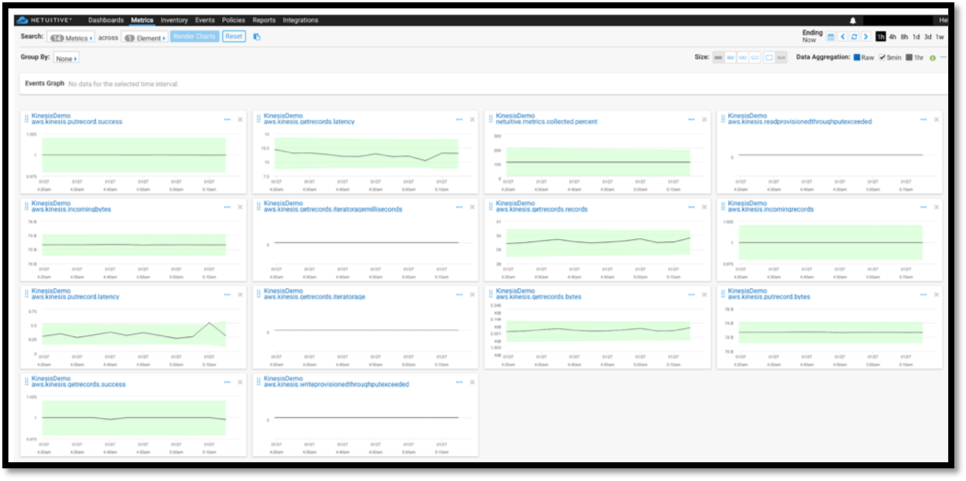
The AWS Kinesis dashboard provides the following offerings:
- Showcases web apps UI issues
- Near real-time visualizations of web usage metrics such as events per hour, visitor count, and referrers.
- Session-wise analysis
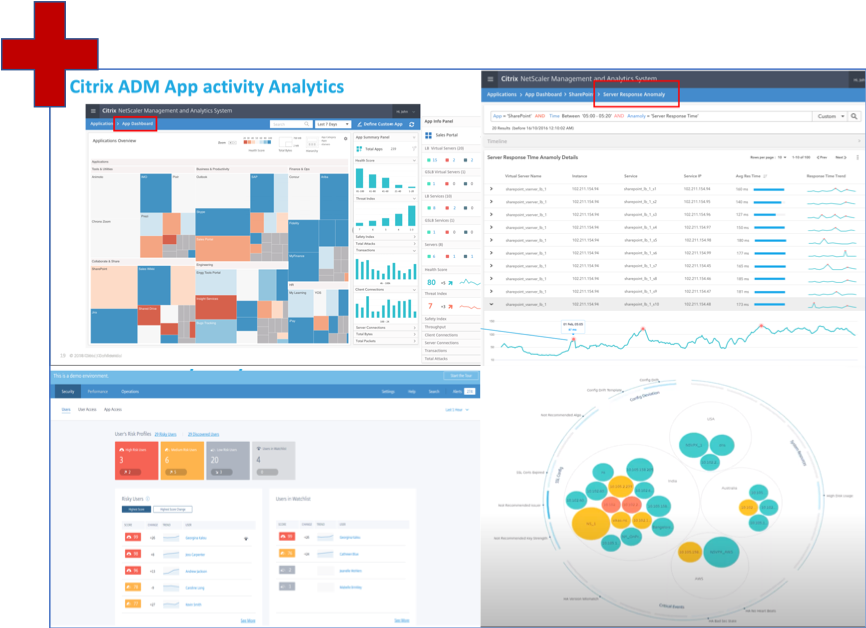
Citrix ADM Analytics
By utilizing Citrix ADM with Citrix ADC, you can get a single-pane-of-glass view across all the business environments. Citrix ADC captured logs are fed into Citrix ADM, that treats your individual applications as a single entity. You can gain valuable insights and effectively troubleshoot issues with the following ADM capabilities:
- Intelligent analytics
- Web transaction analytics
- Anomaly detection
- Performance and network-related issues
The following ADM service dashboard helps you gain valuable insights to effectively troubleshoot the issues.
How Citrix ADM correlates with Clickstream analytics
Clickstream analytics data can be correlated with ADM analytics to describe, predict, and improve application’s performance.
For more information on Citrix ADM, see Citrix ADM
For example, an organization while analyzing their logs notice that most of the users are abandoning their sites. But to find the root cause behind this user behavior, they need to find out which part of their application is performing bad. With clickstream analytics data and ADM analytics, you can derive the following insights to analyze the reason behind users abandoning a site:
- Is the user abandoning due to latency, 5xx errors?
- Are there any SSL Handshake errors?
- Is there some part of the application that has performance or network related issues?
- Is there a 404 error, or the page loading time takes forever to respond, and so on.
- Are customers facing server response anomalies?
Citrix ADM service provides Web Insights that allow IT administrators to speed up solving issues with the following features:
- Provides integrated and real-time monitoring of all web applications that served by the Citrix ADC.
- Get a holistic view on the application performance w.r.t. time, latency, and the usual user’s behavior through observability tools (such as global service graph).
- Perform intelligent analytics to understand server response anomalies.
- SSL insights contribute towards resolving 5xx and 4xx errors.
- To maintain records of all web sessions that include:
- Detailed logs of every web transaction
- Search capability to find relevant logs
- Ability to isolate an ADC-to-end user vs. ADC-to-server problem
Types of data exported by ADC for Clickstream analytics
Citrix ADC captures the different sources that generate varied forms of data, which are as follows:
-
Web server logs
Web server logging feature sends logs of HTTP and HTTPS requests to a client system for storage and retrieval. These logs contain huge amount of data, which is difficult to comprehend and make sense out of it. Analytical tools help in understanding and bring value from it. For configuration details, see the Web logging configuration section in this document.
-
Syslogs
The primary use of syslogs is for systems management. Proactive syslog monitoring pays off because it significantly reduces downtime of servers and other devices in your infrastructure. Syslog identifies critical network issues and reports them proactively.
-
Access logs
The access logs store information about events that occurred on your web server. For instance, when someone visits your website, a log is recorded and stored to provide the web server administrator with information such as the IP address of the visitor, what pages they were viewing, status codes, browser used. To access logs might be overwhelming, if there is lack of appropriate knowledge to understand them. You can program your system to integrate with:
- Citrix ADC for seamless delivery
- Kinesis for actionable insights that is useful for businesses
-
Audit logs
The Audit Logging feature enables you to log the Citrix ADC states and status information collected by various modules in the kernel and in the user-level daemons.
-
Error logs
The error logs file is an aid for administrators to provide more information regarding a specific error that has occurred on the web server.
Configure the Citrix ADC solution for clickstream analytics
The Web server logging feature enables you to send logs of HTTP and HTTPS requests to a client system for storage and retrieval.
To configure the Citrix ADC for web server logging you must:
- Enable web logging feature
- Configure the size of the buffer to temporarily store the log entries because the Web log server runs on the Citrix ADC.
To configure web server logging by using CLI:
-
Enable the web server logging feature.
enable ns feature WL <!--NeedCopy--> -
[Optional] Modify/Configure the buffer size for storing the logged information.
set ns weblogparam -bufferSizeMB 60 <!--NeedCopy--> -
Install the Citrix ADC web logging (NSWL) client. For more information, see Installing the Citrix ADC web logging (NSWL) client
-
Install the NSWL client on Windows by performing the following operations on the system where you downloaded the package.
-
Extract and copy the nswl_win-< release number >-< build number >.zip file from the package to a Windows system on which you want to install the NSWL client.
-
On the Windows system, unzip the file in a directory (referred as < NSWL-HOME>). Bin, samples, and other directories are extracted.
-
At the command prompt, run the following command from the < NSWL-HOME >\bin directory:
nswl -install -f < path of the log.conf file >\log.conf
<!--NeedCopy-->
Note:
To uninstall the NSWL client, at the command prompt, run the following command from the < NSWL-HOME >\bin directory:
nswl -remove <!--NeedCopy--> -
-
After you install the NSWL client, configure the NSWL client using the NSWL executable. These configurations are stored in the NSWL client configuration file (log.conf).
Run the following commands from the directory in which the NSWL executable is located:
\ns\bin <!--NeedCopy--> -
In the NSWL client configuration file (log.conf), add the Citrix ADC IP address (NSIP) from which the NSWL client collects logs by running the following in the client system command prompt:
nswl -addns -f < Path to the configuration(log.conf) file >\log.conf <!--NeedCopy--> -
Input the Citrix ADC appliance’s NSIP (IP address), user name as
nsrootand password as “the instance id/your set password” so that:- NSWL client connects to the ADC after you add the NetScaler IP address (NSIP) to the NSWL configuration file
- ADC buffers the HTTP and HTTPS request log entries before sending them to the client.
- The client can filter the entries(by modifying log.conf file) before storing them.
Note
Change the default password for Citrix ADC and then proceed with the configuration. Type the following command to change the password:
set system user nsroot -password <your password>
<!--NeedCopy-->
Configuring the Amazon Kinesis agent
Perform the following steps in the AWS web console to configure the Amazon Kinesis agent:
-
Create a configuration file (appsettings.json) and deploy it. Configuration files define sets of sources, sinks, and pipes that connect sources to sinks, along with optional transformations.
The following example is a complete
appsettings.jsonconfiguration file that configures Kinesis Agent to stream Windows application log events to Kinesis Data Firehose.{ "Sources": [ { "Id": "NSWLog", "SourceType": "DirectorySource", "Directory": "C:\\Users\\Administrator\\Downloads\\nswl_win-13.0-52.24\\bin", "FileNameFilter": "*.log" "RecordParser": "TimeStamp", "TimestampFormat": "yyyy-MM-dddd HH:mm:ss.ffff", //Optional parameter required only by the timestamp record parser "TimeZoneKind": "UTC", //Local or UTC "SkipLines": 0 //Skip a number of lines at the beginning of each file } ], "Sinks": [ { "Id": "ApplicationLogKinesisFirehoseSink", "SinkType": "KinesisFirehose", "StreamName": "Delivery-ik-logs", "AccessKey": "Your Access Key", "SecretKey": "YourSecretKey", "Region": "ap-south-1" } ], "Pipes": [ { "Id": "ApplicationLogSourceToApplicationLogKinesisFirehoseSink", "SourceRef": "ApplicationLogSource", "SinkRef": "ApplicationLogKinesisFirehoseSink" } ], "Telemetrics": { "off": "true" } } <!--NeedCopy--> - Set up a Kinesis Agent on data sources to collect data and send it continuously to Amazon Kinesis Firehose/Kinesis Data Analytics. For more information, see Getting Started with Amazon Kinesis Agent for Microsoft Windows.
- Create an end-to-end data delivery stream using Amazon Kinesis Firehose. The delivery stream transmits your data from the agent to the destination. The destination includes Amazon Kinesis Analytics, Amazon Redshift, Amazon Elasticsearch service, and Amazon S3. For the Source, choose Direct PUT or other sources to create a Kinesis Data Firehose delivery stream.
- Process the incoming log data using SQL queries in Amazon Kinesis Analytics.
- Load processed data from Kinesis Analytics to Amazon Elasticsearch Service to index the data.
- Analyze and visualize the processed data using Visualization tools, such as Kibana and AWS QuickInsight Services.
References
Share
Share
In this article
- Why businesses opt for Clickstream analytics?
- Analytics service to manage Clickstream data using Amazon Kinesis
- How Citrix ADC enables Clickstream analytics
- How Citrix ADC and Citrix ADM complement the AWS environment
- How Citrix ADM correlates with Clickstream analytics
- Types of data exported by ADC for Clickstream analytics
- Configure the Citrix ADC solution for clickstream analytics
- Configuring the Amazon Kinesis agent
- References
This Preview product documentation is Cloud Software Group Confidential.
You agree to hold this documentation confidential pursuant to the terms of your Cloud Software Group Beta/Tech Preview Agreement.
The development, release and timing of any features or functionality described in the Preview documentation remains at our sole discretion and are subject to change without notice or consultation.
The documentation is for informational purposes only and is not a commitment, promise or legal obligation to deliver any material, code or functionality and should not be relied upon in making Cloud Software Group product purchase decisions.
If you do not agree, select I DO NOT AGREE to exit.