Infrastructure rightsizing
The Infrastructure Rightsizing page helps you to analyze the provisioning and sizing aspects of your delivery group based on resources utilization. Based on this analysis, you can:
- Reduce spending on the unused resources
- Identify if machines for the given delivery group consumption is over, under, or right sized
- Identify if the utilization is mainly driven by Power users (indicated by higher utilization by top 5 percentile machines compared to the rest of the group)
You can filter the Infrastructure rightsizing using the following:
- Delivery Group - You can filter for single session OS or multi session OS delivery groups
- Tags - Tags are the tag names applied to the machine. So, you can filter machines with the same tags. You can select multiple tags up to five tags. When you select multiple tags, you can filter for all the machines which have at least one of those selected machine tags applied.
- Time period - You can filter the data for last 24 hours, 7 days, and 30 days.
The Infrastructure rightsizing page offers:
- Insight in to the utilization details
- Summary of the resource utilization
- Trends on the resource utilization
The aggregated data displayed on this page is updated as follows:
- One hour for Last 24 hours, and Last 7 days filter
- One day for Last 30 days filter
Click the Cost Optimization tab from the left menu on the Home page. And then, click the Infrastructure rightsizing tab to access the Infrastructure rightsizing page.
You can also click the Rightsize this delivery group link from the Infrastructure details section in the Cost Optimization tab > Cost savings to access the Infrastructure rightsizing page.
The Infrastructure rightsizing page includes:
- Utilization details
- Resource utilization summary
- Resource utilization trends
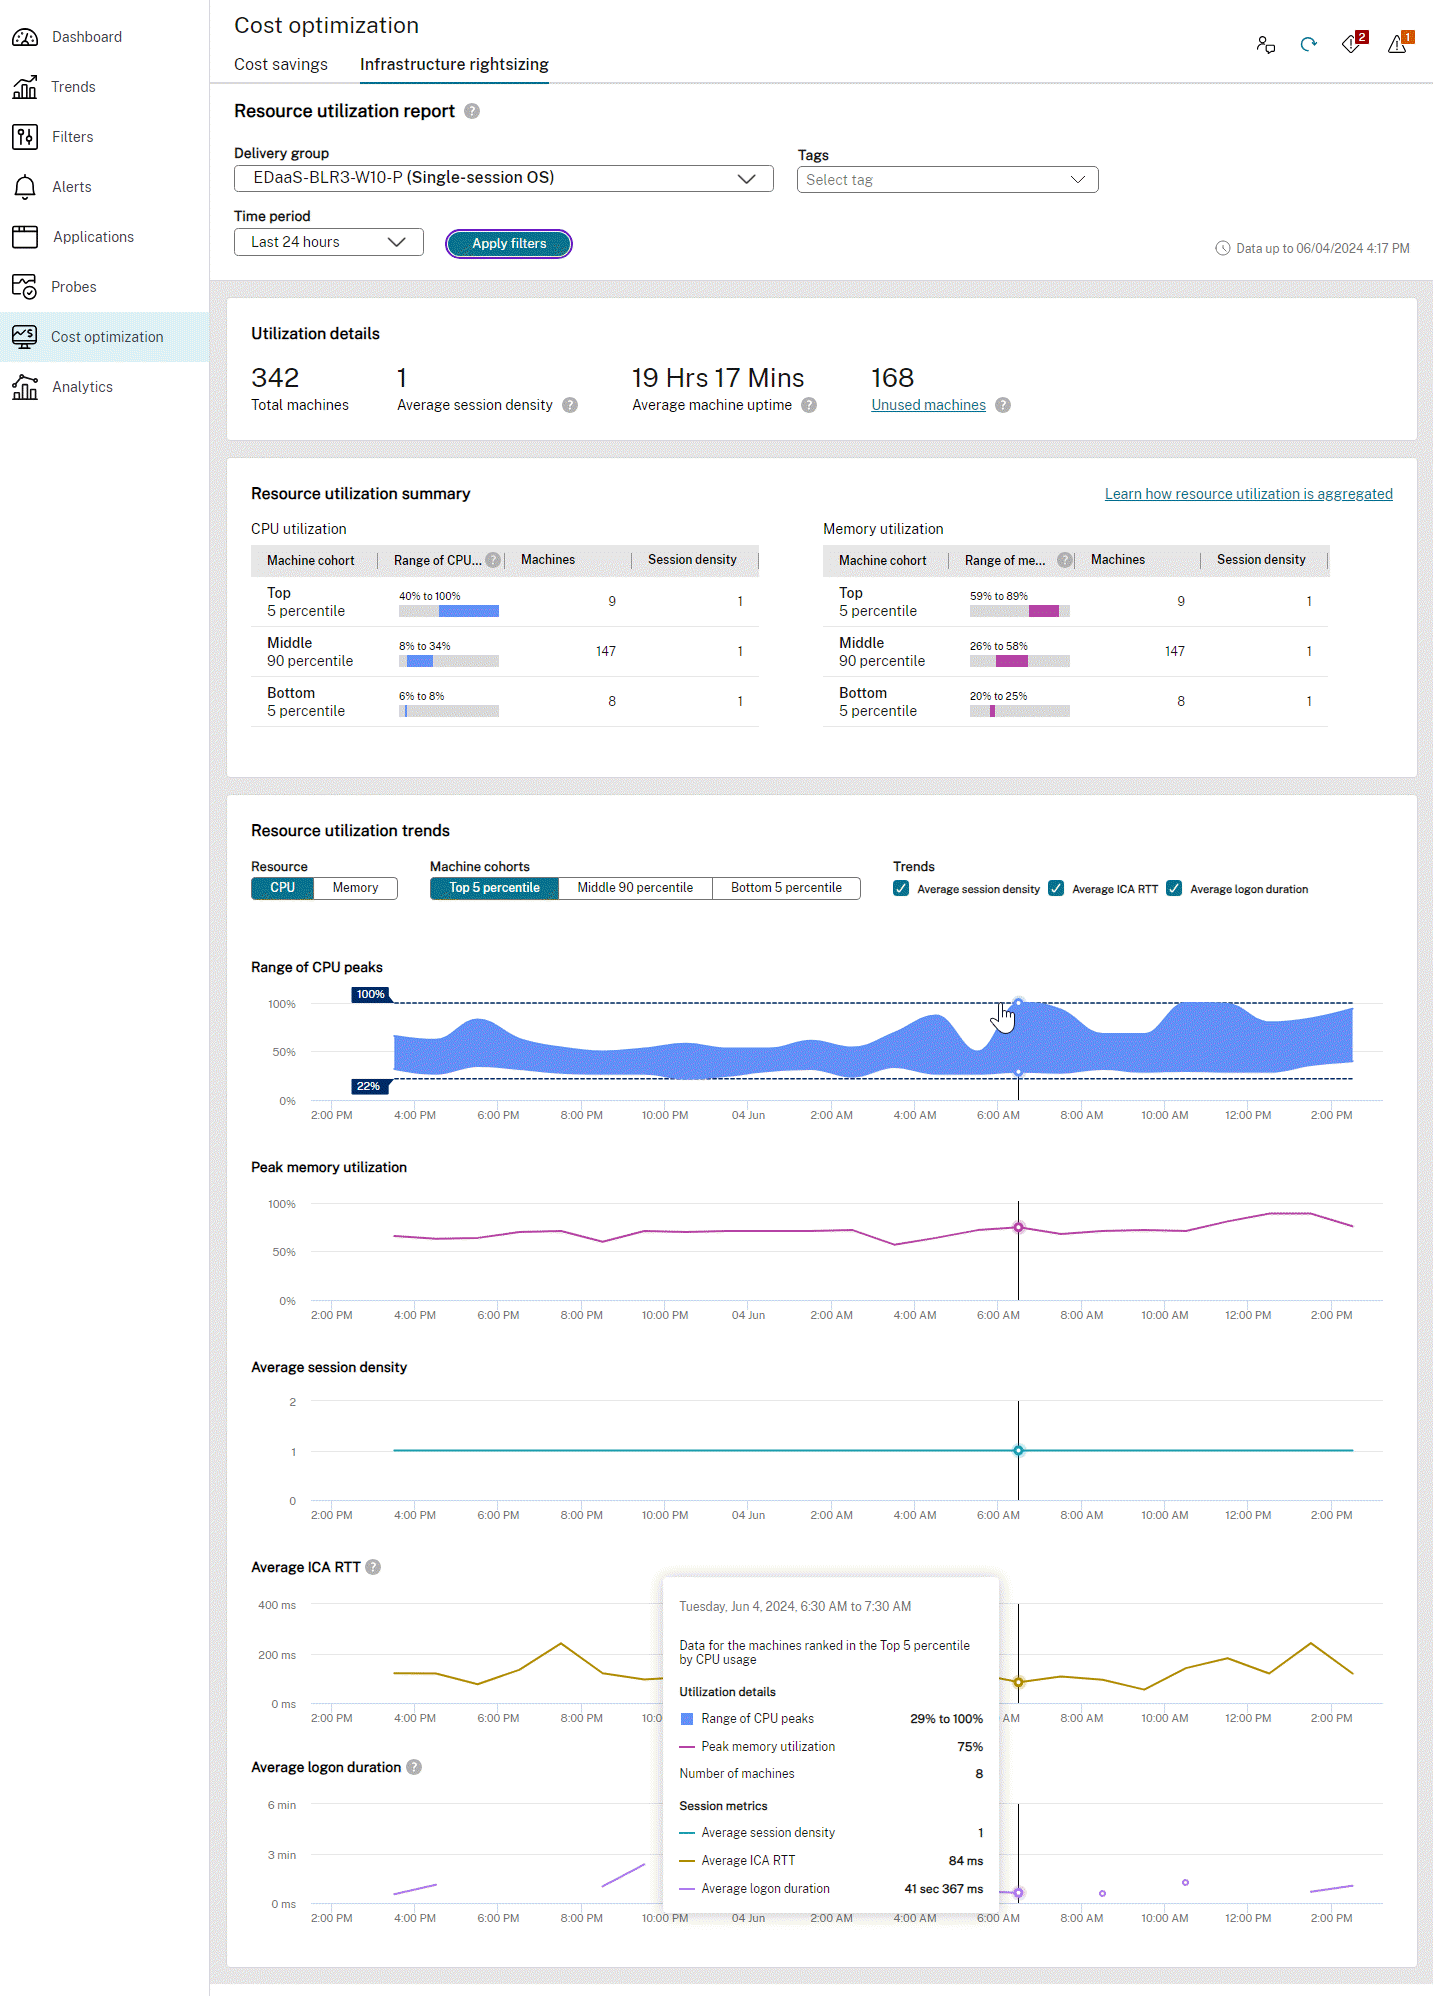
Utilization details: This section provides details on the utilization of the selected delivery group and for the selected tags. You can view the details for the last 24 hours, 7 days, and 30 days. The Utilization details section provides details for the entire duration of the selected time filter. For example, if 7 days is selected, the total machine count is the total number of machines that were on at any point during the 7 days. The Utilization details section provides the following:
- Total machine - Displays the total number of machines. This includes all the machines which were powered on during the selected period. For example, If 7 days is selected, the total machine count is the total number of machines that were on at any point during the 7 days.
- Average session density - This is an average across the number of machines and across the selected time period. Refers to the amount of session load on a machine which affects the resource available for sessions.
- Average machine uptime - It is the ratio of total uptime of the power managed machines and for the selected time period. How much time the machine was up, per day per machine. Suppose there are two machines in one delivery group or in the selected tag, and one machine was used for 24 hours and the other machine was used for 1 hour, the average machine uptime is 12 hours 30 minutes. In this example, the selected filter value is Last 24 hours.
- Unused machines - Displays the number of machines which had no sessions over the selected time period but which was still powered on. Click Unused Machines link to open the Filters tab where you can view all the machines in that same delivery group which are currently powered on and have no sessions.
Resource utilization summary: This section provides a summary on how the resources were utilized for the selected delivery group and for the selected tags. You can select multiple tags up to five tags. You can view the details for the last 24 hours, 7 days, and 30 days. The machines are ranked based on the utilization. The Resource utilization summary section provides details on CPU utilization and memory utilization for the machines with active sessions.
-
CPU utilization:
- Machine cohort - Provides information about the machine groups categorized into top, middle, and bottom based on its CPU utilization. 5% of the most used machines are categorized under Top 5 percentile, 5% of the least used machines are categorized under Bottom 5 percentile, and the remaining 90% are categorized under Middle 90 percentile.
- Range of CPU Peaks - Displays the CPU peaks range based on its utilization corresponding to the machine cohort.
- Machines - Displays the number of machines corresponding to the machine cohort.
- Session density - Displays the session density corresponding to the machine cohort.
-
Memory utilization:
- Machine cohort - Provides information about the machine groups categorized into top, middle, and bottom based on its memory utilization. 5% of the most used machines are categorized under Top 5 percentile, 5% of the least used machines are categorized under Bottom 5 percentile, and the remaining 90% are categorized under Middle 90 percentile.
- Range of memory Peaks - Displays the memory peaks range based on its utilization corresponding to the machine cohort.
- Machines - Displays the number of machines corresponding to the machine cohort.
- Session density - Displays the session density corresponding to the machine cohort.
The following table provides information on the possible action items that you can do based on the values present in the Resource Utilization summary section:
| Scenario | Action item |
|---|---|
| CPU utilization is more | Increase the CPU specifications of the delivery group. Or, identify the higher usage users and move them to a different delivery group with better specifications. |
| CPU utilization is less | Decrease the CPU specification of the delivery group. |
| Memory utilization is more | Increase the memory specifications of the delivery group. |
| Memory utilization is less | Decrease the memory specification of the delivery group. |
How is the data populated in the Resource utilization summary section?
The data in the Resource utilization summary section is populated based on the data in the Resource utilization trends. The summary gives you details only for the machines with active sessions. The summary gives you better results when there are more than five machines.
Based on the number of machines in the selected delivery group, the maximum and minimum utilization value is calculated.
For example, consider that you have selected Last 7 days as a time period and you have 20 machines in the selected delivery group. These 20 machines are further categorized into Top 5 percentile, Middle 90 percentile, and Bottom 5 percentile. The CPU and memory utilization is calculated when there are active sessions. For example, in this case, first and last machines into the top 5 and bottom 5. Remaining 18 machines are categorized into the middle 90 percentile. In this case since there is only one machine in the Top 5 percentile, the maximum and minimum value is the same. When there is more than one machine in the cohort, the highest and lowest value of the cohort is based on the maximum value of the highest-ranked machine in that group, and the maximum value of the lowest-ranked machine in that group respectively.
When you select CPU as the Resource type, the Range of CPU peaks and the Peak memory utilization for the selected machines are displayed.
When you select Memory as the Resource type, the Range of memory peaks and the Peak CPU utilization for the selected machines are displayed.
Resource utilization trends: This section provides a graphical representation for the Range of CPU peaks, peak memory utilization, average Session density, average ICA RTT, and average logon duration.
You can filter the details for the following:
- Resource - CPU and Memory
- Machine cohorts - Top 5 percentile, Middle 90 percentile, and Bottom 5 percentile
- Trends - Average session, Average ICA RTT, Average logon duration.
You can view the following charts:
- Range of CPU peaks - Displays the range of CPU peaks in a band. When you hover on any point in the band, the top and bottom value of the band is displayed.
- Peak memory utilization - Displays the highest memory utilization for the selected machines and for the selected time over a graph.
- Average Session density - Displays the average session density for the selected machines and for the selected time over a graph.
- Average ICA RTT - Displays the average round trip time for the session. This chart shows breaks when there are no active sessions or when sessions are disconnected.
- Average logon duration - Displays the average logon duration for the selected machines and for the selected time period over a graph. This chart shows data when a new logon is started during the selected time.