Workload Balancing basic tasks
When you first begin using Workload Balancing, there are some basic tasks you use Workload Balancing for regularly:
- Determining the best server on which to run a VM
- Accepting Workload Balancing optimization recommendations
- Running reports about the workloads in your environment
In addition to enabling you to perform these basic tasks, Workload Balancing is a powerful Citrix Hypervisor component that optimizes the workloads in your environment. The features that enable you to optimize your workloads include:
- Host power management
- Scheduling optimization-mode changes
- Running reports
- Fine-tuning the criteria Workload Balancing uses to make optimization recommendations.
For more information about these more complex features, see Administer Workload Balancing.
Notes:
- Workload Balancing is available for Citrix Hypervisor Premium Edition customers or those customers who have access to Citrix Hypervisor through their Citrix Virtual Apps and Desktops entitlement or Citrix DaaS entitlement. For more information about Citrix Hypervisor licensing, see Licensing. To upgrade, or to buy a Citrix Hypervisor license, visit the Citrix website.
- Workload Balancing 8.2.2 and later are compatible with Citrix Hypervisor 8.2 Cumulative Update 1.
Determine the best server on which to run a VM
When you have enabled Workload Balancing and you restart an offline VM, XenCenter recommends the optimal pool members to start the VM on. The recommendations are also known as star ratings since stars are used to indicate the best host.
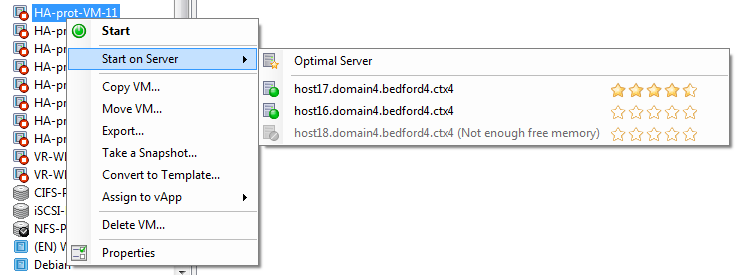
When Workload Balancing is enabled, XenCenter provides star ratings to indicate the optimal hosts for starting a VM. These ratings are also provided:
- When you want to start the VM when it is powered off
- When you want to start the VM when it is suspended
- When you want to migrate the VM to a different host (Migrate and Maintenance Mode)
When you use these features with Workload Balancing enabled, host recommendations appear as star ratings beside the name of the physical host. Five empty stars indicate the lowest-rated, and thus least optimal, server. If you can’t start or migrate a VM to a host, the host name is grayed out in the menu command for a placement feature. The reason it cannot accept the VM appears beside it.
The term optimal indicates the physical server best suited to hosting your workload. There are several factors Workload Balancing uses when determining which host is optimal for a workload:
-
The amount of resources available on each host in the pool. When a pool runs in Maximum Performance mode, Workload Balancing tries to balance the VMs across the hosts so that all VMs have good performance. When a pool runs in Maximum Density mode, Workload Balancing places VMs onto hosts as densely as possible while ensuring the VMs have sufficient resources.
-
The optimization mode in which the pool is running (Maximum Performance or Maximum Density). When a pool runs in Maximum Performance mode, Workload Balancing places VMs on hosts with the most resources available of the type the VM requires. When a pool runs in Maximum Density mode, Workload Balancing places VMs on hosts that already have VMs running. This approach ensures that VMs run on as few hosts as possible.
-
The amount and type of resources the VM requires. After Workload Balancing monitors a VM for a while, it uses the VM metrics to make placement recommendations according to the type of resources the VM requires. For example, Workload Balancing might select a host with less available CPU but more available memory if it is what the VM requires.
In general, Workload Balancing functions more effectively and makes better, less frequent optimization recommendations if you start VMs on the hosts it recommends. To follow the host recommendations, use one of the placement features to select the host with the most stars beside it. Placement recommendations can also be useful in Citrix Virtual Desktops environments.
To start a VM on the optimal server
-
In the Resources pane of XenCenter, select the VM you want to start.
-
From the VM menu, select Start on Server and then select one of the following:
-
Optimal Server. The optimal server is the physical host that is best suited to the resource demands of the VM you are starting. Workload Balancing determines the optimal server based on its historical records of performance metrics and your placement strategy. The optimal server is the server with the most stars.
-
One of the servers with star ratings listed under the Optimal Server command. Five stars indicate the most-recommended (optimal) server and five empty stars indicates the least-recommended server.
-
Tip:
You can also select Start on Server by right-clicking the VM you want to start in the Resources pane.
To resume a VM on the optimal server
-
In the Resources pane of XenCenter, select the suspended VM you want to resume.
-
From the VM menu, select Resume on Server and then select one of the following:
-
Optimal Server. The optimal server is the physical host that is best suited to the resource demands of the VM you are starting. Workload Balancing determines the optimal server based on its historical records of performance metrics and your placement strategy. The optimal server is the server with the most stars.
-
One of the servers with star ratings listed under the Optimal Server command. Five stars indicate the most-recommended (optimal) server and five empty stars indicates the least-recommended server.
-
Tip:
You can also select Resume on Server by right-clicking the suspended VM in the Resources pane.
Accept Workload Balancing optimization recommendations
After Workload Balancing is running for a while, it begins to make recommendations about ways in which you can improve your environment. For example, if your goal is to improve VM density on hosts, at some point, Workload Balancing might recommend that you consolidate VMs on a host. If you aren’t running in automated mode, you can choose either to accept this recommendation and apply it or to ignore it.
Important:
After Workload Balancing runs for a time, if you don’t receive optimal placement recommendations, evaluate your performance thresholds. This evaluation is described in Understand when Workload Balancing makes recommendations. It is critical to set Workload Balancing to the correct thresholds for your environment or its recommendations might not be appropriate.
Optimization recommendations are based on the following criteria:
-
Placement strategy you select (that is, the optimization mode).
Find out the optimization mode for a pool by using XenCenter to select the pool. Look in the Configuration section of the WLB tab for the information.
-
Performance metrics for resources such as a physical host’s CPU, memory, network, and disk utilization.
-
The role of the host in the resource pool.
When making placement recommendations, Workload Balancing considers the pool master for VM placement only if no other host can accept the workload. Likewise, when a pool operates in Maximum Density mode, Workload Balancing considers the pool master last when determining the order to fill hosts with VMs.
Optimization recommendations appear in the WLB optimization tab in XenCenter.
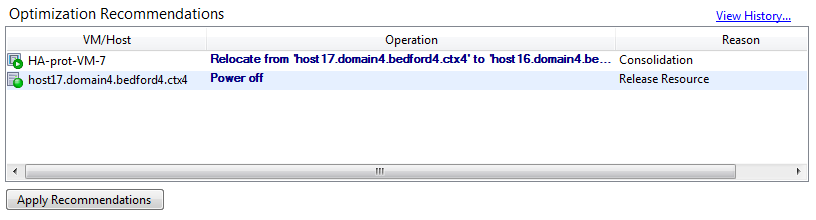
Optimization recommendations display the following information:
- The name of the VM that Workload Balancing recommends relocating
- The host that the VM currently resides on
- The host Workload Balancing recommends as the new location.
The optimization recommendations also display the reason Workload Balancing recommends moving the VM. For example, the recommendation displays “CPU” to improve CPU utilization. When Workload Balancing power management is enabled, Workload Balancing also displays optimization recommendations for hosts it recommends powering on or off. Specifically, these recommendations are for consolidations.
You can click Apply Recommendations, to perform all operations listed in the Optimization Recommendations list.
To accept an optimization recommendation
-
In the Resources pane of XenCenter, select the resource pool for which you want to display recommendations.
-
Click the WLB tab. If there are any recommended optimizations for any VMs on the selected resource pool, they display in the Optimization Recommendations section of the WLB tab.
-
To accept the recommendations, click Apply Recommendations. Citrix Hypervisor begins performing all the operations listed in the Operations column of the Optimization Recommendations section.
After you click Apply Recommendations, XenCenter automatically displays the Logs tab so you can see the progress of the VM migration.
Understand Workload Balancing recommendations under high availability
If you have Workload Balancing and Citrix Hypervisor High Availability enabled in the same pool, it is helpful to understand how the two features interact. Workload Balancing is designed not to interfere with High Availability. When there is a conflict between a Workload Balancing recommendation and a High Availability setting, the High Availability setting always takes precedence. In practice, this precedence means that:
-
If attempting to start a VM on a host violates the High Availability plan, Workload Balancing doesn’t give you star ratings.
-
Workload Balancing does not automatically power off any hosts beyond the number specified in the Failures allowed box in the Configure HA dialog.
-
However, Workload Balancing might still make recommendations to power off more hosts than the number of host failures to tolerate. (For example, Workload Balancing still recommends that you power off two hosts when High Availability is only configured to tolerate one host failure.) However, when you attempt to apply the recommendation, XenCenter might display an error message stating that High Availability is no longer guaranteed.
-
When Workload Balancing runs in automated mode and has power management enabled, recommendations that exceed the number of tolerated host failures are ignored. In this situation, the Workload Balancing log shows a message that power-management recommendation wasn’t applied because High Availability is enabled.
-
Generate workload reports
Workload Balancing captures performance data and can use this data to generate reports, known as Workload Reports, about your virtualized environment, including reports about hosts and VMs. The Workload Balancing reports can help you perform capacity planning, determine virtual server health, and evaluate how effective your configured threshold levels are.
You can use the Pool Health report to evaluate how effective your optimization thresholds are. While Workload Balancing provides default threshold settings, you might need to adjust these defaults for them to provide value in your environment. If you do not have the optimization thresholds adjusted to the correct level for your environment, Workload Balancing recommendations might not be appropriate for your environment.
To run reports, you do not need to configure for Workload Balancing to make placement recommendations or move VMs. However, you must configure the Workload Balancing component. Ideally, you must set critical thresholds to values that reflect the point at which the performance of the hosts in your pool degrades. Ideally, the pool has been running Workload Balancing for a couple of hours or long enough to generate the data to display in the reports.
Workload Balancing lets you generate reports on three types of objects: physical hosts, resource pools, and VMs. At a high level, Workload Balancing provides two types of reports:
-
Historical reports that display information by date
-
“Roll up” style reports, which provide a summarizing overview of an area
-
Reports for auditing purposes, so you can determine, for example, the number of times a VM moved
-
Chargeback report that shows VM usage and can help you measure and assign costs
Generate a Workload Balancing report
-
In XenCenter, from the Pool menu, select View Workload Reports.
You can also display the Workload Reports screen from the WLB tab by clicking the Reports button.
-
From the Workload Reports screen, select a report from the Reports pane.
-
Select the Start Date and the End Date for the reporting period. Depending on the report you select, you might be required to specify a server in the Host list.
-
Click Run Report. The report displays in the report window. For information about the meaning of the reports, see Workload Balancing report glossary.
Navigate in a Workload Balancing report
After generating a report, you can use the toolbar buttons in the report to navigate and perform certain tasks. To display the name of a toolbar button, pause your mouse over toolbar icon.
| Toolbar buttons | Description |
|---|---|
| Document Map enables you to display a document map that helps you navigate through long reports. | |
| Page Forward/Back enables you to move one page ahead or back in the report. | |
 |
Back to Parent Report enables you to return to the parent report when working with drill-through reports. Note: This button is only available in drill-through reports, such as the Pool Health report. |
| Stop Rendering cancels the report generation. | |
| Print enables you to print a report and specify general printing options. These options include: the printer, the number of pages, and the number of copies. | |
| Print Layout enables you to display a preview of the report before you print it. To exit Print Layout, click the Print Layout button again. | |
| Page Setup enables you to specify printing options such as the paper size, page orientation, and margins. | |
| Export enables you to export the report as an Acrobat (.PDF) file or as an Excel file with a .XLS extension. | |
| Find enables you to search for a word in a report, such as the name of a VM. |
Export a Workload Balancing report
You can export a report in either Microsoft Excel or Adobe Acrobat (PDF) formats.
-
After generating the report, click the following Export button:
-
Select one of the following items from the Export button menu:
-
Excel
-
Acrobat (PDF) file
-
Note:
Depending on the export format you select, the report contains different amounts of data. Reports exported to Excel include all the data available for reports, including “drilldown” data. Reports exported to PDF and displayed in XenCenter only contain the data that you selected when you generated the report.
Workload Balancing report glossary
This section provides information about the following Workload Balancing reports:
- Chargeback Utilization Analysis
- Host Health History
- Pool Optimization Performance History
- Pool Audit Trail
- Pool Health
- Pool Health History
- Pool Optimization History
- Virtual Machine Motion History
- Virtual Machine Performance History
Chargeback Utilization Analysis
You can use the Chargeback Utilization Analysis report (“chargeback report”) to determine how much of a resource a specific department in your organization used. Specifically, the report shows information about all the VMs in your pool, including their availability and resource utilization. Since this report shows VM up time, it can help you demonstrate Service Level Agreements compliance and availability.
The chargeback report can help you implement a simple chargeback solution and facilitate billing. To bill customers for a specific resource, generate the report, save it as Excel, and edit the spreadsheet to include your price per unit. Alternatively, you can import the Excel data into your billing system.
If you want to bill internal or external customers for VM usage, consider incorporating department or customer names in your VM naming conventions. This practice makes reading chargeback reports easier.
The resource reporting in the chargeback report is, sometimes, based on the allocation of physical resources to individual VMs.
The average memory data in this report is based on the amount of memory currently allocated to the VM. Citrix Hypervisor enables you to have a fixed memory allocation or an automatically adjusting memory allocation (Dynamic Memory Control).
The chargeback report contains the following columns of data:
-
VM Name. The name of the VM to which the data in the columns in that row applies.
-
VM Uptime. The number of minutes the VM was powered on (or, more specifically, appears with a green icon beside it in XenCenter).
-
vCPU Allocation. The number of virtual CPUs configured on the VM. Each virtual CPU receives an equal share of the physical CPUs on the host. For example, consider the case where you configured eight virtual CPUs on a host that contains two physical CPUs. If the vCPU Allocation column has “1” in it, this value is equal to 2/16 of the total processing power on the host.
-
Minimum CPU Usage (%). The lowest recorded value for virtual CPU utilization in the reporting period. This value is expressed as a percentage of the VM’s vCPU capacity. The capacity is based on the number of vCPUs allocated to the VM. For example, if you allocated one vCPU to a VM, Minimum CPU Usage represents the lowest percentage of vCPU usage that is recorded. If you allocated two vCPUs to the VM, the value is the lowest usage of the combined capacity of both vCPUs as a percentage.
Ultimately, the percentage of CPU usage represents the lowest recorded workload that virtual CPU handled. For example, if you allocate one vCPU to a VM and the pCPU on the host is 2.4 GHz, 0.3 GHz is allocated to the VM. If the Minimum CPU Usage for the VM was 20%, the VM’s lowest usage of the physical host’s CPU during the reporting period was 60 MHz.
-
Maximum CPU Usage (%). The highest percentage of the VM’s virtual CPU capacity that the VM consumed during the reporting period. The CPU capacity consumed is a percentage of the virtual CPU capacity you allocated to the VM. For example, if you allocated one vCPU to the VM, the Maximum CPU Usage represents the highest recorded percentage of vCPU usage during the time reported. If you allocated two virtual CPUs to the VM, the value in this column represents the highest utilization from the combined capacity of both virtual CPUs.
-
Average CPU Usage (%). The average amount, expressed as a percentage, of the VM’s virtual CPU capacity that was in use during the reporting period. The CPU capacity is the virtual CPU capacity you allocated to the VM. If you allocated two virtual CPUs to the VM, the value in this column represents the average utilization from the combined capacity of both virtual CPUs.
-
Total Storage Allocation (GB). The amount of disk space that is currently allocated to the VM at the time the report was run. Frequently, unless you modified it, this disk space is the amount of disk space you allocated to the VM when you created it.
-
Virtual NIC Allocation. The number of virtual interfaces (VIFs) allocated to the VM.
-
Current Minimum Dynamic Memory (MB).
-
Fixed memory allocation. If you assigned a VM a fixed amount of memory (for example, 1,024 MB), the same amount of memory appears in the following columns: Current Minimum Dynamic Memory (MB), Current Maximum Dynamic Memory (MB), Current Assigned Memory (MB), and Average Assigned Memory (MB).
-
Dynamic memory allocation. If you configured Citrix Hypervisor to use Dynamic Memory Control, the minimum amount of memory specified in the range appears in this column. If the range has 1,024 MB as minimum memory and 2,048 MB as maximum memory, the Current Minimum Dynamic Memory (MB) column displays 1,024 MB.
-
-
Current Maximum Dynamic Memory (MB).
-
Dynamic memory allocation. If Citrix Hypervisor adjusts a VM’s memory automatically based on a range, the maximum amount of memory specified in the range appears in this column. For example, if the memory range values are 1,024 MB minimum and 2,048 MB maximum, 2,048 MB appears in the Current Maximum Dynamic Memory (MB) column.
-
Fixed memory allocation. If you assign a VM a fixed amount of memory (for example, 1,024 MB), the same amount of memory appears in the following columns: Current Minimum Dynamic Memory (MB), Current Maximum Dynamic Memory (MB), Current Assigned Memory (MB), and Average Assigned Memory (MB).
-
-
Current Assigned Memory (MB).
-
Dynamic memory allocation. When Dynamic Memory Control is configured, this value indicates the amount of memory Citrix Hypervisor allocates to the VM when the report runs.
-
Fixed memory allocation. If you assign a VM a fixed amount of memory (for example, 1,024 MB), the same amount of memory appears in the following columns: Current Minimum Dynamic Memory (MB), Current Maximum Dynamic Memory (MB), Current Assigned Memory (MB), and Average Assigned Memory (MB).
Note:
If you change the VM’s memory allocation immediately before running this report, the value reflected in this column reflects the new memory allocation you configured.
-
-
Average Assigned Memory (MB).
-
Dynamic memory allocation. When Dynamic Memory Control is configured, this value indicates the average amount of memory Citrix Hypervisor allocated to the VM over the reporting period.
-
Fixed memory allocation. If you assign a VM a fixed amount of memory (for example, 1,024 MB), the same amount of memory appears in the following columns: Current Minimum Dynamic Memory (MB), Current Maximum Dynamic Memory (MB), Current Assigned Memory (MB), and Average Assigned Memory (MB).
Note:
If you change the VM’s memory allocation immediately before running this report, the value in this column might not change from what was previously displayed. The value in this column reflects the average over the time period.
-
-
Average Network Reads (BPS). The average amount of data (in bits per second) the VM received during the reporting period.
-
Average Network Writes (BPS). The average amount of data (in bits per second) the VM sent during the reporting period.
-
Average Network Usage (BPS). The combined total (in bits per second) of the Average Network Reads and Average Network Writes. If a VM sends, on average, 1,027 bps and receives, on average, 23,831 bps during the reporting period, the Average Network Usage is the combined total of these values: 24,858 bps.
-
Total Network Usage (BPS). The total of all network read and write transactions in bits per second over the reporting period.
Host Health History
This report displays the performance of resources (CPU, memory, network reads, and network writes) on specific host in relation to threshold values.
The colored lines (red, green, yellow) represent your threshold values. You can use this report with the Pool Health report for a host to determine how the host’s performance might affect overall pool health. When you are editing the performance thresholds, you can use this report for insight into host performance.
You can display resource utilization as a daily or hourly average. The hourly average lets you see the busiest hours of the day, averaged, for the time period.
To view report data which is grouped by hour, under Host Health History expand Click to view report data grouped by house for the time period.
Workload Balancing displays the average for each hour for the time period you set. The data point is based on a utilization average for that hour for all days in the time period. For example, in a report for May 1, 2009, to May 15, 2009, the Average CPU Usage data point represents the resource utilization of all 15 days at 12:00 hours. This information is combined as an average. If CPU utilization was 82% at 12PM on May 1, 88% at 12PM on May 2, and 75% on all other days, the average displayed for 12PM is 76.3%.
Note:
Workload Balancing smoothes spikes and peaks so data does not appear artificially high.
Pool Optimization Performance History
The optimization performance report displays optimization events against that pool’s average resource usage. These events are instances when you optimized a resource pool. Specifically, it displays resource usage for CPU, memory, network reads, and network writes.
The dotted line represents the average usage across the pool over the period of days you select. A blue bar indicates the day on which you optimized the pool.
This report can help you determine if Workload Balancing is working successfully in your environment. You can use this report to see what led up to optimization events (that is, the resource usage before Workload Balancing recommended optimizing).
This report displays average resource usage for the day. It does not display the peak utilization, such as when the system is stressed. You can also use this report to see how a resource pool is performing when Workload Balancing is not making optimization recommendations.
In general, resource usage declines or stays steady after an optimization event. If you do not see improved resource usage after optimization, consider readjusting threshold values. Also, consider whether the resource pool has too many VMs and whether you added or removed new VMs during the period that you specified.
Pool Audit Trail
This report displays the contents of the Citrix Hypervisor Audit Log. The Audit Log is a Citrix Hypervisor feature designed to log attempts to perform unauthorized actions and select authorized actions. These actions include:
- Import and export
- Host and pool backups
- Guest and host console access.
The report gives more meaningful information when you give Citrix Hypervisor administrators their own user accounts with distinct roles assigned to them by using the RBAC feature.
Important:
To run the audit log report, you must enable the Audit Logging feature. By default, Audit Log is always enabled in the Workload Balancing virtual appliance.
The enhanced Pool Audit Trail feature allows you to specify the granularity of the audit log report. You can also search and filter the audit trail logs by specific users, objects, and by time. The Pool Audit Trail Granularity is set to Minimum by default. This option captures limited amount of data for specific users and object types. You can modify the setting at any time based on the level of detail you require in your report. For example, set the granularity to Medium for a user-friendly report of the audit log. If you require a detailed report, set the option to Maximum.
The Pool Audit Trail report contains the following information:
-
Time. The time Citrix Hypervisor recorded the user’s action.
-
User Name. The name of the person who created the session in which the action was performed. Sometimes, this value can be the User ID
-
Event Object. The object that was the subject of the action (for example, a VM).
-
Event Action. The action that occurred. For definitions of these actions, see Audit Log Event Names.
-
Access. Whether the user had permission to perform the action.
-
Object Name. The name of the object (for example, the name of the VM).
-
Object UUID. The UUID of the object (for example, the UUID of the VM).
-
Succeeded. This information provides the status of the action (that is, whether it was successful).
Audit Log event names
The Audit Log report logs Citrix Hypervisor events, event objects and actions, including import/export, host and pool backups, and guest and host console access. The following table defines some of the typical events that appear frequently in the Citrix Hypervisor Audit Log and Pool Audit Trail report. The table also specifies the granularity of these events.
In the Pool Audit Trail report, the events listed in the Event Action column apply to a pool, VM, or host. To determine what the events apply to, see the Event Object and Object Name columns in the report. For more event definitions, see the events section of the Citrix Hypervisor Management API.
| Pool Audit Trail Granularity | Event Action | User Action |
|---|---|---|
| Minimum | pool.join |
Instructed the host to join a new pool |
| Minimum | pool.join_force |
Instructed (forced) the host to join a pool |
| Medium | SR.destroy |
Destroyed the storage repository |
| Medium | SR.create |
Created a storage repository |
| Medium | VDI.snapshot |
Took a read-only snapshot of the VDI, returning a reference to the snapshot |
| Medium | VDI.clone |
Took an exact copy of the VDI, returning a reference to the new disk |
| Medium | VIF.plug |
Hot-plugged the specified VIF, dynamically attaching it to the running VM |
| Medium | VIF.unplug |
Hot-unplugged the specified VIF, dynamically detaching it from the running VM |
| Maximum | auth.get_subject_identifier |
Queried the external directory service to obtain the subject identifier as a string from the human-readable subject name |
| Maximum | task.cancel |
Requested that a task is canceled |
| Maximum | VBD.insert |
Inserted new media into the device |
| Maximum | VIF.get_by_uuid |
Obtained a reference to the VIF instance with the specified UUID |
| Maximum | VDI.get_sharable |
Obtained the shareable field of the given VDI |
| Maximum | SR.get_all |
Returns a list of all SRs known to the system |
| Maximum | pool.create_new_blob |
Created a placeholder for a named binary piece of data that is associated with this pool |
| Maximum | host.send_debug_keys |
Injected the given string as debugging keys into Xen |
| Maximum | VM.get_boot_record |
Returned a record describing the VMs dynamic state, initialized when the VM boots, and updated to reflect runtime configuration changes, for example, CPU hotplug |
Pool Health
The Pool Health report displays the percentage of time a resource pool and its hosts spent in four different threshold ranges: Critical, High, Medium, and Low. You can use the Pool Health report to evaluate the effectiveness of your performance thresholds.
A few points about interpreting this report:
-
Resource utilization in the Average Medium Threshold (blue) is the optimum resource utilization regardless of the placement strategy you selected. Likewise, the blue section on the pie chart indicates the amount of time that host used resources optimally.
-
Resource utilization in the Average Low Threshold Percent (green) is not necessarily positive. Whether Low resource utilization is positive depends on your placement strategy. If your placement strategy is Maximum Density and resource usage is green, Workload Balancing might not be fitting the maximum number of VMs on that host or pool. If so, adjust your performance threshold values until most of your resource utilization falls into the Average Medium (blue) threshold range.
-
Resource utilization in the Average Critical Threshold Percent (red) indicates the amount of time average resource utilization met or exceeded the Critical threshold value.
If you double-click on a pie chart for a host’s resource usage, XenCenter displays the Host Health History report for that resource on that host. Clicking Back to Parent Report on the toolbar returns you to the Pool Health history report.
If you find that most of your report results are not in the Average Medium Threshold range, adjust the Critical threshold for this pool. While Workload Balancing provides default threshold settings, these defaults are not effective in all environments. If you do not have the thresholds adjusted to the correct level for your environment, the Workload Balancing optimization and placement recommendations might not be appropriate. For more information, see Change the critical thresholds.
Pool Health History
This report provides a line graph of resource utilization on all physical hosts in a pool over time. It lets you see the trend of resource utilization—if it tends to be increasing in relation to your thresholds (Critical, High, Medium, and Low). You can evaluate the effectiveness of your performance thresholds by monitoring trends of the data points in this report.
Workload Balancing extrapolates the threshold ranges from the values you set for the Critical thresholds when you connected the pool to Workload Balancing. Although similar to the Pool Health report, the Pool Health History report displays the average utilization for a resource on a specific date. Instead of the amount of time overall the resource spent in a threshold.
Except for the Average Free Memory graph, the data points never average above the Critical threshold line (red). For the Average Free Memory graph, the data points never average below the Critical threshold line (which is at the bottom of the graph). Because this graph displays free memory, the Critical threshold is a low value, unlike the other resources.
A few points about interpreting this report:
-
When the Average Usage line in the chart approaches the Average Medium Threshold (blue) line, it indicates the pool’s resource utilization is optimum. This indication is regardless of the placement strategy configured.
- Resource utilization approaching the Average Low Threshold (green) is not necessarily positive. Whether Low resource utilization is positive depends on your placement strategy. In the case where:
- Your placement strategy is Maximum Density
- Most days the Average Usage line is at or below the green line Workload Balancing might not be placing VMs as densely as possible on that pool. If so, adjust the pool’s Critical threshold values until most of its resource utilization falls into the Average Medium (blue) threshold range.
- When the Average Usage line intersects with the Average Critical Threshold (red), it indicates when the average resource utilization met or exceeded the Critical threshold value for that resource.
If data points in your graphs aren’t in the Average Medium Threshold range, but the performance is satisfactory, you can adjust the Critical threshold for this pool. For more information, see Change the critical thresholds.
Pool Optimization History
The Pool Optimization History report provides chronological visibility into Workload Balancing optimization activity.
Optimization activity is summarized graphically and in a table. Drilling into a date field within the table displays detailed information for each pool optimization performed for that day.
This report lets you see the following information:
-
VM Name: The name of the VM that Workload Balancing optimized.
-
Reason: The reason for the optimization.
-
Method: Whether the optimization was successful.
-
From Host: The physical server where the VM was originally hosted.
-
To Host: The physical server where the VM was migrated.
-
Time: The time when the optimization occurred.
Tip:
You can also generate a Pool Optimization History report from the WLB tab by clicking the View History link.
Virtual Machine Motion History
This line graph displays the number of times VMs migrated on a resource pool over a period. It indicates if a migration resulted from an optimization recommendation and to which host the VM moved. This report also indicates the reason for the optimization. You can use this report to audit the number of migrations on a pool.
Some points about interpreting this report:
-
The numbers on the left side of the chart correspond with the number of migrations possible. This value is based on how many VMs are in a resource pool.
-
You can look at details of the migrations on a specific date by expanding the + sign in the Date section of the report.
Virtual Machine Performance History
This report displays performance data for each VM on a specific host for a time period you specify. Workload Balancing bases the performance data on the amount of virtual resources allocated for the VM. For example, if Average CPU Usage for your VM is 67%, your VM uses, on average, 67% of its vCPU for the specified period.
The initial view of the report displays an average value for resource utilization over the period you specified.
Expanding the + sign displays line graphs for individual resources. You can use these graphs to see trends in resource utilization over time.
This report displays data for CPU Usage, Free Memory, Network Reads/Writes, and Disk Reads/Writes.