NetScaler Intelligent Traffic Management
Introduction
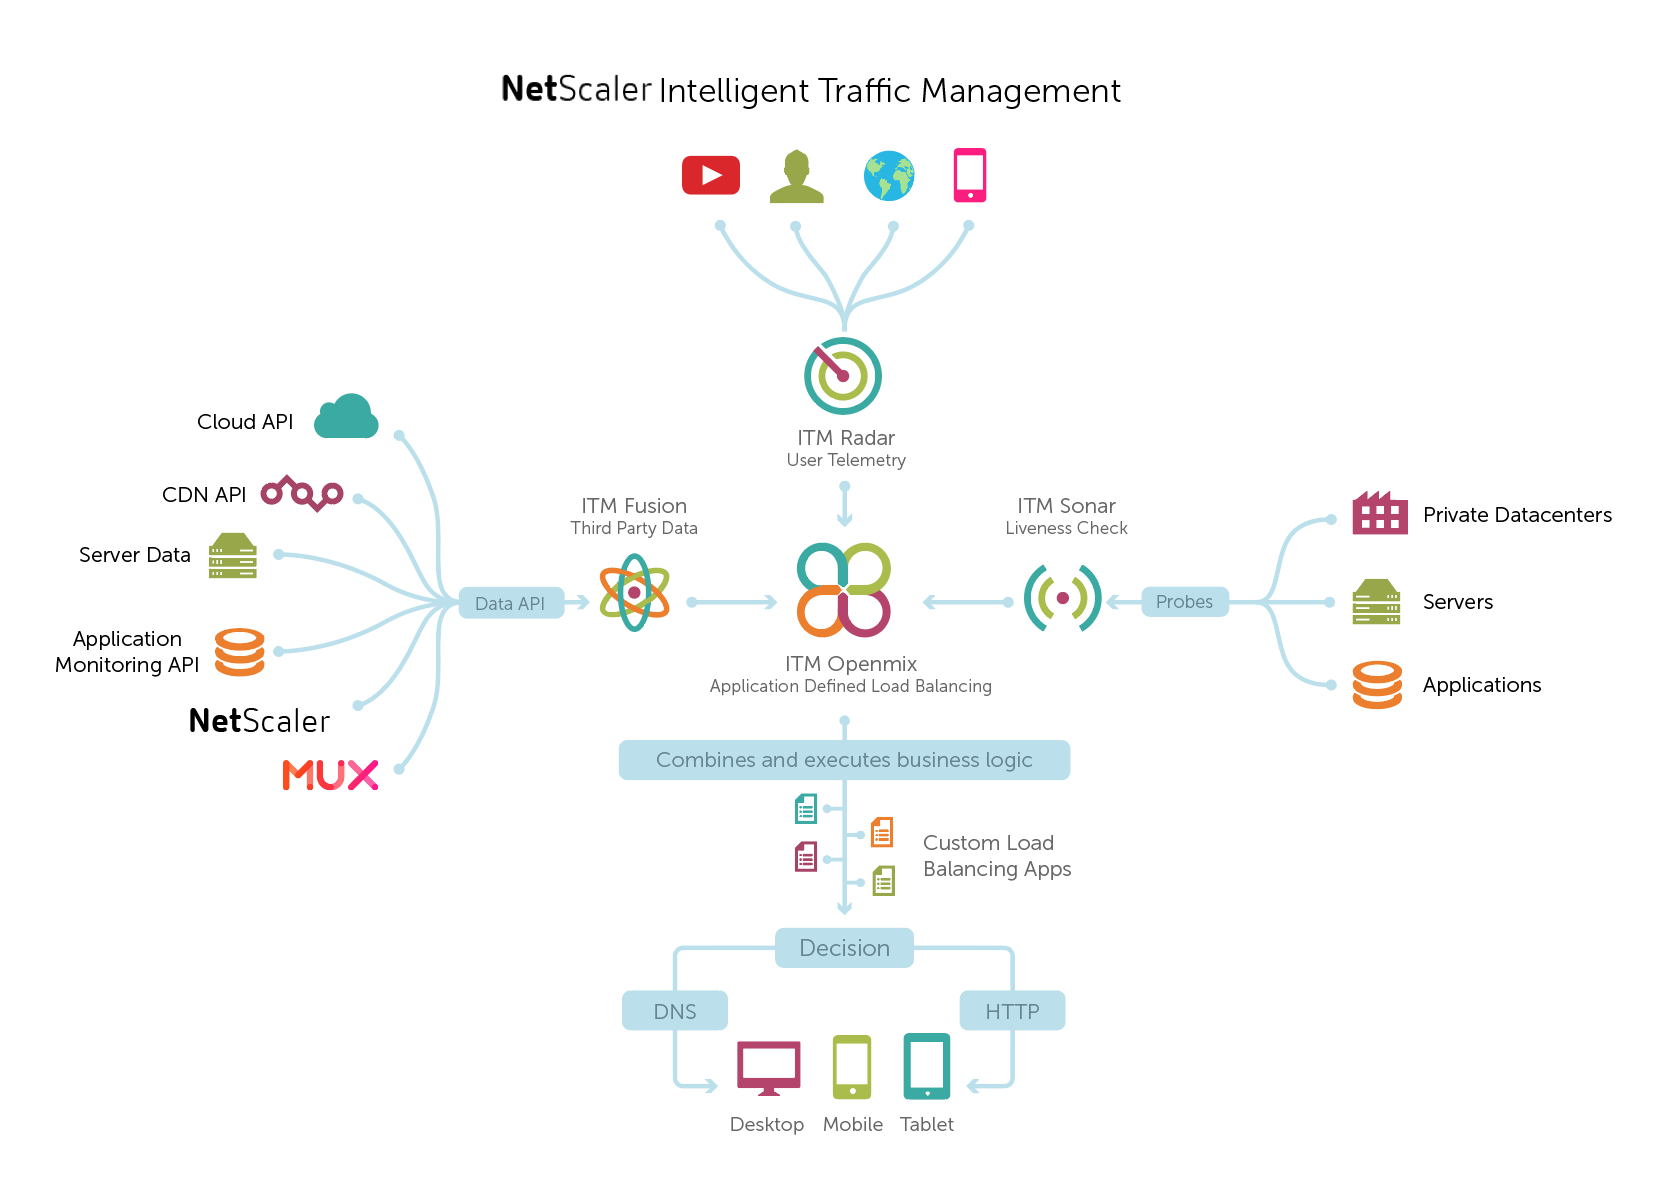
NetScaler Intelligent Traffic Management builds tools for large websites to efficiently use multi-vendor sourcing of data centers, cloud providers, and content delivery networks.
NetScaler Intelligent Traffic Management has combined real-user performance monitoring (or RUM) and data-driven DNS or API-based global load balancing into a unified service. The NetScaler Intelligent Traffic Management platform is unique in that it employs end-user-based probes for collecting real-time information by clients, along with a programmable decision engine (called Openmix) that can make use of this data.
The Openmix service allows highly flexible load-balancing decisions to be made dynamically, based on a wide variety of real-time data feeds including the data you provide. Configuration scripts can support simple methodologies such as sending the user to the fastest provider, or something more sophisticated such as factoring in usage data in the form of: time of day, cost, contractual commitments, weighting servers, capacity, BTU power usage, electricity cost and so on.
General Navigation
Once the user is logged in to the NetScaler Intelligent Traffic Management Portal, they are presented with the home screen.
The home screen provides a dashboard view of Radar traffic and Openmix traffic for the account.
The left navigation menu gives access to product reports and configuration. The menu is consistent throughout the Portal, providing easy access to all functionality offered.
Dashboard
The new ITM Dashboard is now operational, information-dense, customizable, and overall more useful than the previous version.
In the new Dashboard you can choose the charts you would like to see, such as, Radar Sessions, Radar Performance, Openmix Traffic Management Decisions, or Sonar Monitoring status. You can also create multiple dashboards, each tailored to a view that you care about.
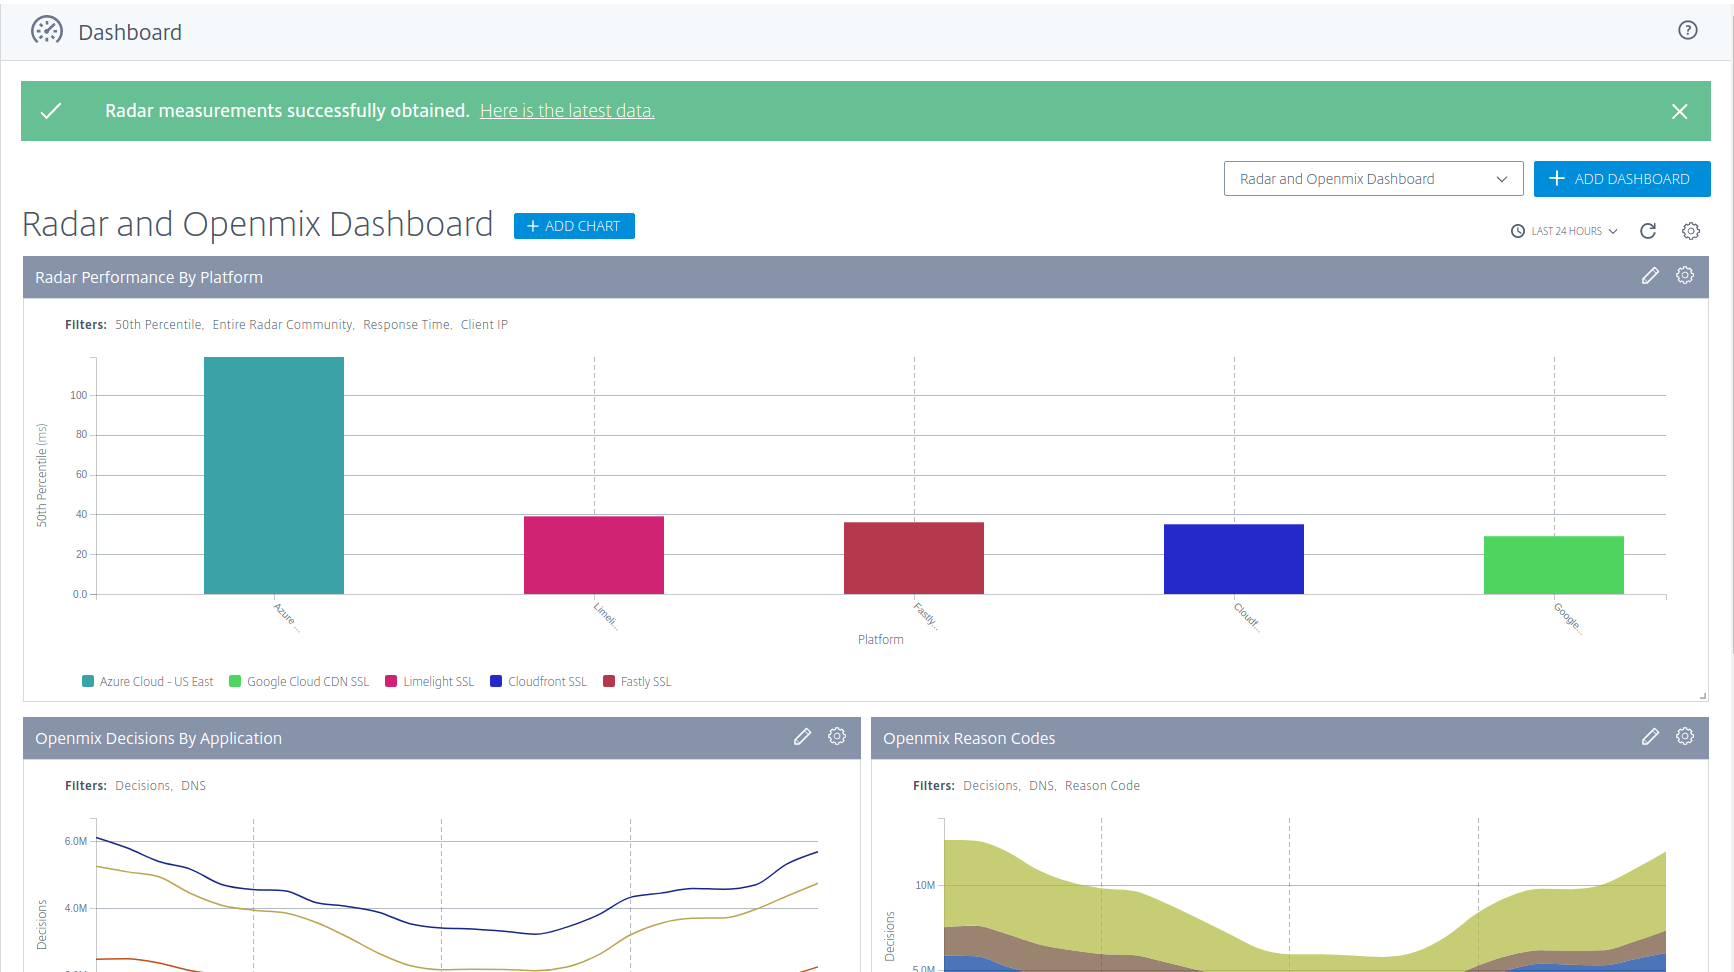
In the default view, you will see the dashboard with commonly used charts, but you can customize this view to your preference.
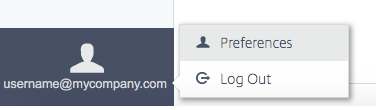
You can also choose to make the ITM Visualizer or the Dashboard your default landing page. You can do this by clicking the username on the bottom of the left navigation menu, and changing your landing page in the Preferences dialog box.
Radar
Radar data on the dashboard includes:
- Page Views over the current time period (default time period is the last 24 hours).
- Percentage change in Page Views from the previous time period.
- Trended chart of Page Views collected over the current time period.
- Radar traffic broken down by Country.
Openmix
Openmix data on the dashboard includes:
- The number of Openmix Decisions made over the current time period (default time period is the last 24 hours).
- Percentage change in Decisions from the previous time period.
- Trended chart of Openmix Decisions over the current time period.
- Decisions per Platform.
Platforms
Platform data is the number of configured Platforms (providers).
Portal list
The left navigation menu is where the end-user can configure services. The menu is split into sections based on the services available:
- Radar – Configuration of the Radar Client and Radar reports.
- Openmix – Configuration of Openmix applications for management of traffic across CDNs, clouds, data centers, in addition to third party data feeds and reports.
- Predictive DNS - Setting up zones and managing records for routing decisions based on real-time service availability.
- Impact – Analytics that provide visibility into all facets of an application such as page load performance with navigation timing data, video playback data, resource timing data, and business analytics data.
- Monitoring - Liveness check service used to monitor availability for web-based services.
- Platforms – Configuration of services, cloud regions, or data centers the customer wants to monitor or use within an Openmix application.
- CDN Purge – Ability to purge multiple CDNs at once.
- Alerts – Email alerting based on Radar data.
- Netscope - Access to detailed, actionable, and summarized reports.
- My Account – Account-specific information and configuration.
- Notifications – Notifies the user with messages related to important service changes or issues.
User menu
This is at the bottom of the navigation menu. It enables you to do the following:
- Select a different language to use within the Portal (select from Chinese, English, French, German, Japanese, and Spanish).
- Log out of the Portal.
Help and Support
If you’re experiencing an issue that requires help, click the ? icon on the top-right of the screen in the ITM Portal. You can also open a support case online at https://www.citrix.com/support/.