Navigation Timing Data
Navigation Timing reports offer a powerful view into the rich page load and event performance data collected while visitors are on your site. Following a brief description of the reports are details on how to pivot, filter, and customize the Navigation Timing reports.
Navigation Timing Reports
The Navigation Timing menu includes the following reports:
- Geo Location Report – Report of Navigation Timing by Geographic dimension.
- Performance Report – Navigation Timing measurement data over time.
- Statistical Distribution Report – A view of Navigation Timing data through a statistical distribution reporting view.
Geo Location Report
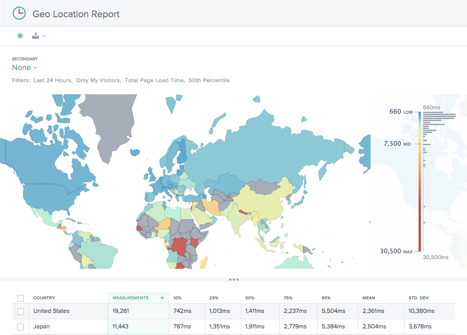
This report shows the page load time performance for each country. Zoom into the map to see greater granularity as needed.
The table lists each country with its associated page load time performance, along with the number of measurements (Page Views).
Performance Report
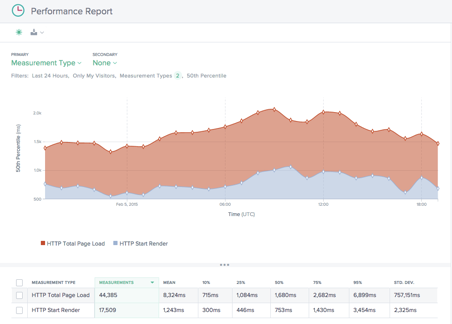
This report shows the Navigation Timing KPI performance over time broken down by measurement type.
By default, Start Render and Total Page Load Time are selected. Other measurement types can be added in as needed.
Statistical Distribution Report
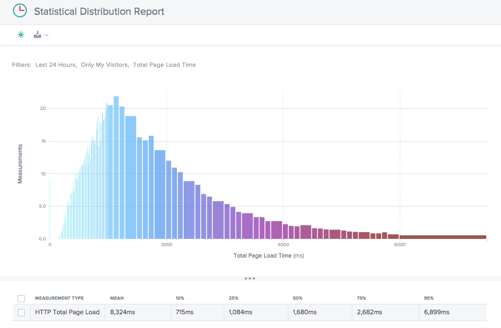
This report shows the statistical distribution of Navigation Timing and page load time values.
The report gives insight into how many measurements (Page Views) were collected per page load time value.
Using Navigation Timing Reports
To refine and customize the report views for specific reporting needs, use the following functionality in the Navigation Timing reports.
In addition to the standard features of the reports such as report sharing, background toggle, data export, and more the following features are available:
Primary and Secondary Dimensions
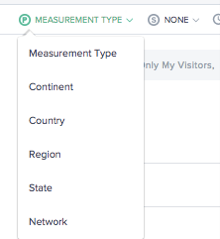
The primary dimension of the chart is selected through a selection list above the chart. Use this as a powerful pivot on the report to express the data in terms of Measurement Type (default), Continent, Country, Region, State, or Network (ASN).A secondary dimension can be chosen as well to further refine the reporting.
Filter: Report Time Range
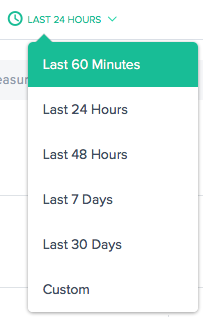
The reports can be generated with a time range of Last 60 Minutes, Last 24 Hours, Last 48 Hours, Last 7 Days, Last 30 Days, or a custom range. The default view is the Last 24 Hours.
Filters: Powerful Drill down Capabilities
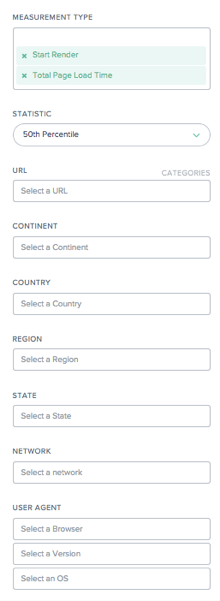
The reports vary slightly in terms of which filters are appropriate based on the data. The following are available in the Navigation Timing reports:
- Measurement Type – Select one or more measurement types to view. Start Render and Total Page Load Time are selected by default.
- Statistic – Select one statistical measure to view the data.
- URL – Select one or more URLs to view. Also, you can select a host name or a category of URLs (see below).
- Continent – Select one or more continents to include
- Country – Select one or more countries to include
- Region – Select one or more geographic regions (where applicable) to include
- State – Select one or more geographic states (where applicable) to include
- Network – Select one or more networks (ASN) to include
- User Agent – Select one or more browsers, browser version and/or OS to further refine the reporting data.
URL Categories
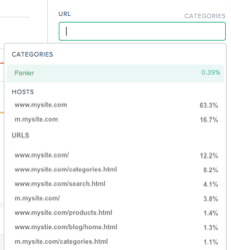
Navigation Timing reports can be filtered by URLs, Hosts, or Categories. Quickly find one or more items of interest by typing into the URL search box.
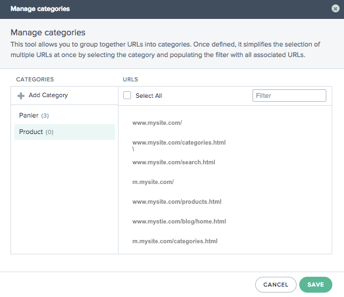
To create a Category, click CATEGORIES on the right side of the URL box. The Manage Categories dialogue box appears.
Select Add Category to create a category and name it as desired. Then select the URLs of interest for the new Category. To find URLs, simply start typing in the search box and the URL list will be filtered to the search text.
When all URLs have been selected for the Category, click the Save button to complete the Category definition.
Navigation Timing and Page Load Time Data
The Radar tag is able to collect detailed information on download performance for pages that implement the tag.Performance information from the NavTiming API is collected from those browsers that support the API (Chrome 6.5+, Firefox 8+, IE9+).
NetScaler displays this information within the customer’s portal where it allows them to see the performance actual end-users are experiencing when interacting with your webpages.
Below is a diagram and description of each of the page load metrics Radar provides via Navigation Timing:
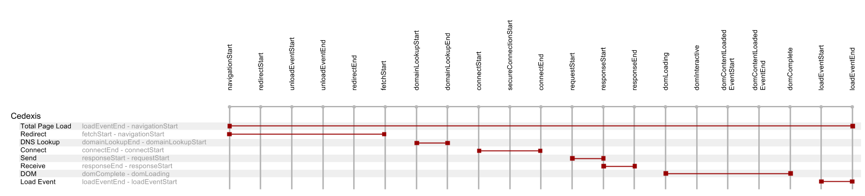
| Measurement | Description | Nav Timing Calculation |
|---|---|---|
| Total Page Load | The full download of the webpage and its corresponding components. | loadEventEnd - navigationStart |
| Redirect | The initial time used in redirecting to the page. | fetchStart - navigationStart |
| DNS Lookup | The time required for DNS resolution to complete of the base page URI. | domainLookupEnd - domainLookupStart |
| Connect | The time to make a TCP connection, inclusive of SSL if it’s used. | connectEnd - connectStart |
| Send | The HTTP Request and Response time of the initial base page, excluding any message body.A good indicator of back end server latency. | responseStart - requestStart |
| Receive | The time taken to receive the Body HTML of the base document. | responseEnd - responseStart |
| DOM | The Time to download all media, objects that are called from base HTML and load them into the browser. | domComplete - domLoading |
| Load Event | The time for executing any JavaScript and rendering the page within the browser. | loadEventEnd - loadEventStart |
| Start Render | The Start Render time is the first point in time that something was made available to the screen. | More timing added by Chrome/IE as an extension to the NavTiming API. |