Video Playback Data
Cloud Platform Visualization collects the most pertinent video network delivery performance and quality of experience data for reporting. The video quality of experience is directly driven by the quality of the video chunk delivery. Openmix optimizes based on Radar network delivery metrics to provide the best possible viewing experience for users. Following a brief description of the reports are details on how to pivot, filter, and customize the reports.
Video Playback Reports
The Video Playback Data menu includes the following reports:
- Performance Report – Video experience and delivery data over time.
- Statistical Distribution Report – Variation in the video viewing experience over time.
- Histogram Comparison Report - Compare video chunk delivery data with quality of experience KPIs.
Performance Report
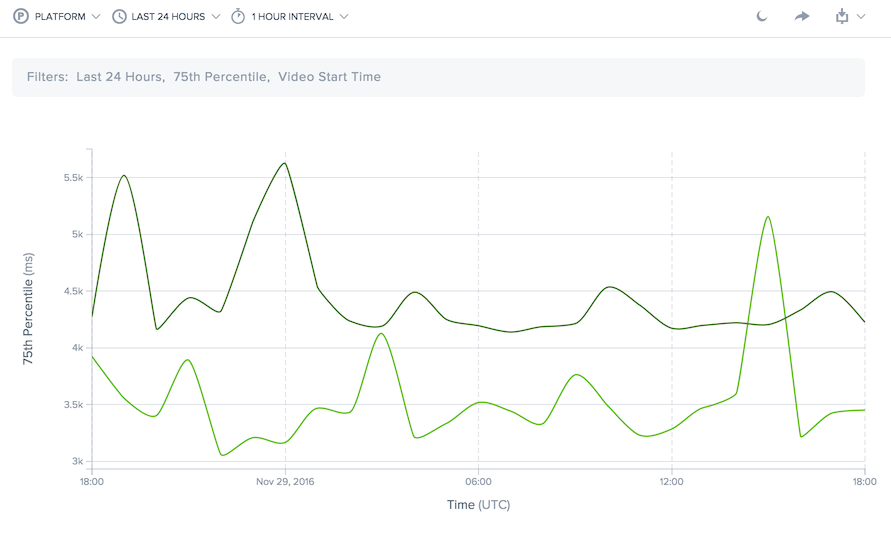
This report shows the video viewing experience over time. It allows you visualize delivery trends over time, see how much video is being watched, and the aggregate quality of the viewing experience.
The data can be viewed with dimensions that allow for comparison of multiple values. For examples, the data can be viewed by domain to compare the performance of delivery across multiple video domains.
The time period for the report can be customized from the most recent 60 minutes up to 30 days within the last 13 months. Data can be filtered by the platform being used to serve the content, the host name, and path of the content or video chunks, geographic location, network, or viewer user agent.
Statistical Distribution Report
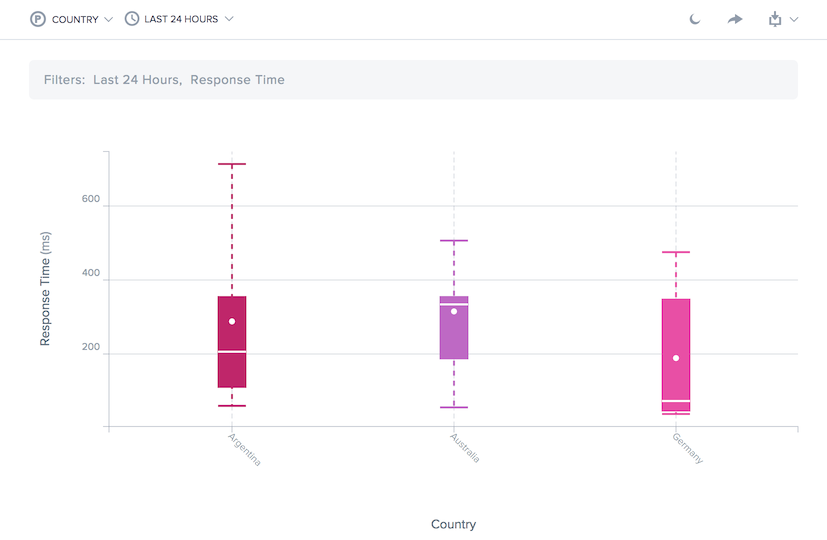
This report shows the variation in the video viewing experience over time. It allows you visualize how consistently video is delivered and better understand the viewing experiences across the whole population of users. The report calculates user performance at the 10th, 25th, 50th, 75th, and 95th percentiles and the mean.
Like the Performance Report, the data can be viewed with dimensions that allow for comparison of multiple values. For example, the data can be viewed by platform (service provider or server) to compare the consistency of delivery for multiple platforms.
The time period for the report can be customized from the most recent 60 minutes up to 30 days within the last 13 months.
Data can be filtered by the platform being used to serve the content, the host name, and path of the content or video chunks, geographic location, network, or viewer user agent.
Histogram Comparison Report
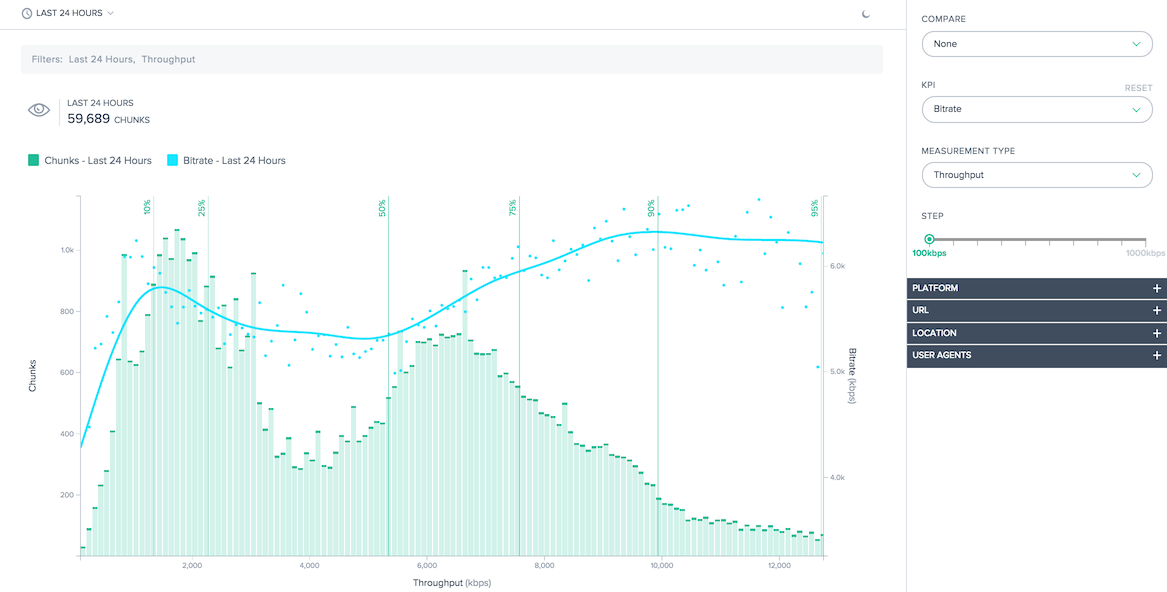
This report surfaces the relationships between video chunk delivery data and the quality of experience KPIs.
There are two main features in this report:
- The histogram shows how often video chunks were delivered with a specified level of quality, either Response Time or Throughput.
- Individual KPIs can be overlaid on the histogram. The lines chart the KPI produced when a chunk was delivered with the specified level of quality.
For example, the histogram would show the chunk throughput measured by Radar. The KPIs will likely show that bitrate is higher and rebuffering is lower when the measured throughput is higher. Together, these features help quantify the relationship between delivery quality and the quality of experience produced for the viewer.
If the default report generation is not sufficient, the histogram bucket size can customized and specific sections of the distribution can be selected for display.
In addition to relating histograms to KPIs, data can be compared directly. Multiple KPIs can be selected for viewing and previous time periods can be compared to show changes in performance over time.
Data can be filtered by the platform being used to serve the content, the host name, and path of the content or video chunks, geographic location, network, or viewer user agent.
Using Video Playback Reports
To refine and customize the report views for specific reporting needs, use the following functionality in the Performance and Statistical Distribution Video Playback reports.
In addition to the standard features of the reports such as report sharing, background toggle, data export, and more the following features are available:
Primary Dimension
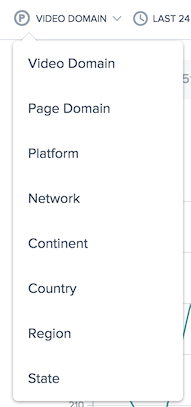
The primary dimension of the chart is selected through a selection list above the chart. Use this as a powerful pivot on the report to express the data in terms of Video Domain, Page Domain, Platform, Network (ASN), Continent, Country, Region, or State.
Filter: Report Time Range
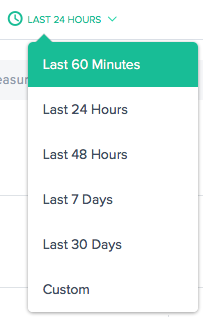
The reports can be generated with a time range of Last 60 Minutes, Last 24 Hours, Last 48 Hours, Last 7 Days, Last 30 Days, or a custom range. The default view is the Last 24 Hours.
Report Interval
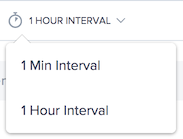
The primary dimension of the chart is selected through a selection list above the chart. This allows for granular reporting of performance data.
Filters: Powerful Drill down Capabilities
The reports vary slightly in terms of which filters are appropriate based on the data. The following are available in the Video Playback reports:
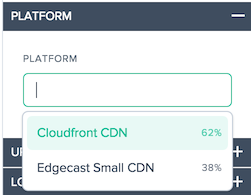
- Platform - Select one or Platforms to filter, by default all platforms are included in the report.
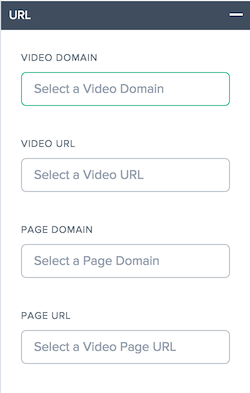
- Video Domain - Select one or more host names on which videos are hosted, by default all host names are included in the report.
- Video URL - Select one or more paths for the videos, by default all paths are included in the report.
- Page Domain - Select one or more host names on which pages are hosted, by default all host names are included in the report.
- Page URL - Select one or more paths for the pages, by default all paths are included in the report.
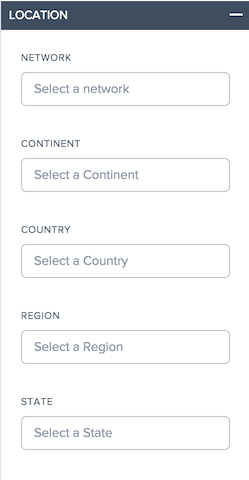
- Network – Select one or more networks (ASN) to include
- Continent – Select one or more continents to include
- Country – Select one or more countries to include
- Region – Select one or more geographic regions (where applicable) to include
- State – Select one or more geographic states (where applicable) to include
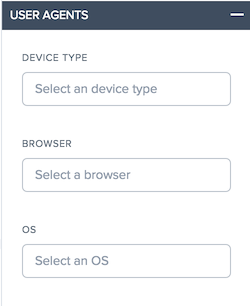
- User Agent – Select one or more device types, browsers, and/or OS types to further refine the reporting data.
Using Video Playback Performance Report
To refine and customize the performance report for specific reporting needs, use the following functionality in the Performance report.
Filters: Powerful Drill down Capabilities
The reports vary slightly in terms of which filters are appropriate based on the data. The following are available in the Video Playback reports:
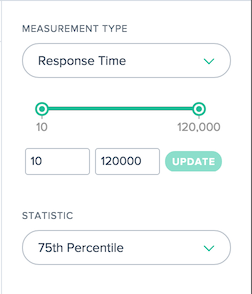
- Measurement Type – Select the measurement type to view, Response Time is initially selected.
- Count Slider - Filter the data by the minimum and maximum measurement count required to be included in the report.
- Statistic – Select the statistical measure to view.
In addition to these report-specific filters, the standard Video Playback filters are available to customize the results.
Using Video Playback Statistical Distribution Report
To refine and customize the report for specific reporting needs, apply the following functionality in the Statistical Distribution report.
Filters: Powerful Drill down Capabilities
The reports vary slightly in terms of which filters are appropriate based on the data. The following are available in the Video Playback reports:
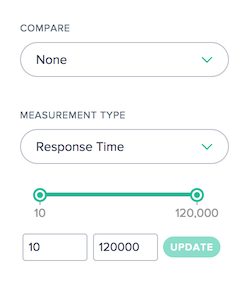
- Compare – Select the value used to create a comparison in the report. Based on the selection made, the specific values used to compare need be selected. The resulting distributions will be displayed side-by-side so they can be easily compared.
- Measurement Type – Select the measurement type to view, Response Time is initially selected.
- Count Slider - Filter the data by the minimum and maximum measurement count required to be included in the report.
In addition to these report-specific filters, the standard Video Playback filters are available to customize the results.
Using Video Playback Histogram Comparison Report
To refine and customize the report for specific reporting needs, apply the following functionality in the Histogram Comparison report.
Filters: Powerful Drill down Capabilities
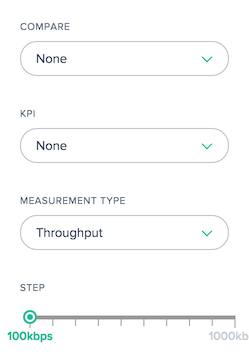
The reports vary slightly in terms of which filters are appropriate based on the data. The following are available in the Histogram Comparison reports:
- Compare – Select the value used to create a comparison in the report. Based on the selection made, the specific values used to compare need be selected. The resulting histograms and KPIs will overlaid on top of each other so they can be easily compared.
- KPI – Select the KPI that is graphed against the histogram measurement type.
- Measurement Type – Select the measurement type used to populate the histogram.
- Step Slider - Set the size of the buckets used to generate the histogram.
In addition to these report-specific filters, the standard Video Playback filters are available to customize the results.
Video Playback Data
Data is collected using the properties and events of the HTML5 video element for quality of experience data and the Resource Timing API for the video chunk data, from the browsers that support the APIs.
Video data is displayed in the portal, where reports can be generated with information on end-user quality of experience and network delivery performance.
Below is a diagram and description of each of the video metrics that are collected:
| Measurement | Description |
|---|---|
| Per-chunk Response Time | The time it takes for the chunks to start delivery based on the resource timing measurements (responseStart – requestStart) |
| Per-chunk Throughput | The speed at which video chunks were downloaded based on the resource timing measurements.(kbps) |
| Delivered Bitrate | The per-second bitrate of the video based on the size of the chunks delivered.(kb) |
| Rebuffering Ratio | The percentage of time spent rebuffering during the playback.(%) |
| Video Start Failures | The HTTP Request and Response time of the initial base page, excluding any message body.A good indicator of back end server latency. |
| Video Start Time | The amount of time it took to start video play after the play attempt is made.(ms) |