Sonar
Sonar is a liveness check service that can be used to monitor web-based services for availability. Sonar works by making HTTP or HTTPS requests from multiple points-of-presence around the world to a URL that you specify.
Sonar Basics
Endpoints tested by Sonar are considered up or down based on the following criteria:
- Requests that result in HTTP 2xx are viewed as successes and any other result, including network issues and timeouts, are treated as failures.
- Sonar follows redirect responses that return 3xx status codes, for up to 6 redirects, until it receives non-3xx response or an error occurs.
- The endpoint status is decided based on a quorum of the reporting locations. Sonar reports whichever result (success or failure) is returned by most the points-of-presence.
Sonar checks are performed from multiple test locations from around the world. The locations include:
- Singapore
- South Carolina, United States
- Tokyo, Japan
- St Ghislain, Belgium
- Washington, United States
- New York, United States
- London, England
- Hong Kong
- Frankfurt, Germany
- Dublin, Ireland
- Iowa, United States
- Virginia, United States
- Amsterdam, Netherlands
The Sonar platform is tightly integrated with the global Radar, Fusion & Openmix platform services. Sonar data is fed in real-time to all Openmix nodes around the world, to be used as an extra input for decision-making.
Platform Sonar Configuration
Sonar is configured for each platform in the Platforms page. Click a platform in the list to see the Sonar Settings section.
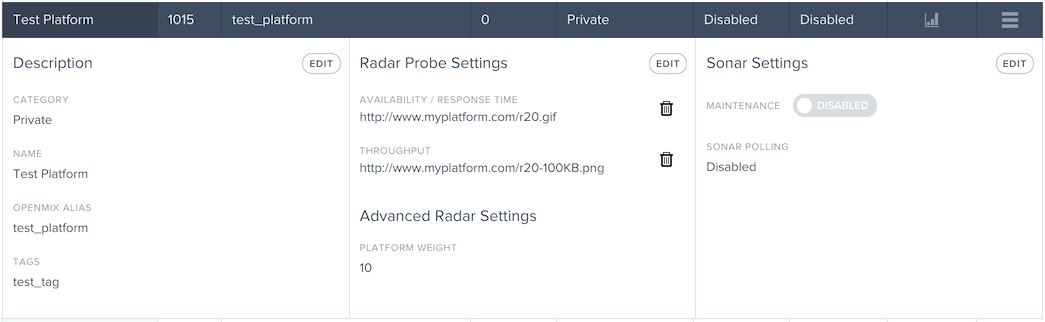
To add Sonar monitoring to the platform, click the Edit button in the Sonar Settings section.
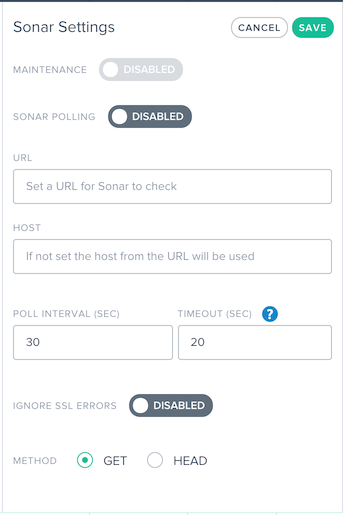
A description of the fields is below:
| Input Item | Description | Default |
|---|---|---|
| Maintenance | When enabled, Sonar will report the service as being down regardless of actual status. This is useful when wanting to remove a platform from Openmix routing in anticipation of downtime. | Disabled |
| Sonar Polling | If enabled, Sonar will checks will be made on the configured URL. | Disabled |
| URL | The URL Sonar calls to check for availability of the service. | |
| Host | The value that must be used for the Host header value in the request. | v |
| Poll Interval | The frequency specified in seconds to test for availability of the service. Checks can have a minimum interval of every 1 second up to 300 seconds (5 minutes). | 60 v |
| Timeout | The amount of time specified in seconds to wait for a response before assuming a failed check to the service. Checks can have a minimum timeout of 1 second up to 30 seconds. For lower poll intervals, such as below 5 seconds, the timeout is capped at 4 seconds. | 20 |
| Ignore SSL Errors | When enabled, Sonar will ignore SSL errors that occur during the request such as a mis-configured SSL certificate. | Disabled |
| Method | The HTTP method used for the check: GET or HEAD. |
To turn on Sonar, toggle Sonar Polling to Enabled and enter the service URL. Click Save and the checks starts.
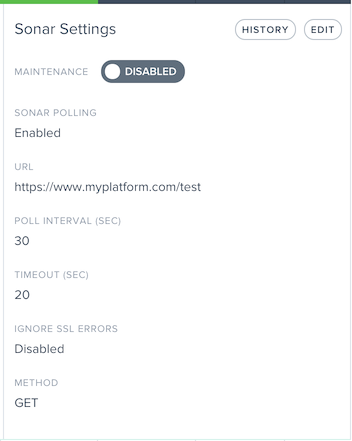
When Sonar is enabled, the Settings display the current Sonar settings.
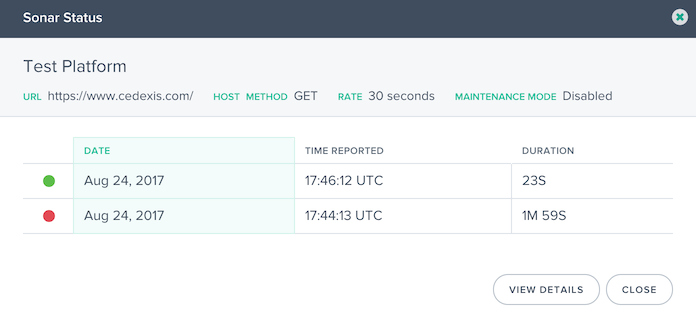
After Sonar has been enabled, you can click the History button in the Sonar Settings section to see the recent status changes and duration. Click the View Details button to go to the Sonar Platform Status page for more details and long-term status reporting.
Platform Sonar Status
When Sonar is enabled for a platform, the Sonar status is shown in the platform list in the Sonar column. When Sonar monitoring checks against the platform, the column cell is green and displays the amount of time the platform has been reachable.

If the platform monitoring checks have failed, the Sonar cell is red and will display the amount of time the platform has been unreachable.

Maintenance Mode
The Sonar status displays the availability of the service based on the success or failure of the synthetic checks. If you want to mark the platform as down even if it is reachable, in anticipation of maintenance on the platform for example, you can enable Maintenance Mode. This mode reports the platform as unavailable in the Openmix applications and will automatically stop traffic from being delivered to the platform in any Openmix application that has Sonar enabled.
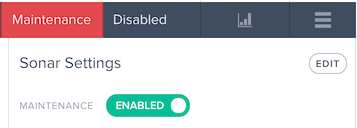
The enable Maintenance Mode, toggle the Maintenance option to Enabled.
Once enabled, the platform list item displays the Sonar status as Maintenance.
Sonar menu
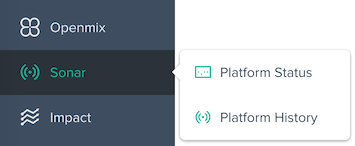
The Sonar menu is made up of the following options:
- Platform Status – Detailed results per testing location and the overall availability status.
- Platform History – Overview of the availability status over the last three months.
Platform Status
The Sonar Platform Status report shows details of the checks done by each test location and the overall status calculated from the aggregated data.
To get information about a specific platform, select a platform in the Platforms menu.
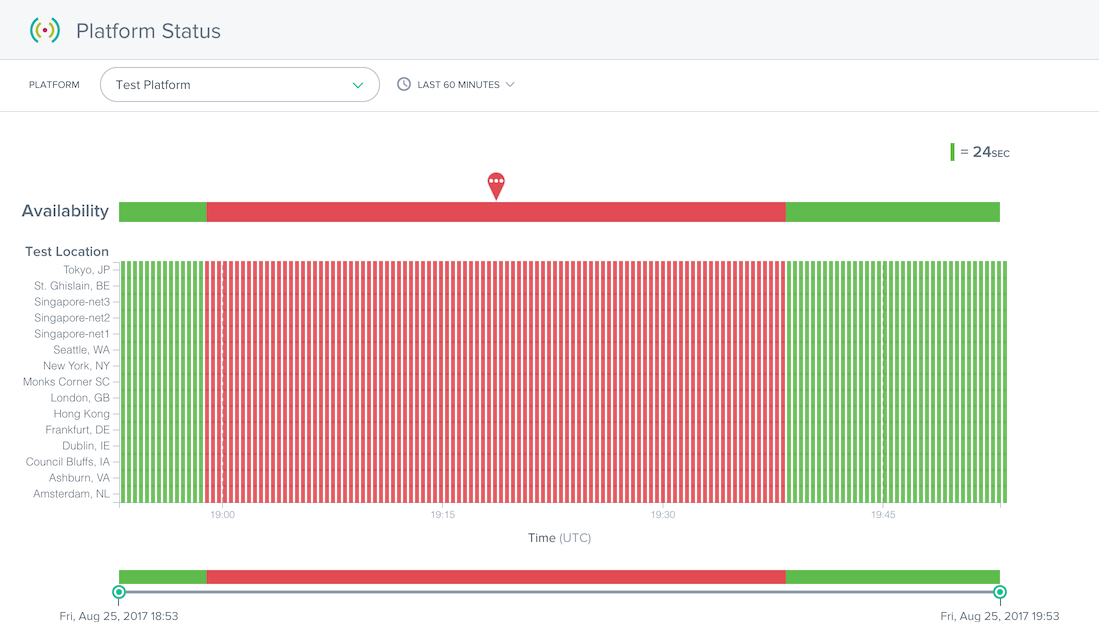
The Status report contains the following sections:
- Availability: At the top of the report is the Availability reported to Openmix based on the aggregated results from the individual test locations. This is the Sonar status that was used in the Openmix applications during the times specified.
- Test Locations: The results from each test location are shown.
- Time slider: The time slider allows you to easily drill into detailed time periods. Drag the time sliders to adjust the time period of the report and see more detailed time intervals.
The details of failed checks can be viewed by clicking a red marker in a test location row. The details for the test failures will be shown in the Details section below the report.
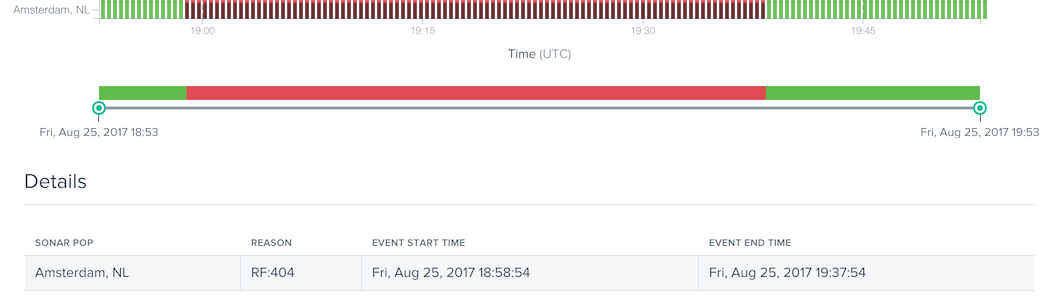
The Reason column provides details such as the error code that was returned from the Sonar checks that occurred in that test location.
Platform History
The Sonar Platform History report shows the availability status of the aggregated checks done by each test location over the past few months.
To get information about a specific platform, select a platform in the Platforms menu.
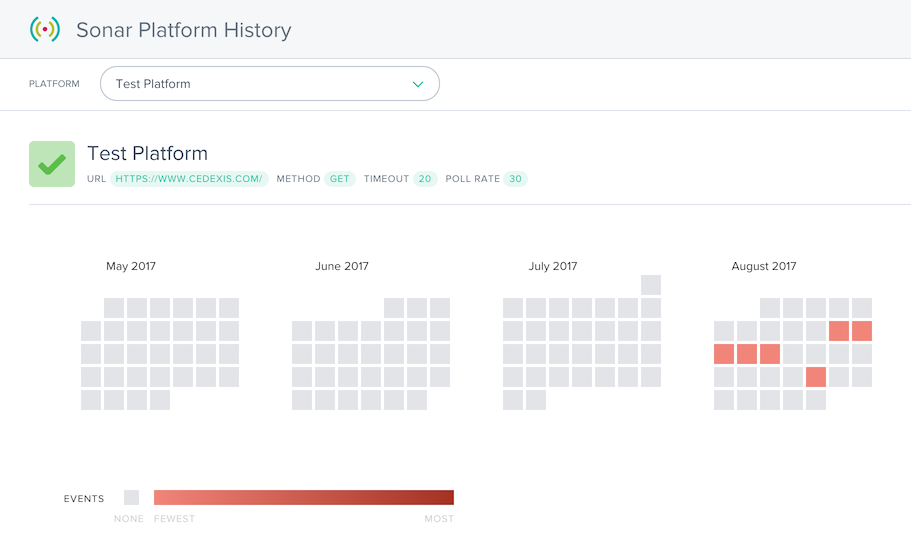
The History report displays a calendar of the last few months. The days that have service outages are shown in gradients of red. The more availability events that occurred on the day, the redder it is displayed.
Below the calendar is a list of service outages that occurred and some basic details about the events.
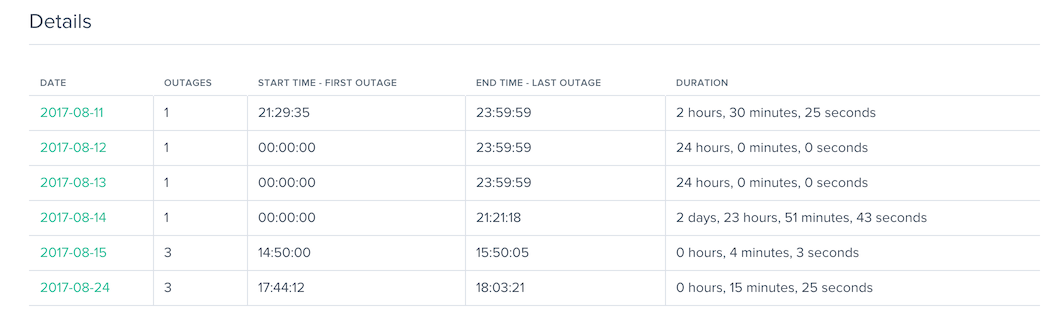
You can click the calendar day or the date in the Details columns to load the Status report for more details about the service outage.