Dashboard
The Citrix SD-WAN Center Dashboard displays a subset of the common statistics at a glance. For a single-region deployment, the statistics are obtained from the MCN that is discovered in Citrix SD-WAN Center. For a multi-region deployment, the statistics are obtained from all the regional Citrix SD-WAN Center collectors for the selected time interval. You can view the following statistics:
- Network Summary
- Network QoE
- Top Sites
- Inventory
- Events and Alarms
- Top Apps
- HDX QoE
- Management Infra
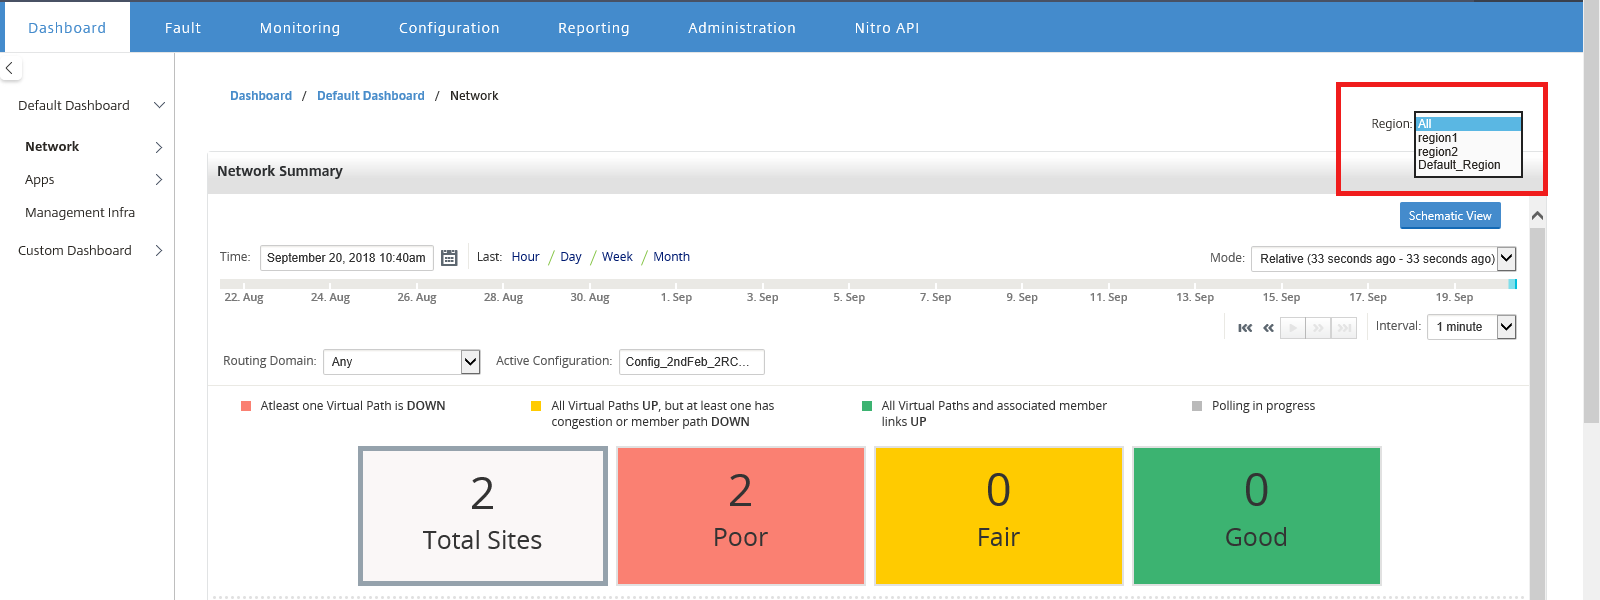
For a single-region deployment, the default region statistics are displayed on the dashboard. For a multi-region deployment, you can choose to view the multi-region dashboard or the regional dashboard. To view the multi-region dashboard, in the Region menu select All.
You can view the MCN Connection status on each region tile. The MCN Connection status is the health status of the virtual path between a RCN and the MCN.
Note
For a multi-region deployment, the default region statistics include statistics of all the sites managed by the MCN. It may also include RCN statistics since the RCNs have virtual paths to the MCN.
The Region drop-down menu is not available in Citrix SD-WAN Center Collectors.
The Citrix SD-WAN Center Dashboard is refreshed based on the configured polling interval. The default polling interval is five minutes. For more information, see Polling Interval.
Network summary
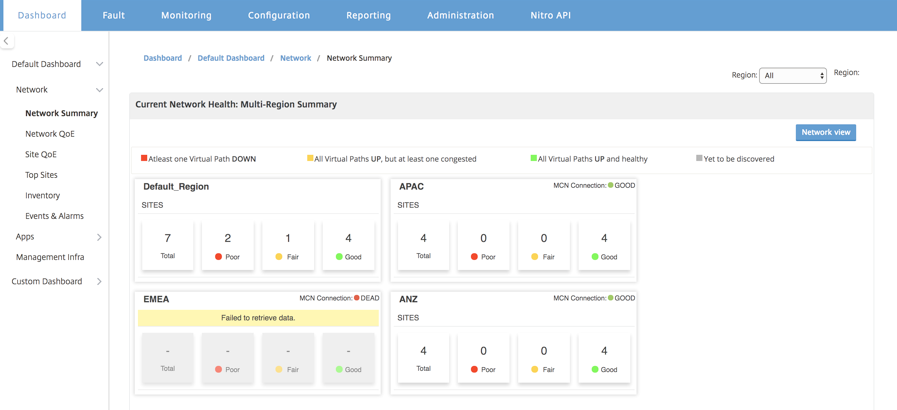
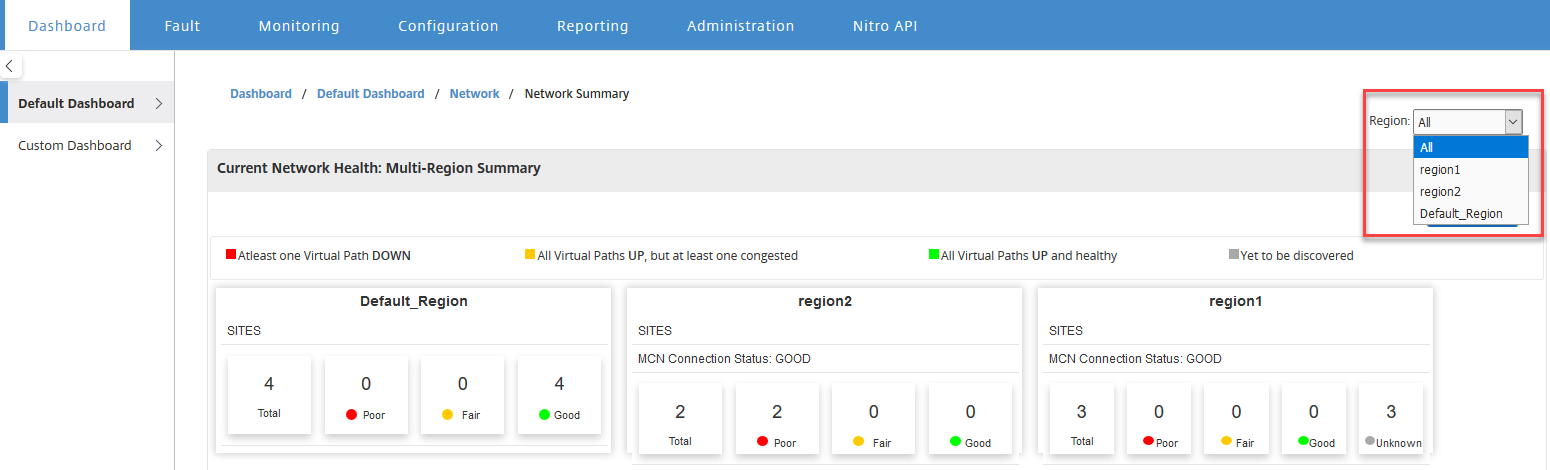
For a multi-region deployment, the Network Summary widget provides an overview of the network health at all the various regions. A region card for every region in the network is displayed with the following information:
- The total number of sites in the region.
- The number of sites in the Poor state. A site is in the Poor state when at least one virtual path is DOWN.
- The number of sites in the Fair state. A site is in the Fair state when all the virtual paths in the site are UP, but at least one path has congestion issue or a member path is DOWN.
- The number of sites in the Good state. A site is in the Good state when all the virtual paths and the associated member paths are UP.
- The number of sites in the Unknown state. A site is in the Unknown state when polling is in progress.
To view multi-region network summary, navigate to Dashboard > Default Dashboard > Network > Network Summary and in the Region drop-down menu, select All.
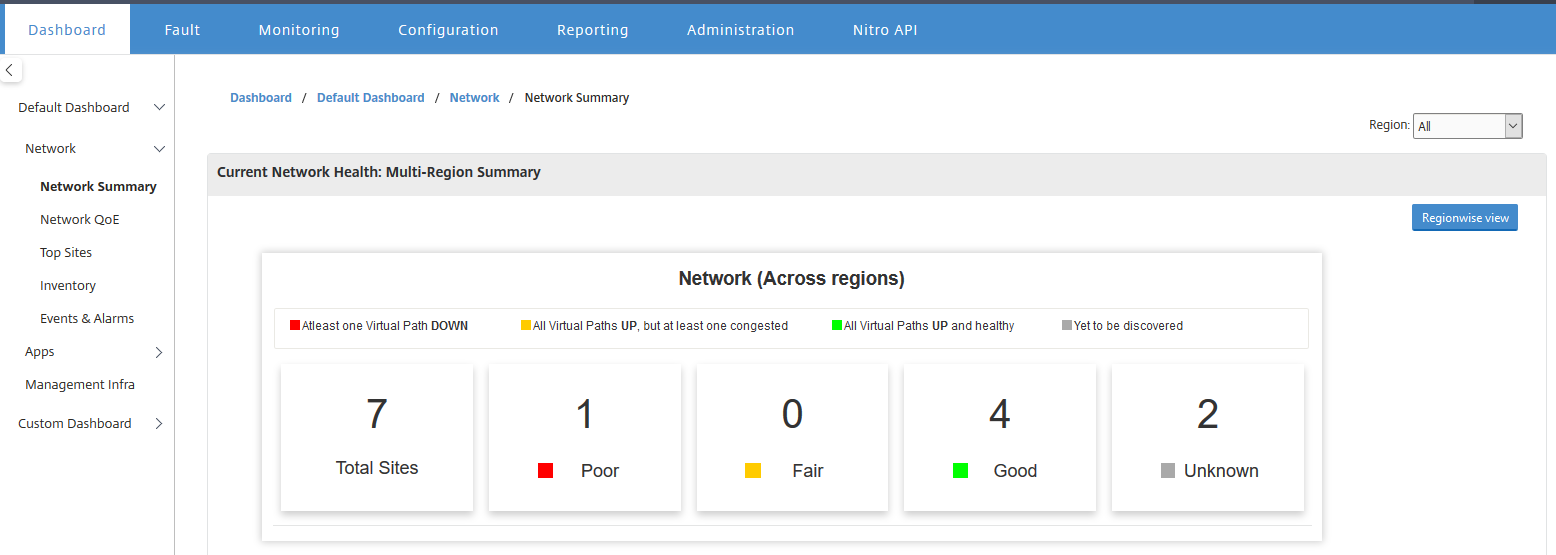
By default the screen appears in Network view. You can see the current network health of the multi-region network summary by clicking the Region wise view. You can also see the MCN Connection status on each region tile.
Click a region card to drill down into the regional dashboard.
For an individual region, the Network Summary widget provides an overview of the network health of the selected region.
To view regional network summary, navigate to Dashboard > Default Dashboard > Network > Network Summary and in the Region drop-down menu, select a region.
You can view the regional network summary in either the tile view or the schematic view.
You can use the timeline control to view the network status summary for a selected period. You can also play or pause the network status over a time range.
Mode helps to see the time as a relative or an absolute concept.
For more information on Timeline and mode see Timeline controls.
Tile view
The tile view provides the following information:
- The total number of sites in the region.
- The number of sites in the Poor state. A site is in the Poor state when at least one virtual path is DOWN.
- The number of sites in the Fair state. A site is in the Fair state when all the virtual paths in the site are UP, but at least one path has congestion issue or a member path is DOWN.
- The number of sites in the Good state. A site is in the Good state when all the virtual paths and the associated member paths are UP.
- The number of sites in the Unknown state. A site is in the Unknown state when polling is in progress.
To view a graphical representation of a path between two sites, select the path and click Visualize.
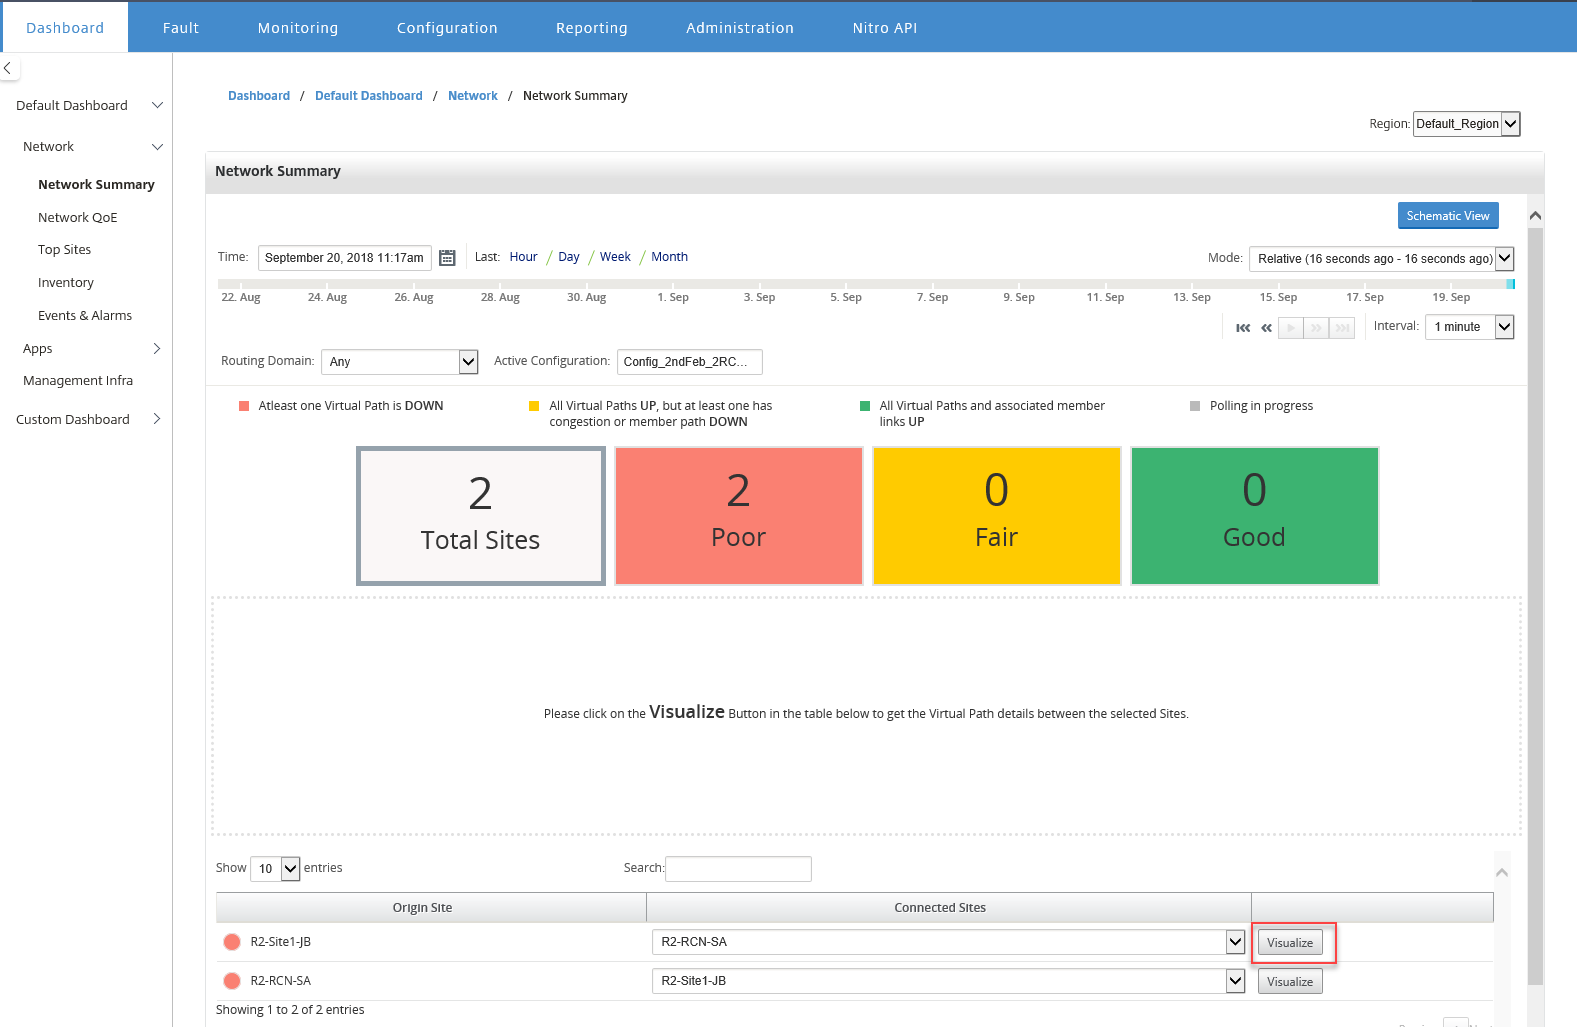
Hover the mouse cursor over the sites or the path to view more details. Click the sites to view and select report options.
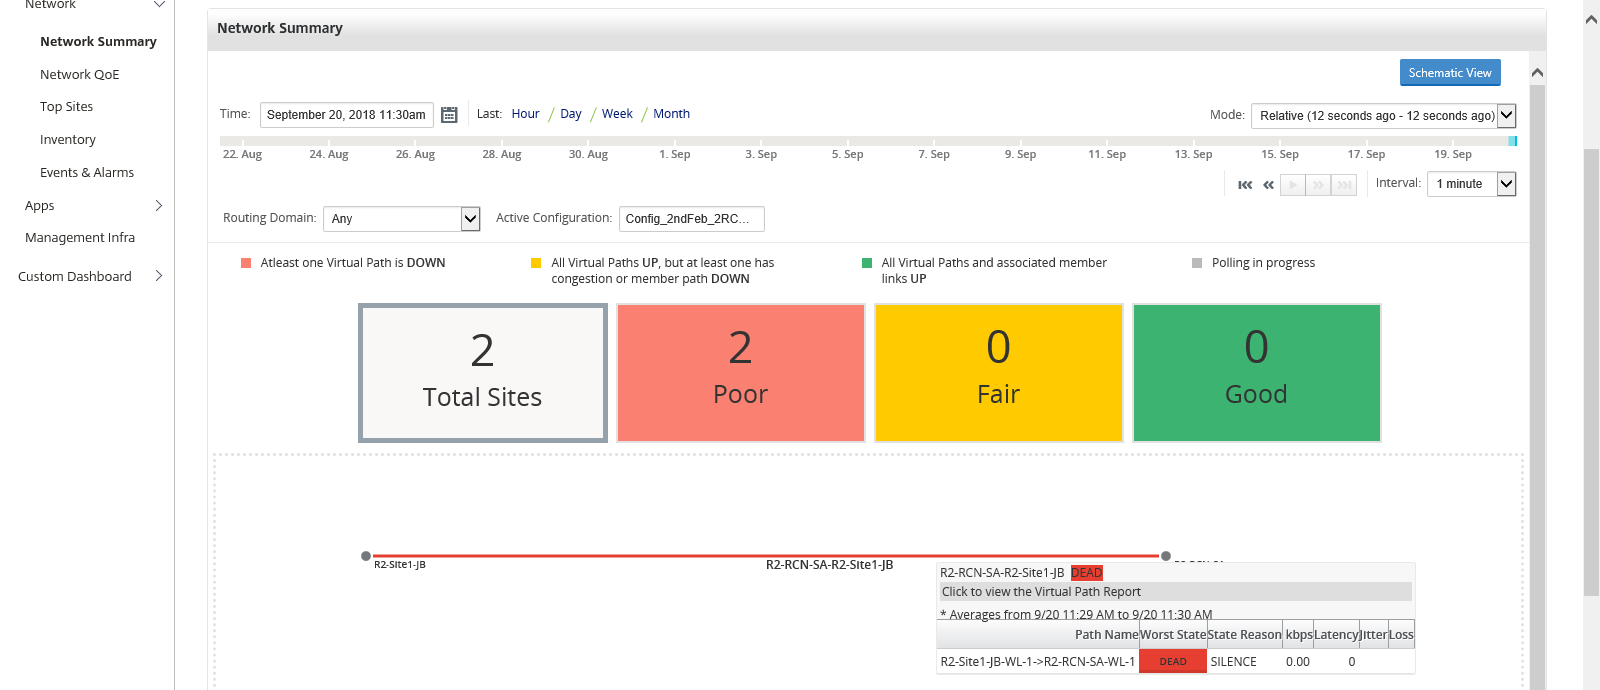
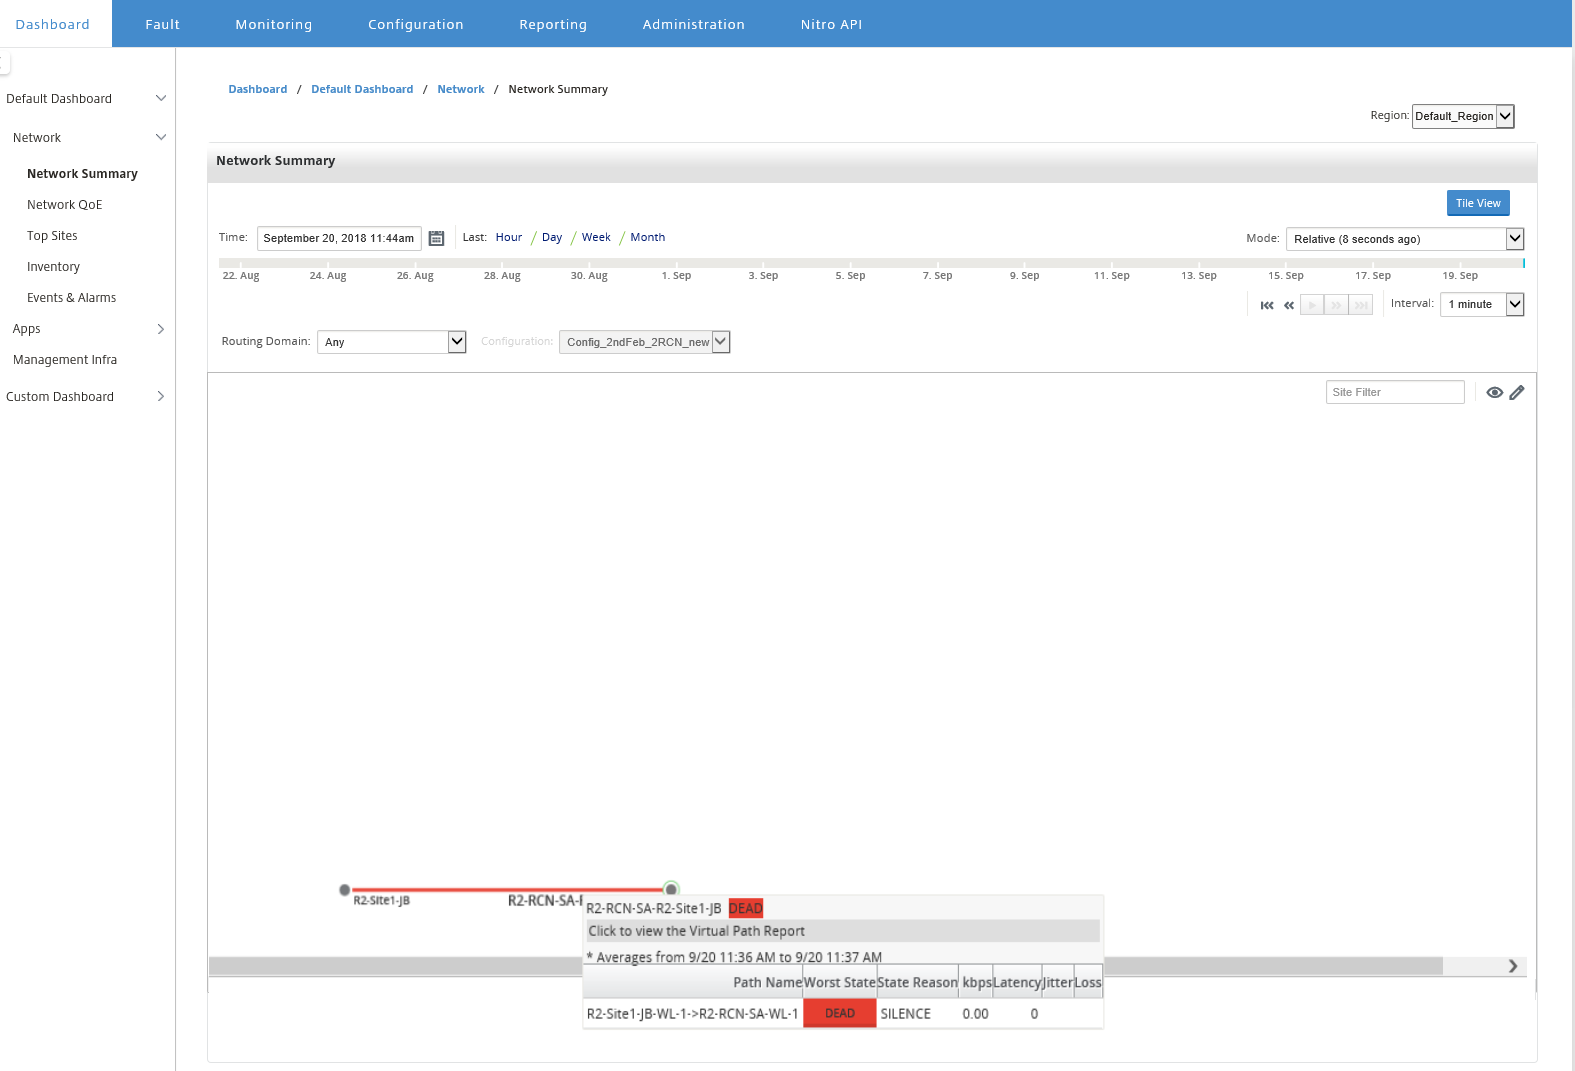
Schematic view
The schematic view provides a graphical view of the SD-WAN network. The information displayed in this section is updated depending on the selected configuration and routing domain. To view a network map here, you must import the network configuration and Network maps from the Master Controller Node (MCN). For more information, see Import MCN configuration.
Hover the mouse cursor over the sites or the path to view more details. Click the sites to view report options.
Network QoE
The Network QoE widget provides a graphical representation of the availability, loss, latency, and jitter parameters of a virtual path. It provides the statistics for both overlay virtual path and the underlay member paths.
For a multi-region deployment, you can view a list of the bottom 10 virtual paths depending on the selected metric. The virtual path data is collected from all the regional collectors for the selected time interval. You can view the bandwidth, jitter, loss, and congestion details of the virtual paths that need your attention the most.
To view multi-region virtual path health, navigate to Dashboard > Default Dashboard > Network > Network QoE and in the Region drop-down menu select All.
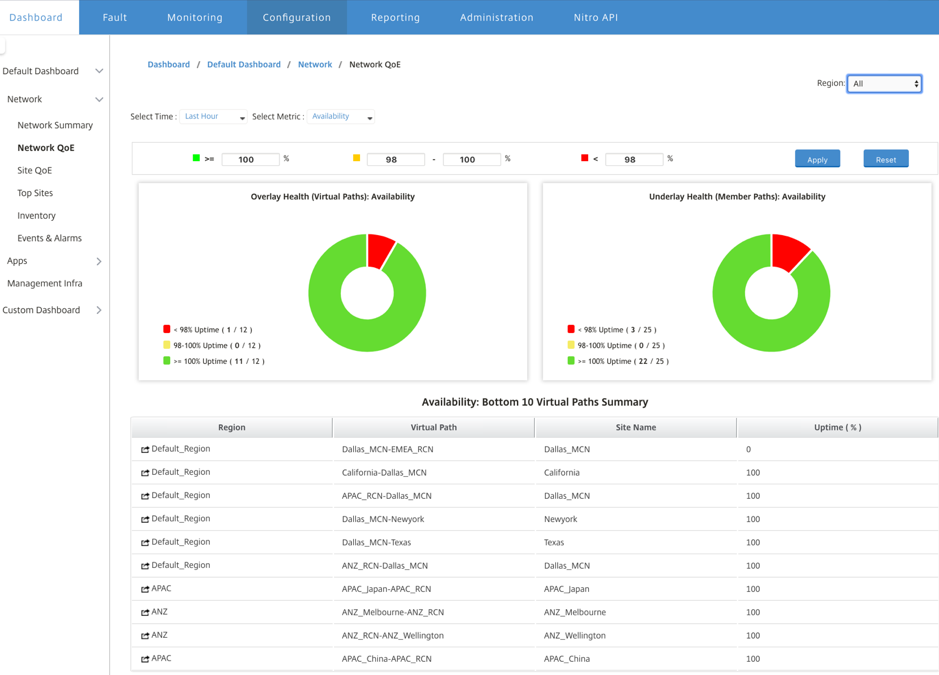
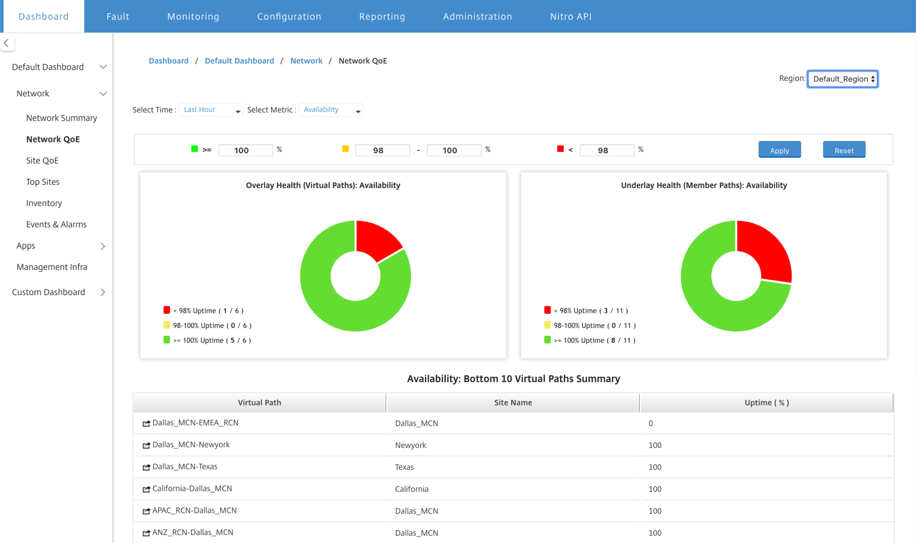
For an individual region, you can view a list of the bottom 10 virtual paths depending on the selected metric. The statistics are collected for the selected time interval. You can view the bandwidth, jitter, loss, and congestion details of the virtual paths that need your attention the most.
You can compare the overlay and underlay paths for the selected metric (availability, loss, jitter, latency) over the selected time interval. You can also set custom thresholds for the metrics and save them on click Apply. Click Reset to store the default thresholds.
The user can also drill down to any virtual path in the table by using on the drill down button on the left of each row. A Site QoE appears with the detailed comparison between the conduit and it’s underlying member paths.
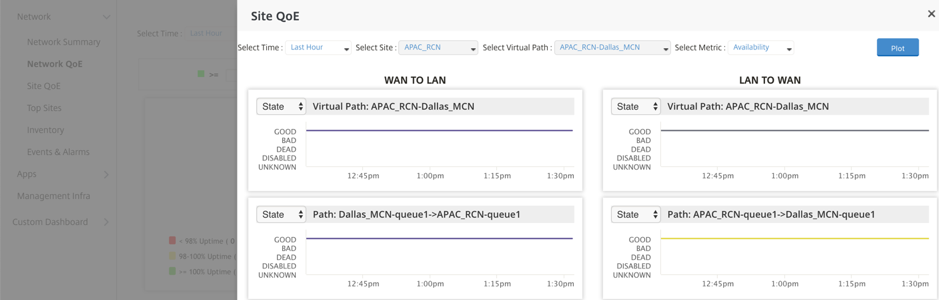
In the slider, the site name and virtual path is selected by default depending on the row that you clicked and it will be disabled. However the user can select a different time range and metric and click on Plot option to plot the new graphs.
To view regional virtual path health statistics, navigate to Dashboard > Default Dashboard > Network > Network QoE and in the Region drop-down menu select a region.
Site QoE
You can use Site QoE as a tool to compare the virtual path and it’s underlying member paths. You need to select a site and any virtual path from this site and metric .Click on Plot.
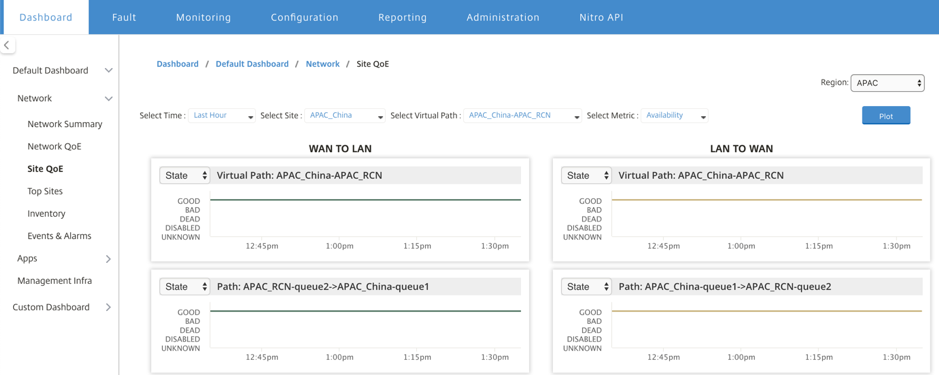
In the first section, it will plot the virtual paths statistics in both WAN to LAN and LAN to WAN direction. Below section will plot all the underlying member paths graphs. Both these things are present at both region and network level.
Top sites
For a multi-region deployment, the Top Sites widget lists the top 10 sites across all the regions, which have the highest bandwidth usage, in the selected time interval.
To view the top sites across all regions, navigate to Dashboard > Default Dashboard > Network > Top Sites and in the Region drop-down menu select All.
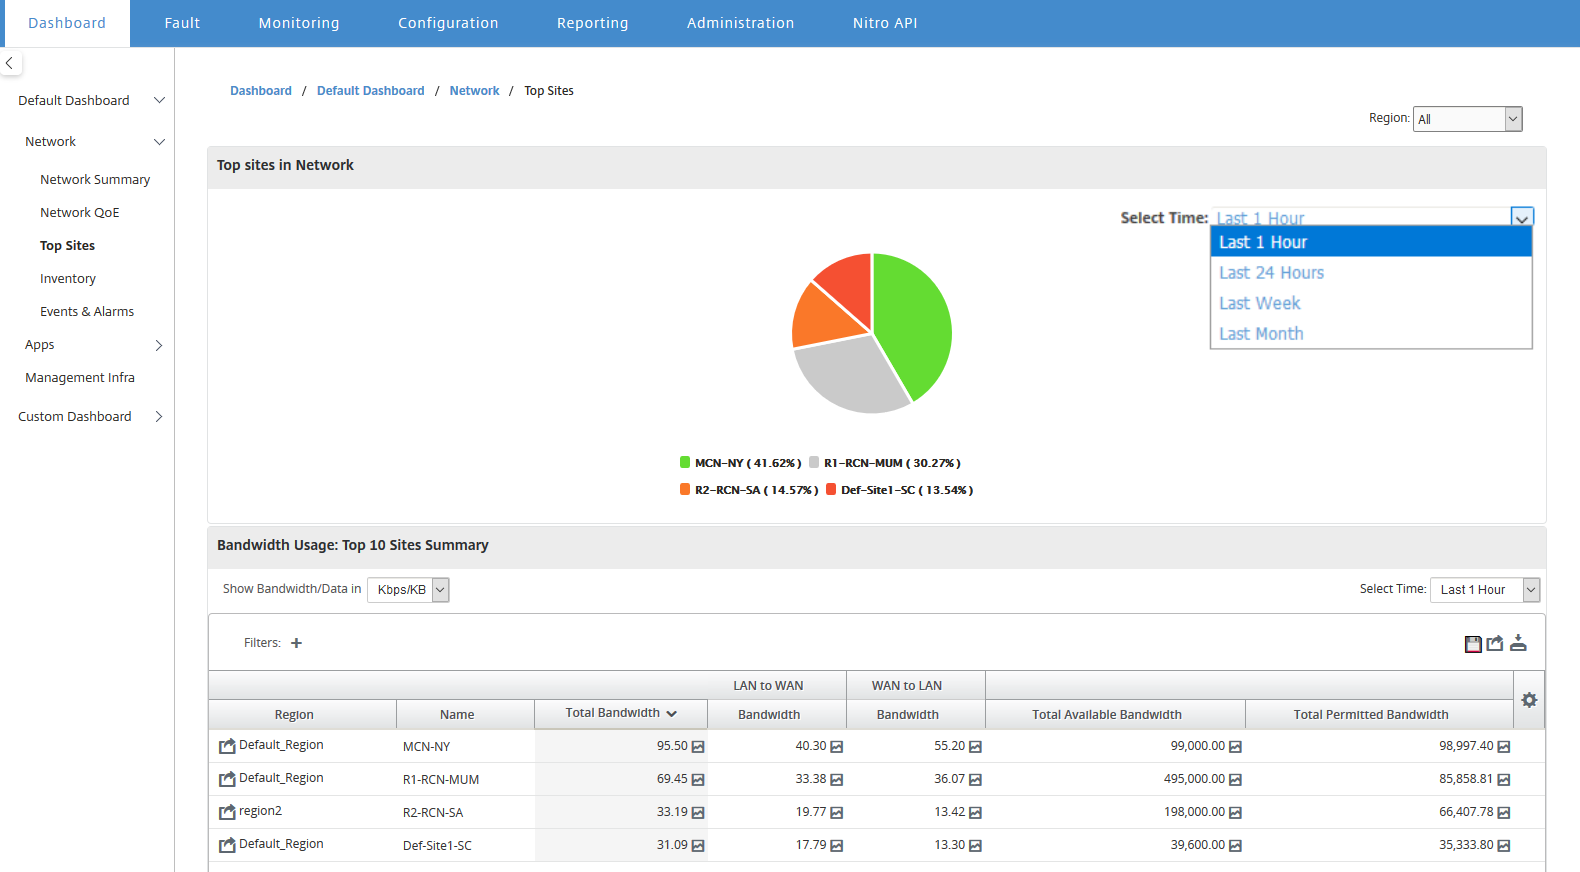
Click a site or metric to view detailed reports and statistics.
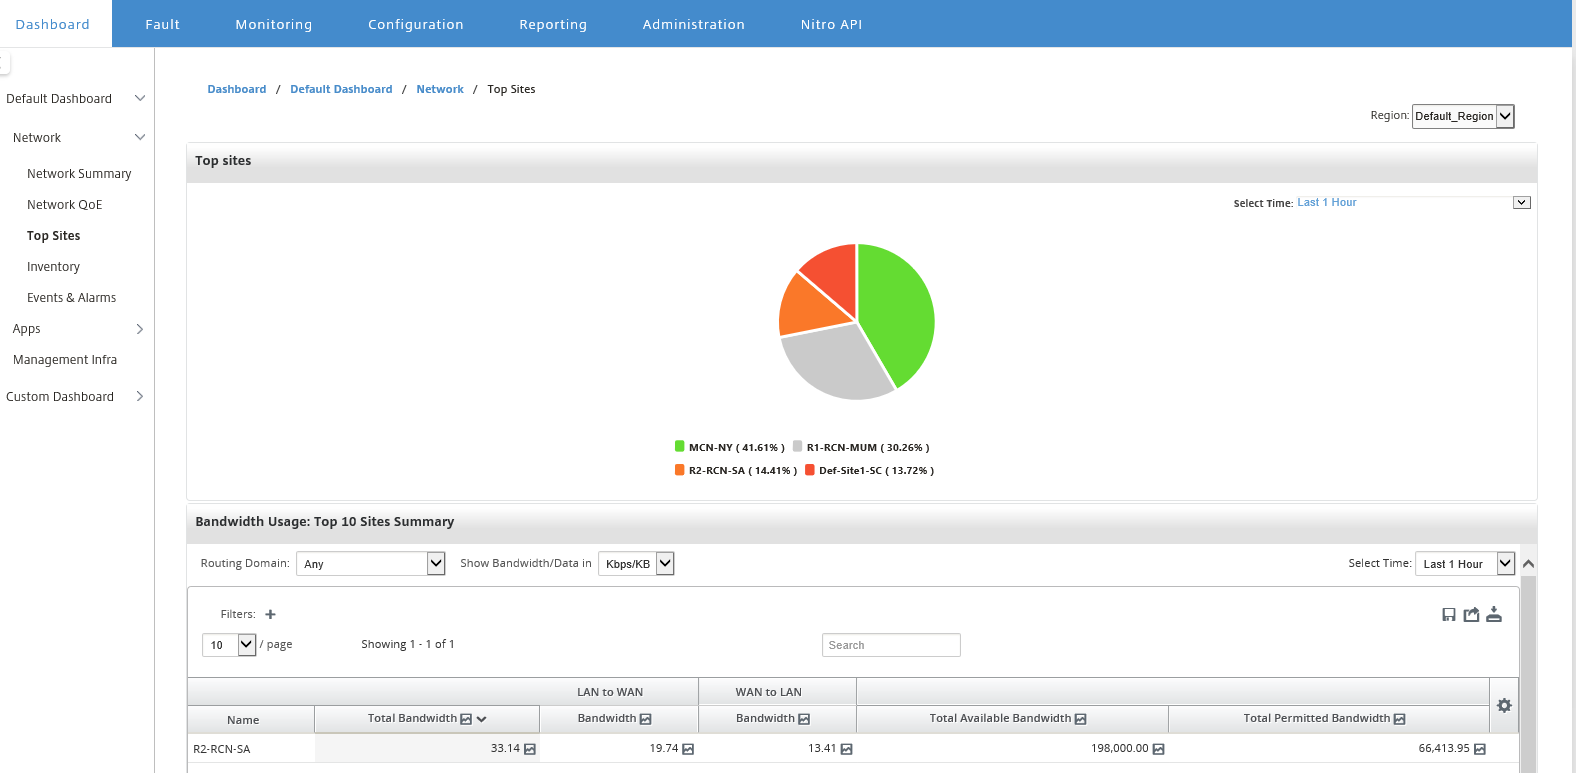
For an individual region, the Top Sites widget displays the bandwidth usage statistics for all the sites in the region. The statistics are collected for the selected time interval. You can filter the sites based on the routing domain.
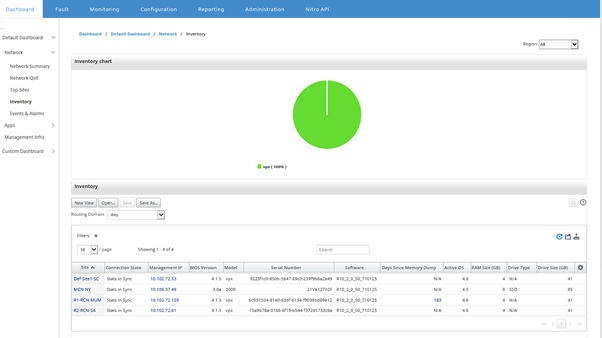
Inventory
Every 30 minutes, the Inventory manager gathers the hardware information from all the Citrix SD-WAN appliances that are discovered on Citrix SD-WAN Center.
To view the multi-region inventory statistics, navigate to Dashboard > Default Dashboard > Network > Inventory and in the Region drop-down menu select.
To view inventory statistics of a specific region, in the Region drop-down menu select the region.
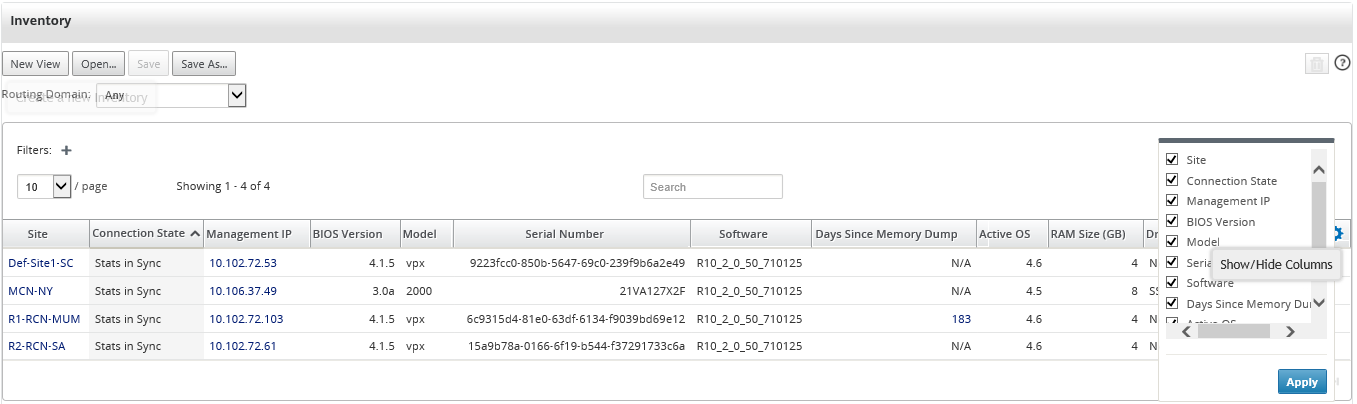
You can view the following inventory statistics:
- Site: Name of the site found in the configuration running in the MCN. If the appliance is a secondary MCN, “(secondary)” appears next to the name. You can click the name to access the appliance web console.
- Connection Status: Connectivity state to the appliance. A red icon appears when the connection is not reachable or not authenticated.
- Management IP: Management IP address of the appliance. You can click the IP address to access the appliance web console.
- BIOS Version: BIOS version of the appliance.
- Model: Hardware model of the appliance.
- Serial Number: Serial Number of the appliance.
- Software; SD-WAN software version number.
- Days Since Memory Dump: Time since last system-error memory dump. If the appliance dumped its memory in the past four days, an error icon appears next to the time. If the memory dump occurred between 5 and 10 days ago, a warning icon appears. N/A appears if no dump is available. Clicking the time opens the log page of the SD-WAN.
- Active OS: The OS currently running on the appliance.
- RAM Size (GB): Amount of RAM currently installed on the appliance in GB.
- Drive Type: Type of data-storage drive installed on the appliance. The value can be SSD (Solid State Drive) or HDD (Hard Disk Drive).
- Drive Size (GB): Size of the data-storage drive currently installed on the appliance in GB.
Note
You can arrange the columns for the inventory statistics table by using the Show/Hide Columns option.
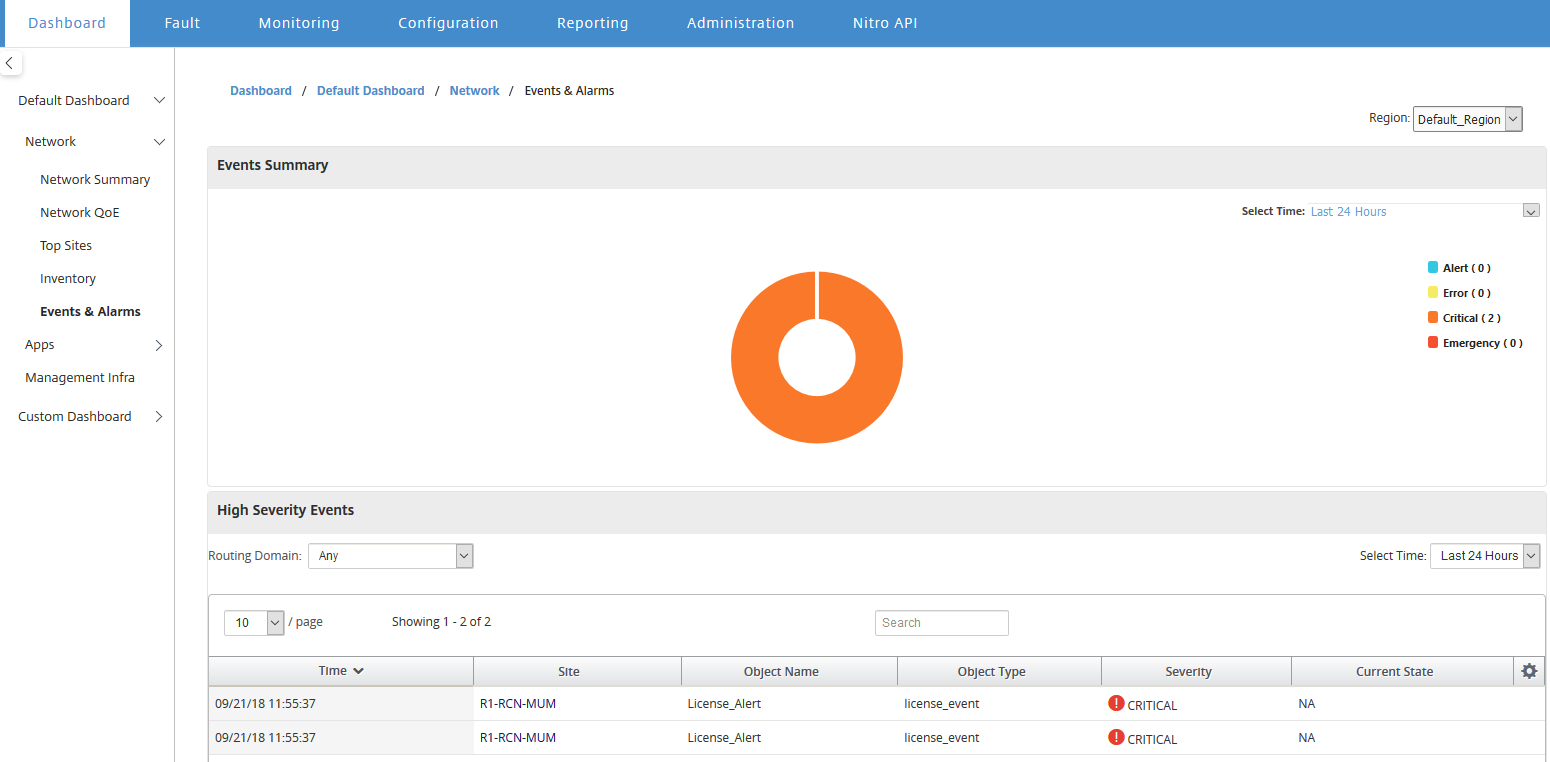
Events and alarms
For a multi-region deployment, you can view the events and alarms of all the regions in the network. This information is collected for the selected time interval. To view multi-region events and statistics, navigate to Dashboard > Default Dashboard > Network > Events & Alarms and in the Region drop-down menu select All.
You can also view all the events and alarms of an individual region. This information is collected for the selected time interval. To view events and alarm statistics, navigate to Dashboard > Default Dashboard > Network > Events & Alarms and in the Region drop-down menu select a region.
The Event Summary section gives a graphical overview of the event type and quantity of events. You can click the graph to view the events on the Fault page. The display also outlines how many events are in each category. Alarm triggers can be configured on the individual SD-WAN Appliances. For more information see, Event notifications.
The High Severity Events section displays a list of the severe events. You can filter the events based on the routing domain. The information displayed in this section is gathered from the Fault tab. For more information, see Events.
Apps
Top aaps
Deep packet inspection (DPI) allows the SD-WAN appliance to parse the traffic passing through it and identify the application and application family types. For a multi-region deployment, you can view the top applications and top application families across all the regions in the network. This information is collected for the selected time interval.
To view top application statistics across all the regions in the network, navigate to Dashboard > Default Dashboard > Apps > Top Apps, and in the Region drop-down menu select All.
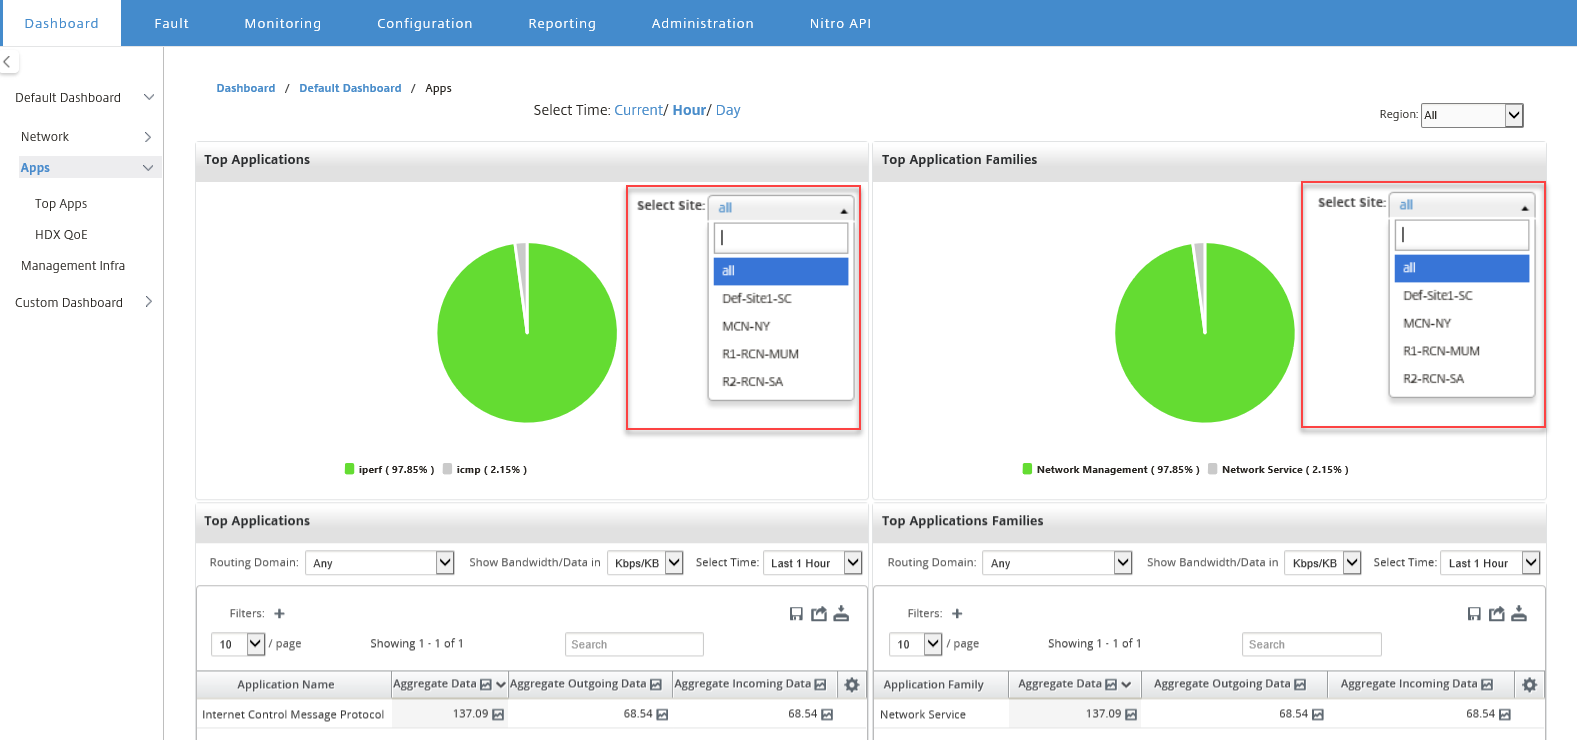
You can view the searchable dropdown for site selection for both Top Application and Top Application Families.
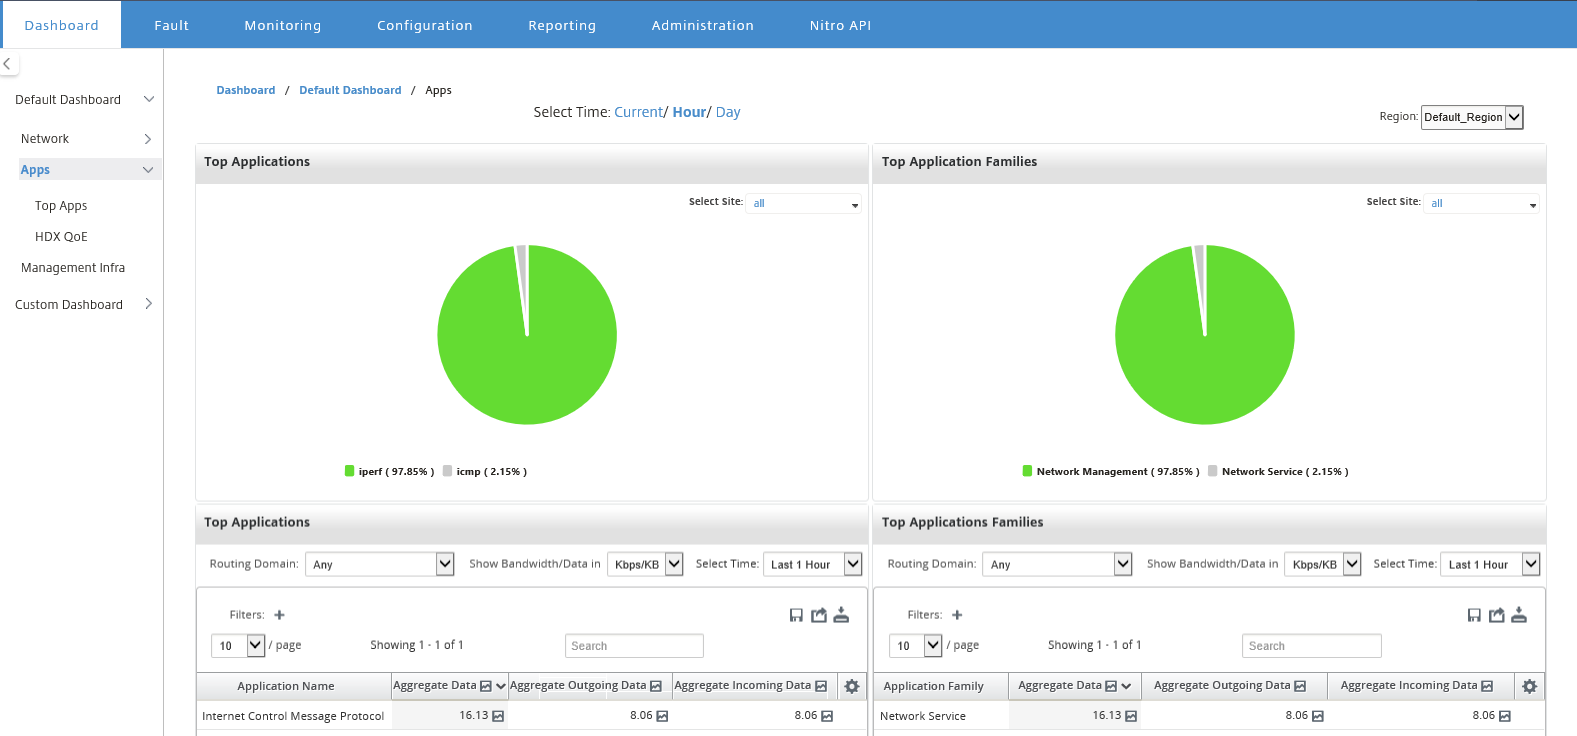
You can also view the top applications and top application families of a particular region.
To view the application statistics of a region, navigate to Dashboard > Default Dashboard > Apps > Top Apps and in the Region drop-down menu select a region.
You can select the site and time interval as last 24 hours, last 1 hour, or current.
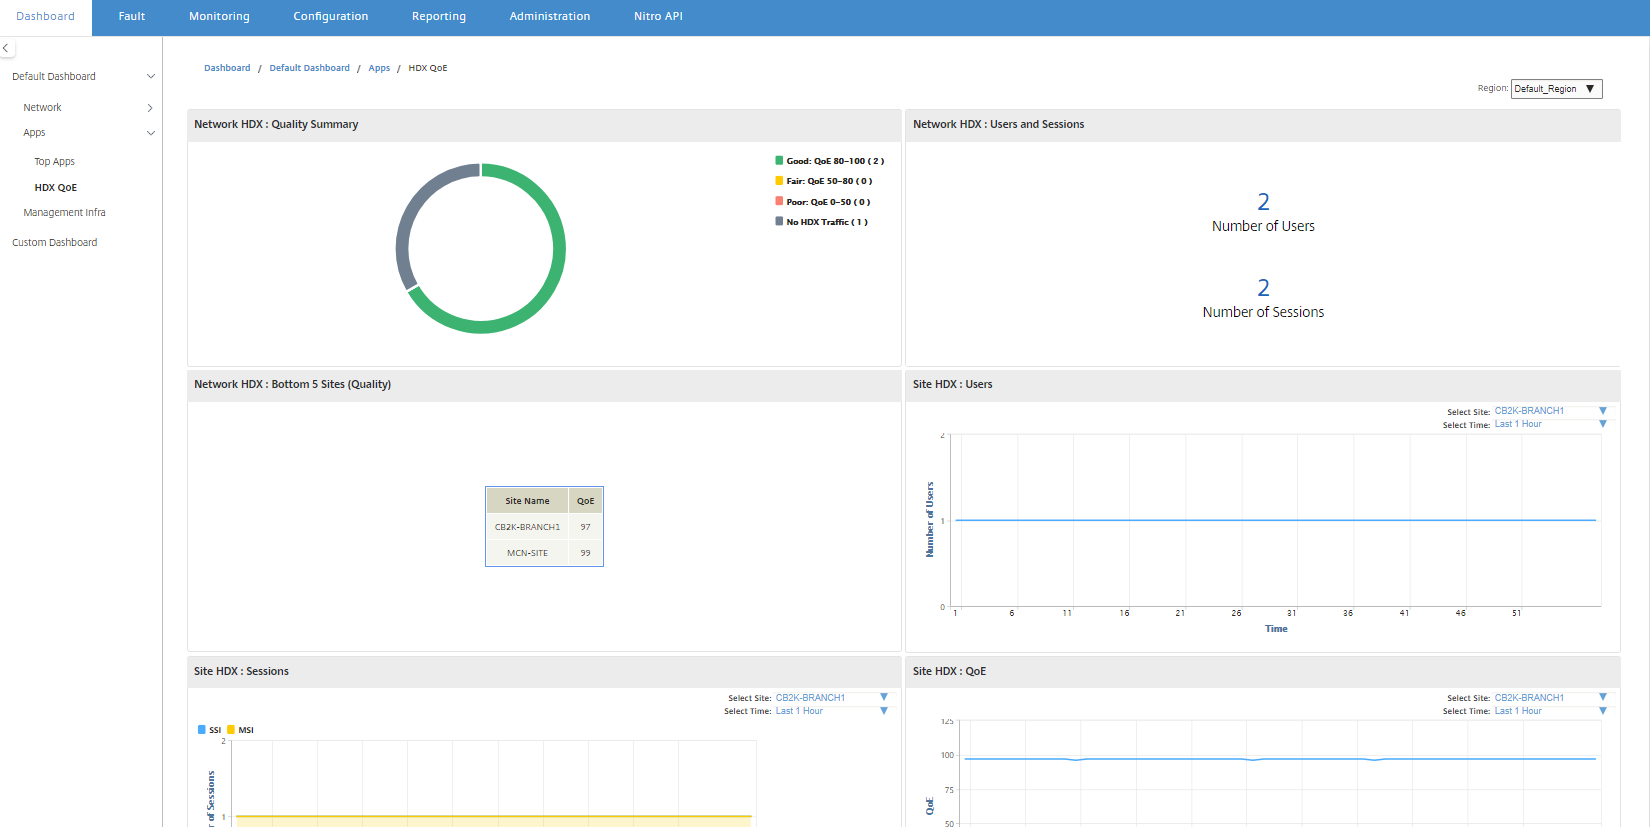
HDX QoE
Quality of Experience (QoE) is a calculated index that helps you understand your ICA quality of experience. This index is calculated for all ICA application traffic traversed from WAN to the site. Statistics of packet drop, jitter, and latency are used in the QoE calculation. The QoE is an integer between [0, 100], the higher the number, the better the user experience. The jitter, latency, and packet drop statistics are tracked on data paths during packet processing.
Sites in the entire network are categorized as good, fair, poor, or no HDX traffic based on the QoE of HDX traffic. For more information, see HDX QoE.
To view HDX QoE, of sites, across all the regions in the network, navigate to Dashboard > Default Dashboard > Apps > HDX QoE, and in the Region drop-down menu select All.
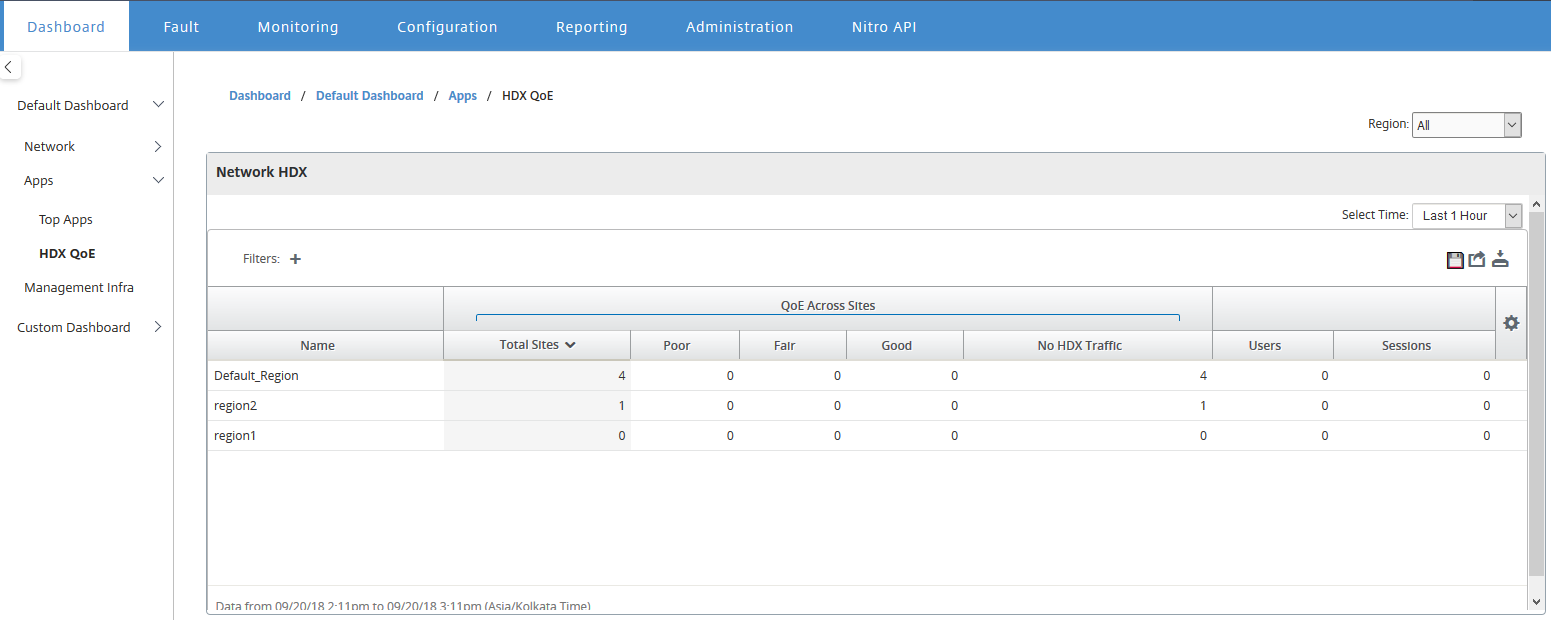
You can view the following HDX QoE metrics for the individual regions.
- Network HDX: Quality Summary
- Network HDX: Users and Sessions
- Network HDX: Bottom five Sites (Quality)
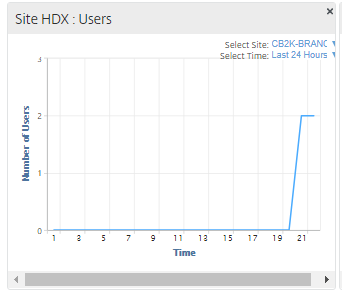
- Site HDX: Users
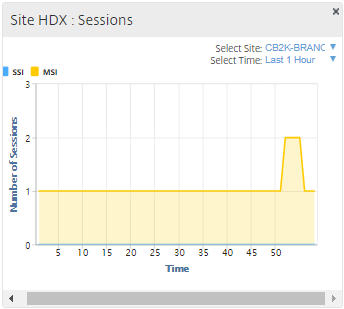
- Site HDX: Sessions
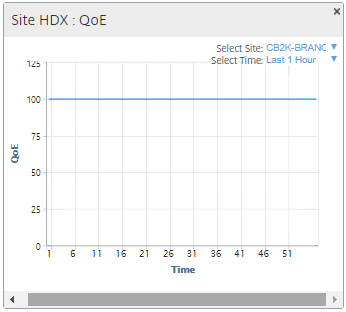
- Site HDX: Quality of Experience
To view HDX QoE statistics, navigate to Dashboard > Default Dashboard >Apps > HDX QoE and in the Region drop-down menu select a region.
Note
Sometimes, the HDX dashboard data and HDX reports from different sites may not seem to be in-sync because each site statistic is polled independently.
On HDX dashboard widgets, you may see a site with no HDX traffic, but there may be a non-zero number of HDX sessions and users. It happens when the HDX sessions remain idle for that polling period and still stay in open state.
Network HDX: Quality summary
The HDX traffic is classified into the following quality categories:
| Quality | QoE Range |
|---|---|
| Good | 80–100 |
| Fair | 50–80 |
| Poor | 0–50 |
| No HDX Traffic | N/A |
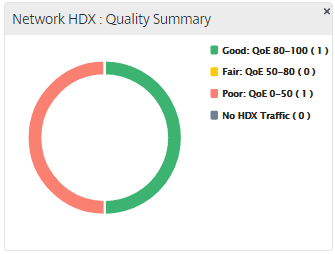
You can click the chart to view HDX reports per site. For more information, see How to View HDX Reports.
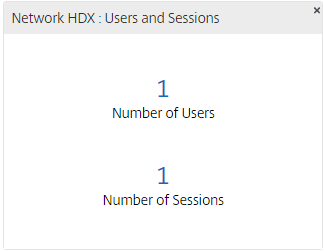
Network HDX: Users and Sessions
This widget provides information on the number of active HDX users and sessions. The number of sessions is the total number of active Single Session ICA (SSI) and Multi-Session ICA (MSI) sessions.
Note
In the current release, the number of users is not based on distinct user names. That is, two sessions started by a single user on two different machines is counted as two users.
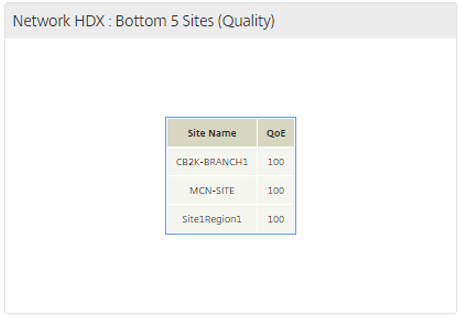
Network HDX: Bottom 5 Sites (Quality)
This widget provides a list of the bottom 5 sites that have the least QoE score. It helps drive better end-user experience initiatives.
Site HDX: Users
This widget provides a graphical representation of the number of users that were active at a particular site for the selected time interval. You can select the site and the time interval as last 24 hours, last 1 hour, or last 5 minutes.
Site HDX: Sessions
This widget provides a graphical representation of the number of MSI and SSI sessions that are active at a particular site for the selected time interval. You can select the site and the time interval as last 24 hours, last 1 hour, or last 5 minutes.
Site HDX: Quality of experience
This widget provides a graphical representation of the overall QoE at a particular site for the selected time interval. You can select the site and the time interval as last 24 hours, last 1 hour, or last 5 minutes.
Application QoE
Application QoE is a measure of Quality of Experience for an application. The Application QoE score range is 0-10, where 10 represents excellent quality and 0 represents poor quality. For more information, see Application QoE. You can view application QoE score for real-time and interactive traffic.
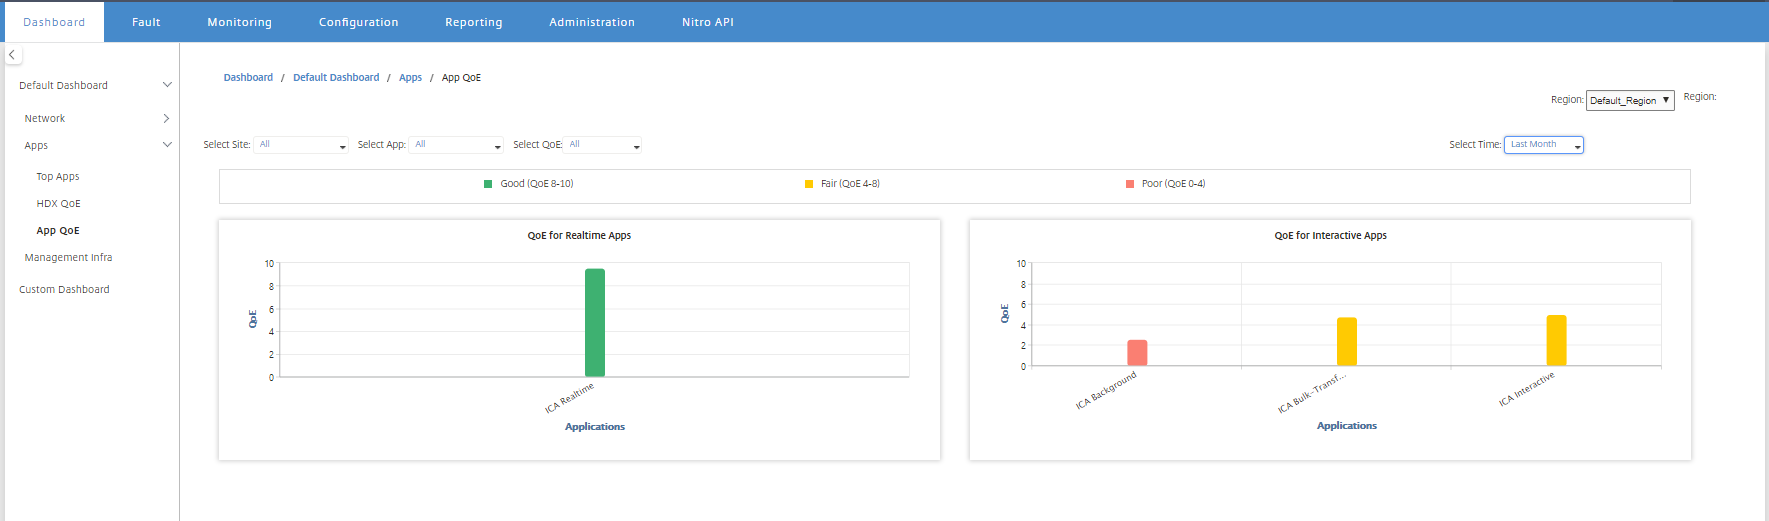
You can filter the application QoE statistics by site, application or QoE type.
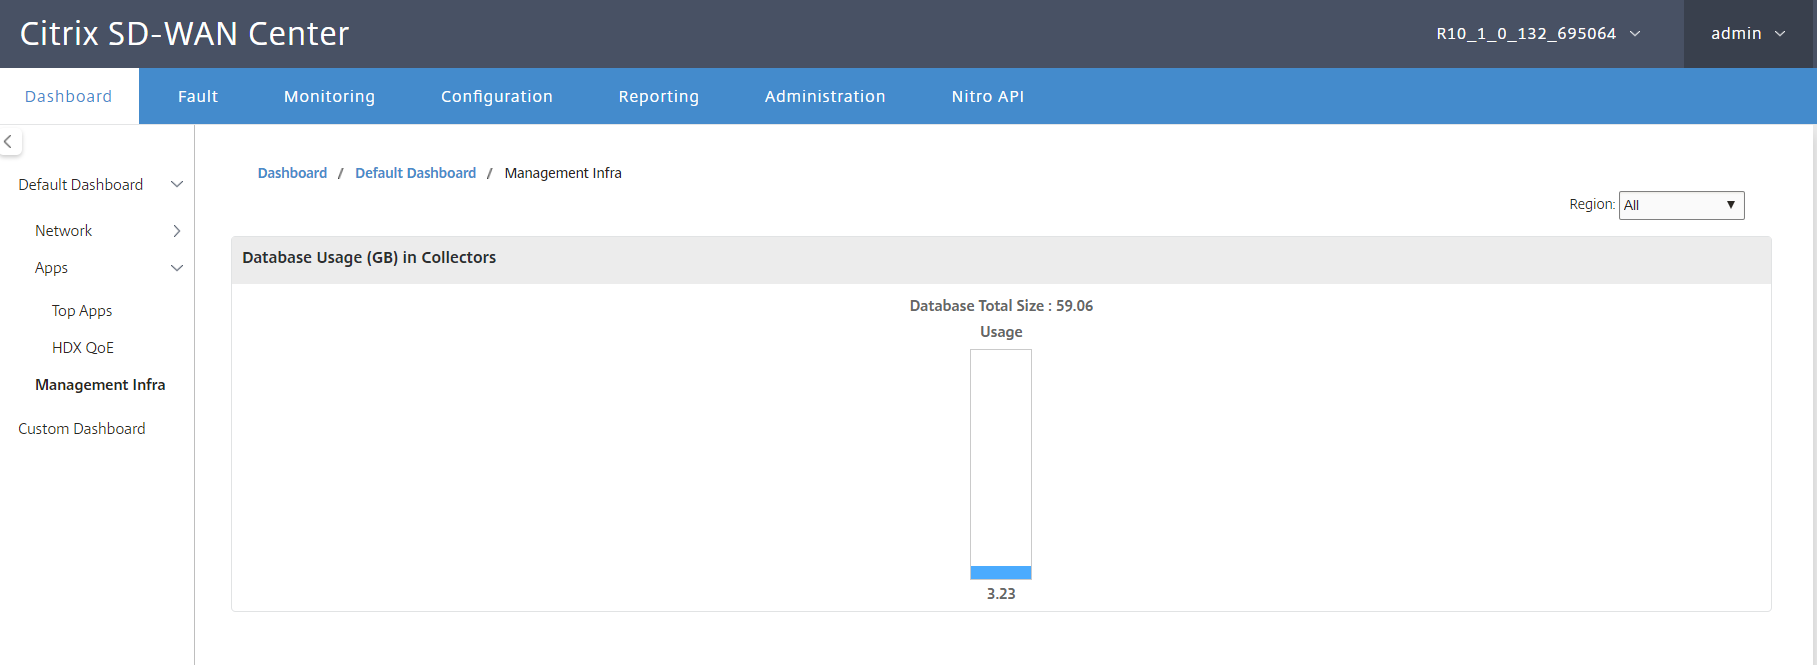
Management infra
The Management Infra page allows you to view the Citrix SD-WAN Center database usage and storage statistics.
For a multi-region deployment, you can view the database usage of all the collectors in the network. To view multi-region database statistics, navigate to Dashboard > Default Dashboard > Management Infra and in the Region drop-down menu select All.
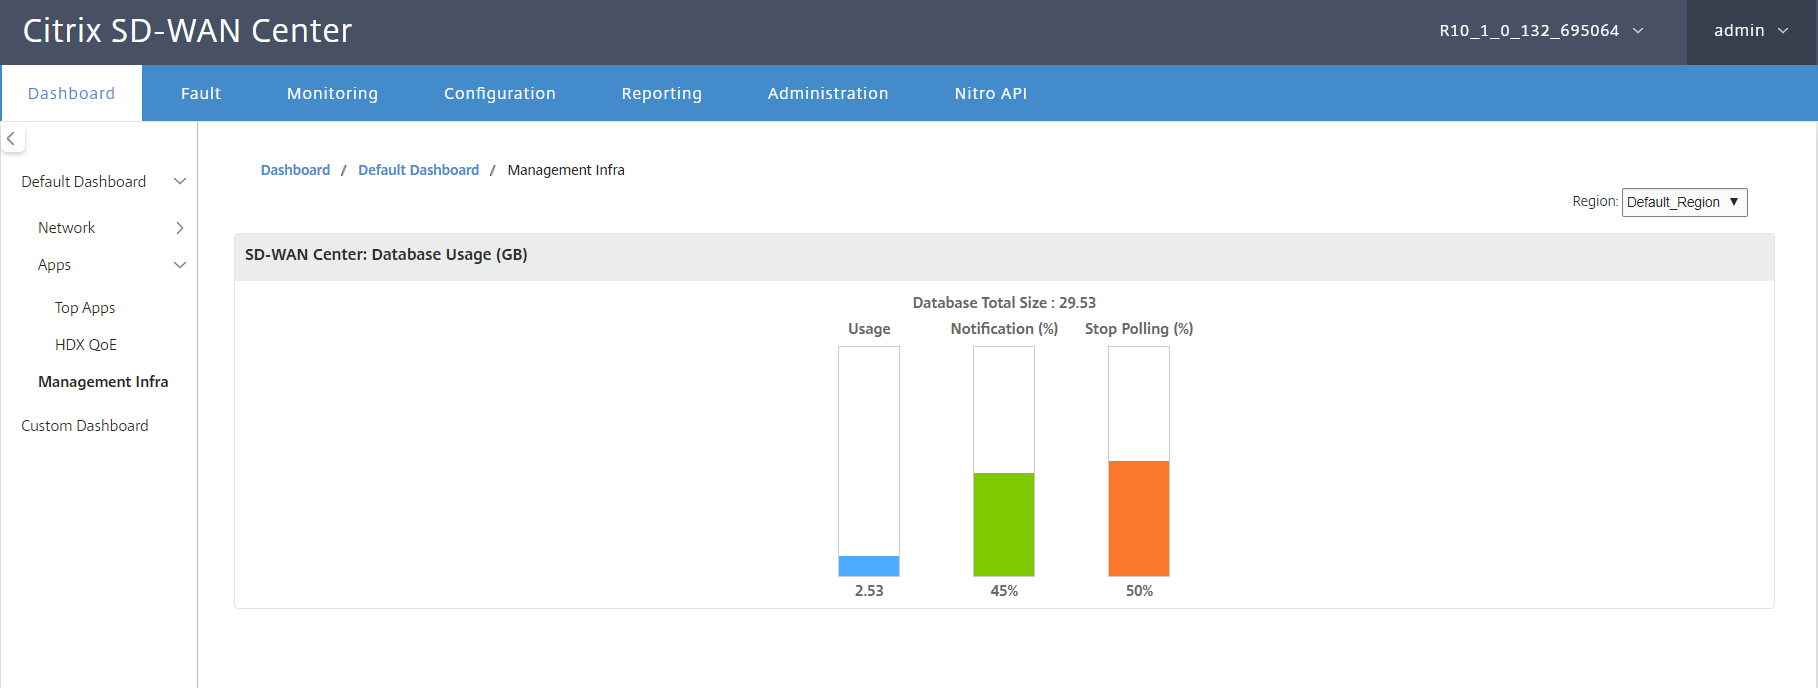
To view Citrix SD-WAN Center database statistics for a particular region, navigate to Dashboard > Default Dashboard > Management Infra, and in the Region drop-down menu select a region.
The Database Usage section displays a graphical overview of the database resource usage and the thresholds for sending notifications, or halting the collection of data. You can click the graph to view the details on the Database Maintenance page.
- Usage: Database capacity currently being used, in GB.
- Notification: Threshold for generating a database usage notification. The threshold is a percentage of the maximum size of the database. If an email alert is configured, an email notification is sent when the size of the database exceeds this threshold. For more information, see Event notifications.
- Stop Polling: Threshold for halting statistics polling. The threshold is a percentage of the maximum size of the database. Polling stops when the size of the database exceeds this threshold. For more information, Manage database.
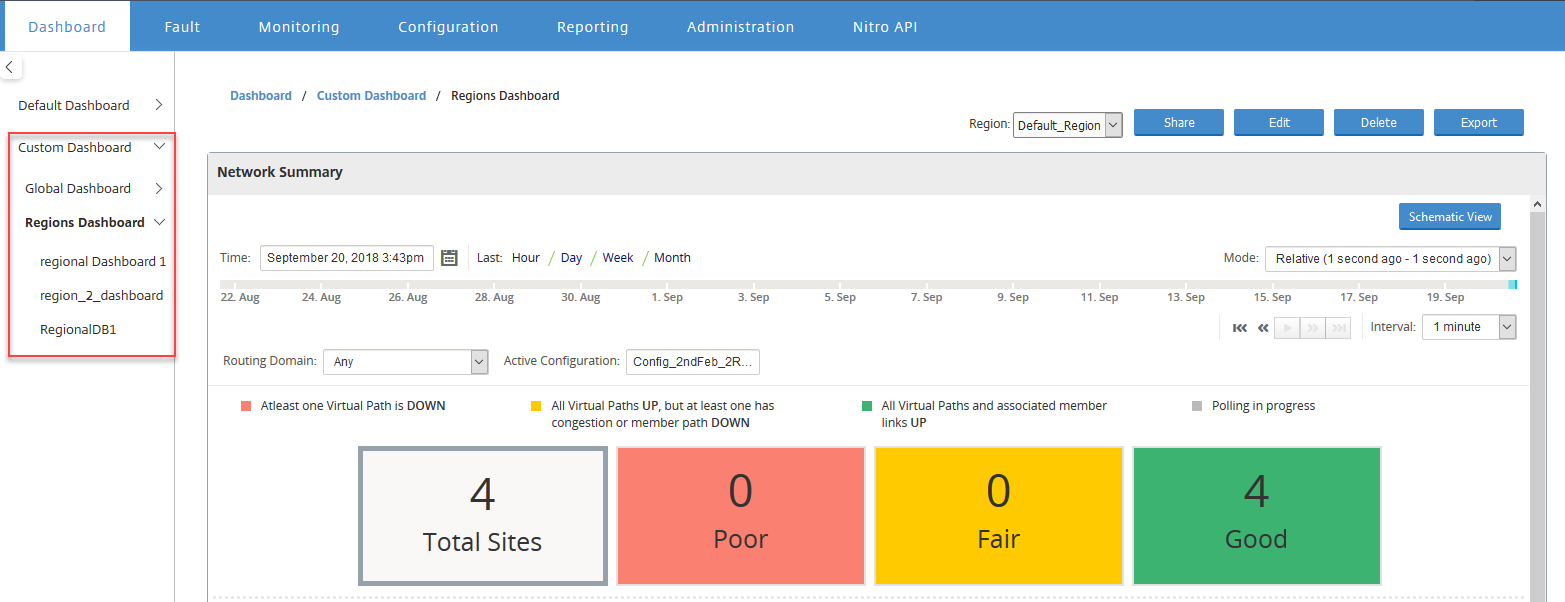
Custom dashboard
You can customize the Citrix SD-WAN Center dashboard and choose the statistics that you want to view on the dashboard based on your analytical needs. Create a custom dashboard of regional details or a global summary. You can also customize an existing report.
Note
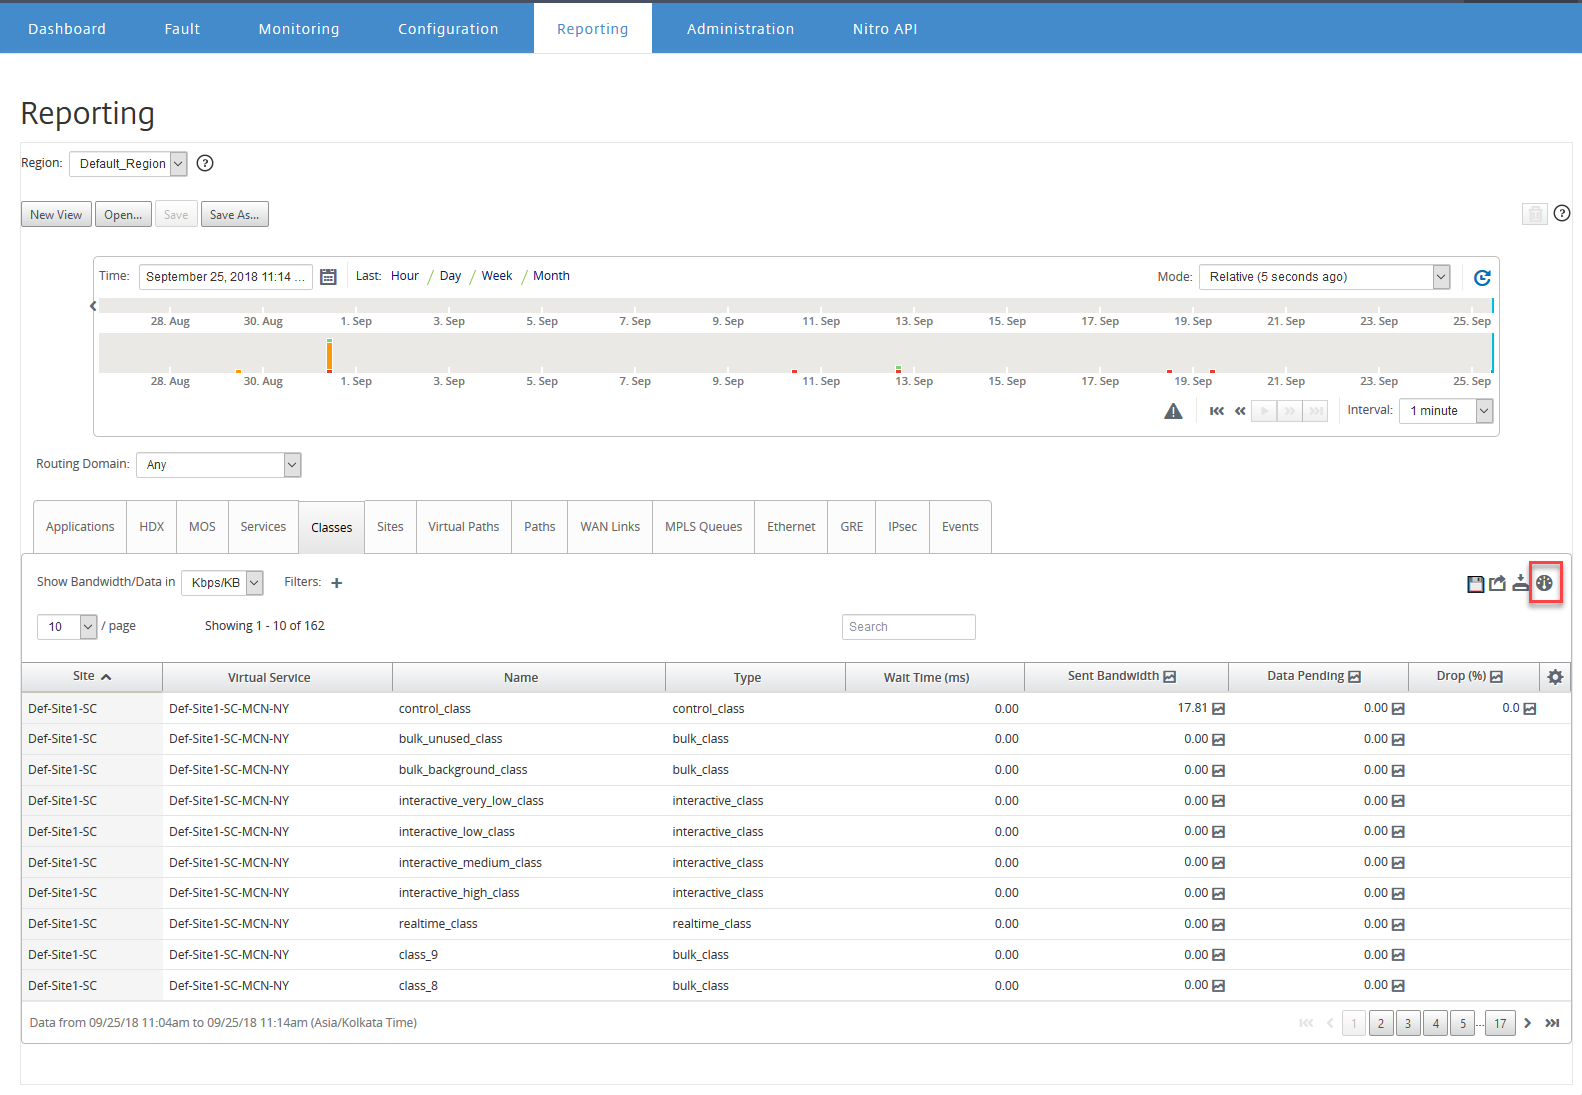
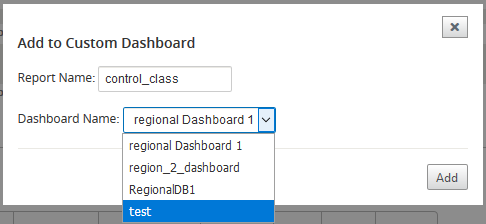
You can now pin a report as widget to your custom dashboard, by using the Add to Dashboard option on the Reports page.
Enter the report name and select the custom dashboard.
For Regional Details custom dashboard, you can choose from the following region level widgets:
- Site Summary
- Virtual Path
- Region Events
- Region Alarm Summary
- Inventory Manager (Per Region)
- Top Sites Per Region
- Paths
- MPLS Queues
- Ethernet
- LAN GRE Tunnels
- IPsec Tunnels
- Service Summary
- Classes
- Site Events
- Top Applications Per Region
- Top Application Family Per Region
- Site HDX: Users
- Site HDX: Sessions
- Site HDX: QoE
- MOS Applications
- Database Usage
For a Global Summary custom dashboard, you can choose from the following network level widgets:
- Multi-region Summary
- Virtual Path Health in Network
- Events
- Alarm Summary
- Inventory Manager
- Top Sites in Network
- Network HDX
- Database Usage in Collectors
- Top Applications
- Top Application Families
To create a custom dashboard:
-
Navigate to Dashboard > Custom Dashboard and click Create Dashboard.
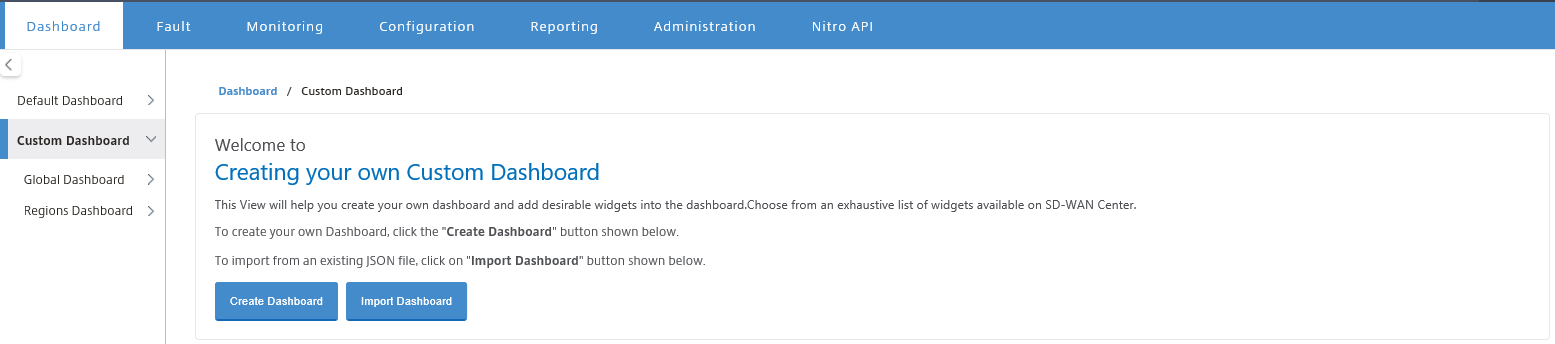
Note
You can also import an existing dashboard in JSON format by clicking Import Dashboard.
-
In the Name field, enter a name for the custom dashboard.
-
Select the widget type. Select Global Summary to view network level widgets, select Regional Details to view regional level widgets.
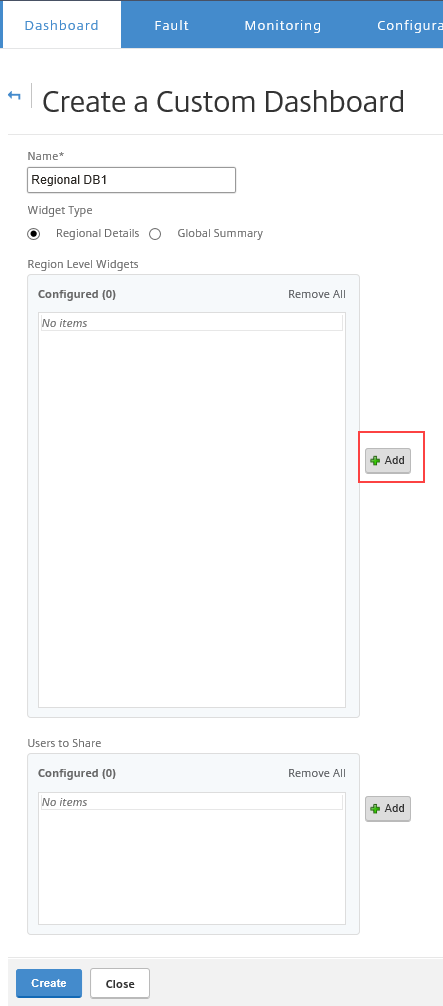
-
Click Add and select the required widgets.
The widgets are categorized into three levels: Network, Apps, and Management Infrastructure.
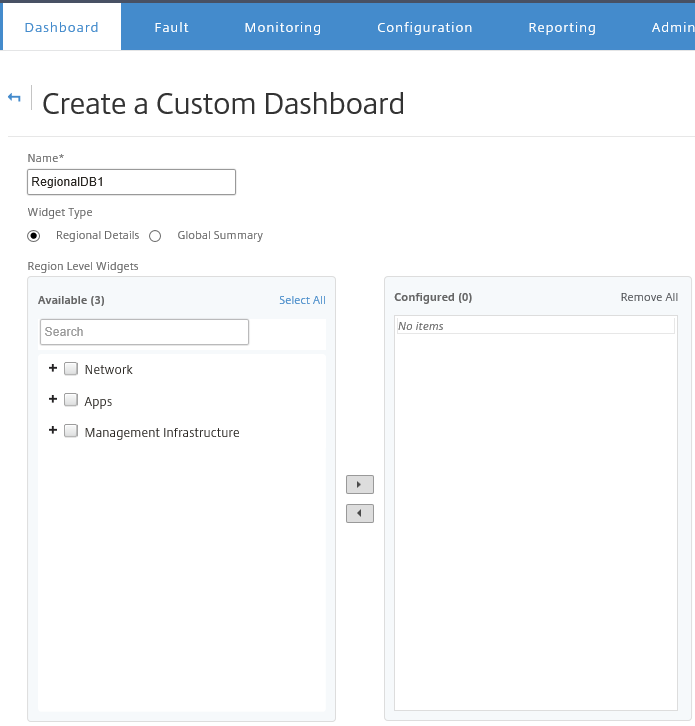
Note
In single-region deployment, only the Region Level Widgets are available.
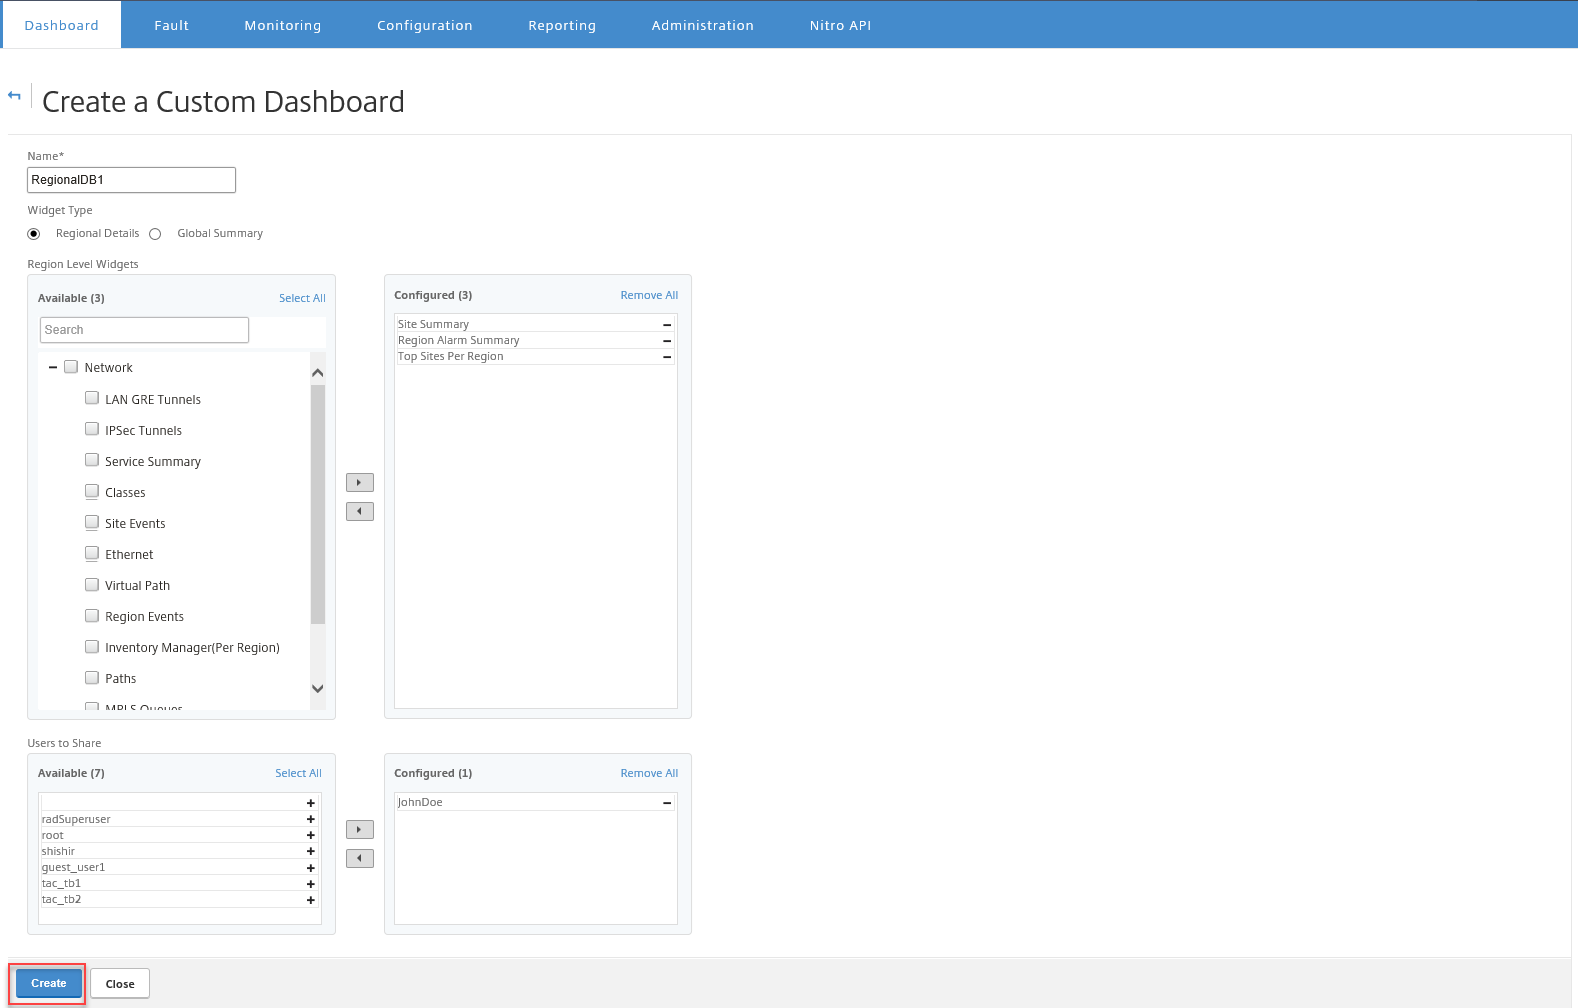
You can also share the custom dashboard with multiple users. For more information on users, see User accounts.
-
Click Create. The newly created custom dashboard is listed under Custom Dashboard.
Tip
You can edit or delete the custom dashboard.