This content has been machine translated dynamically.
Dieser Inhalt ist eine maschinelle Übersetzung, die dynamisch erstellt wurde. (Haftungsausschluss)
Cet article a été traduit automatiquement de manière dynamique. (Clause de non responsabilité)
Este artículo lo ha traducido una máquina de forma dinámica. (Aviso legal)
此内容已经过机器动态翻译。 放弃
このコンテンツは動的に機械翻訳されています。免責事項
이 콘텐츠는 동적으로 기계 번역되었습니다. 책임 부인
Este texto foi traduzido automaticamente. (Aviso legal)
Questo contenuto è stato tradotto dinamicamente con traduzione automatica.(Esclusione di responsabilità))
This article has been machine translated.
Dieser Artikel wurde maschinell übersetzt. (Haftungsausschluss)
Ce article a été traduit automatiquement. (Clause de non responsabilité)
Este artículo ha sido traducido automáticamente. (Aviso legal)
この記事は機械翻訳されています.免責事項
이 기사는 기계 번역되었습니다.책임 부인
Este artigo foi traduzido automaticamente.(Aviso legal)
这篇文章已经过机器翻译.放弃
Questo articolo è stato tradotto automaticamente.(Esclusione di responsabilità))
Translation failed!
Statistics
You can view the statistics collected by Citrix SD-WAN Center as graphs. These graphs are plotted as timeline versus usage, allowing you to understand the usage trends of various network object properties. You can view graphs for network-wide application statistics. For every site in the SD-WAN network, you can view graphs for the following network parameters:
- Bandwidth
- QoS
- Virtual Path
- Internet Services
- Intranet Services
- Pass-through Services
- WAN Links
- Ethernet Interfaces
- GRE Tunnels
- IPsec Tunnels
- Applications
- Application Families
Tip
You can create views as per your requirement, save it and open existing views.
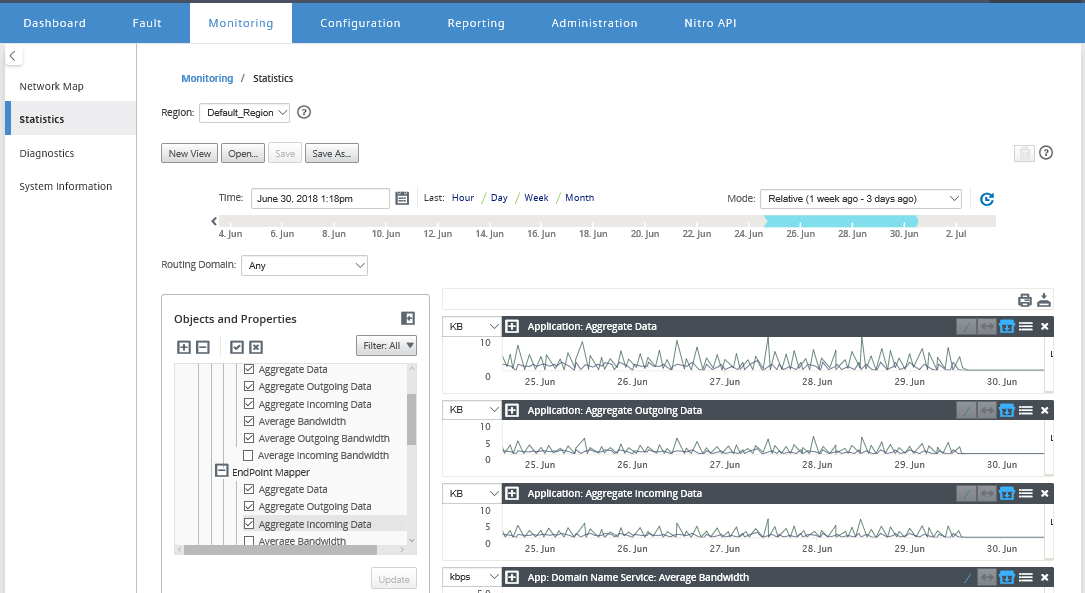
To view statistical graphs:
-
In Citrix SD-WAN Center web UI, navigate to Monitoring > Statistics.
-
Select a region and a routing domain.
-
From the Objects and Properties hierarchical tree, find and select the properties of interest.
Tip
You can also use the Filter drop-down menu and Presets Menu to simplify the process of finding and selecting properties.
-
Click Update to display graphs for the selected properties.
Tip
Deselect a property and click Update to remove the graph for that property from the Graphs Display area.
-
Select a period for the current view. For more information, see Timeline Controls
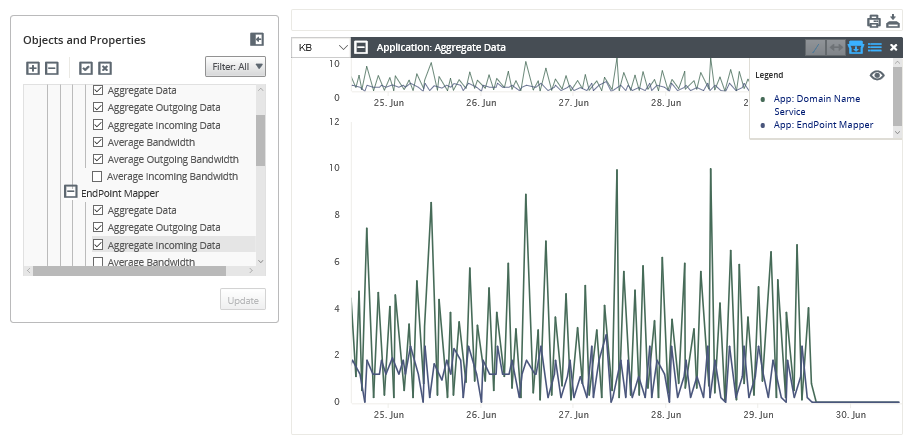
The graphs are displayed based on the selected properties.
Tip
If you select more than one property, the graphs display in Trend View mode to save vertical space. Click on a graph heading to show and hide the fully expanded graph. You can also show and hide the trend view and legends on the graphs.
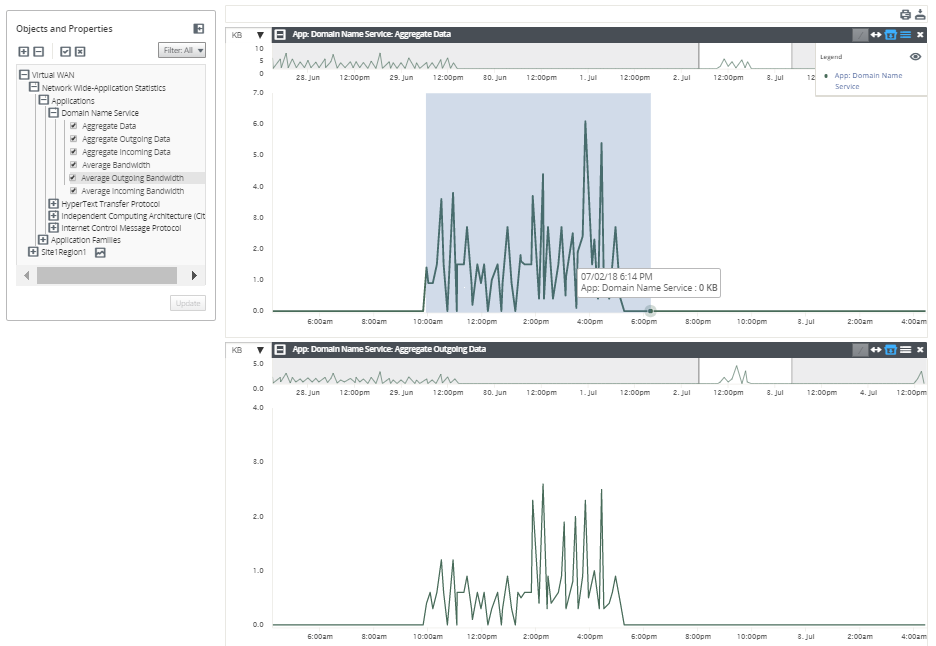
Tip
To zoom a graph, click and drag the graph plot area. Zooming on one graph zooms all graphs, to the selected time, to maintain a consistent view. Click the reset icon (↔) to reset the zoom.
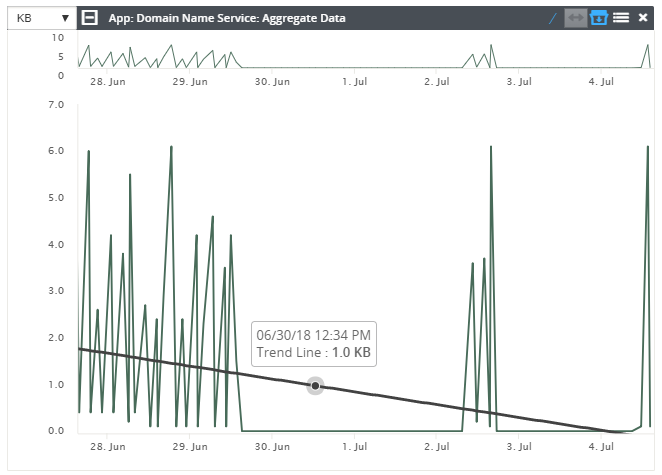
Tip
You can show and hide the trend line by clicking the (/) icon.
Note
You could print the graphs, or download the graph set as a CSV file.
Share
Share
In this article
This Preview product documentation is Cloud Software Group Confidential.
You agree to hold this documentation confidential pursuant to the terms of your Cloud Software Group Beta/Tech Preview Agreement.
The development, release and timing of any features or functionality described in the Preview documentation remains at our sole discretion and are subject to change without notice or consultation.
The documentation is for informational purposes only and is not a commitment, promise or legal obligation to deliver any material, code or functionality and should not be relied upon in making Cloud Software Group product purchase decisions.
If you do not agree, select I DO NOT AGREE to exit.