Reporting
Citrix SD-WAN Center provides the following reports:
- Applications: Displays details about incoming traffic, outgoing traffic and total traffic of the top applications, sites, and application families.
- HDX: Displays detailed HDX data for every site.
- Sites: Displays site level statistics for every site in the Virtual WAN. Sites rows expand to show the Services table filtered for the Site.
- Service: Displays summary statistics by service type (Virtual Path, Internet, Intranet and Pass-through) for every site in the Virtual WAN. Services rows expand to show the individual Services for the Service type.
- Virtual Paths: Displays Virtual Path level statistics for every Virtual Path in the SD-WAN. Virtual Paths rows expand to show the Paths contained within the Virtual Path.
Note
Virtual Path data is recorded from the perspective of both endpoints, as such, each Virtual Path may have two rows identified by the Site that recorded the statistics.
- Paths: Displays Path level statistics for every Path in the Virtual WAN.
- WAN Links: Displays WAN Link level statistics for every WAN Link at each Site in the Virtual WAN. WAN Links rows expand to show a Usage Summary for each Service type for that WAN Link. Each Service type row will then expand to show usages for each Service of that type. If the WAN Link is a Private MPLS link, a second table will be shown showing the MPLS Queues for the WAN Link.
- MPLS Queues: The MPLS Queues rows expand to show a usage summary for each Service type for that Queue. Each Service type row will then expand to show usages for each Service of that type.
- Classes: Displays Class level statistics for every Class for each Virtual Path in the Virtual WAN.
- MOS Score: The mean opinion score (MOS) provides a numerical measure of the quality of the experience that an application delivers to end users.
- Ethernet Interfaces: Displays Ethernet Interface level statistics for every Interface at each Site in the Virtual WAN.
- GRE Tunnels: Displays statistics of every LAN GRE tunnel at each site in the WAN.
- IPsec Tunnels: Displays statistics of every IP security tunnel at each site in the WAN.
- Events: Displays summary counts of events occurring at each Site in the Virtual WAN. Events rows expand to show summary counts by Object Type for that Site. Each Object Type will then expand to show summary counts for each Object of that type.
On the Reporting tab of the Citrix SD-WAN Center web interface, you can view all reports or selected reports. You can also download reports.
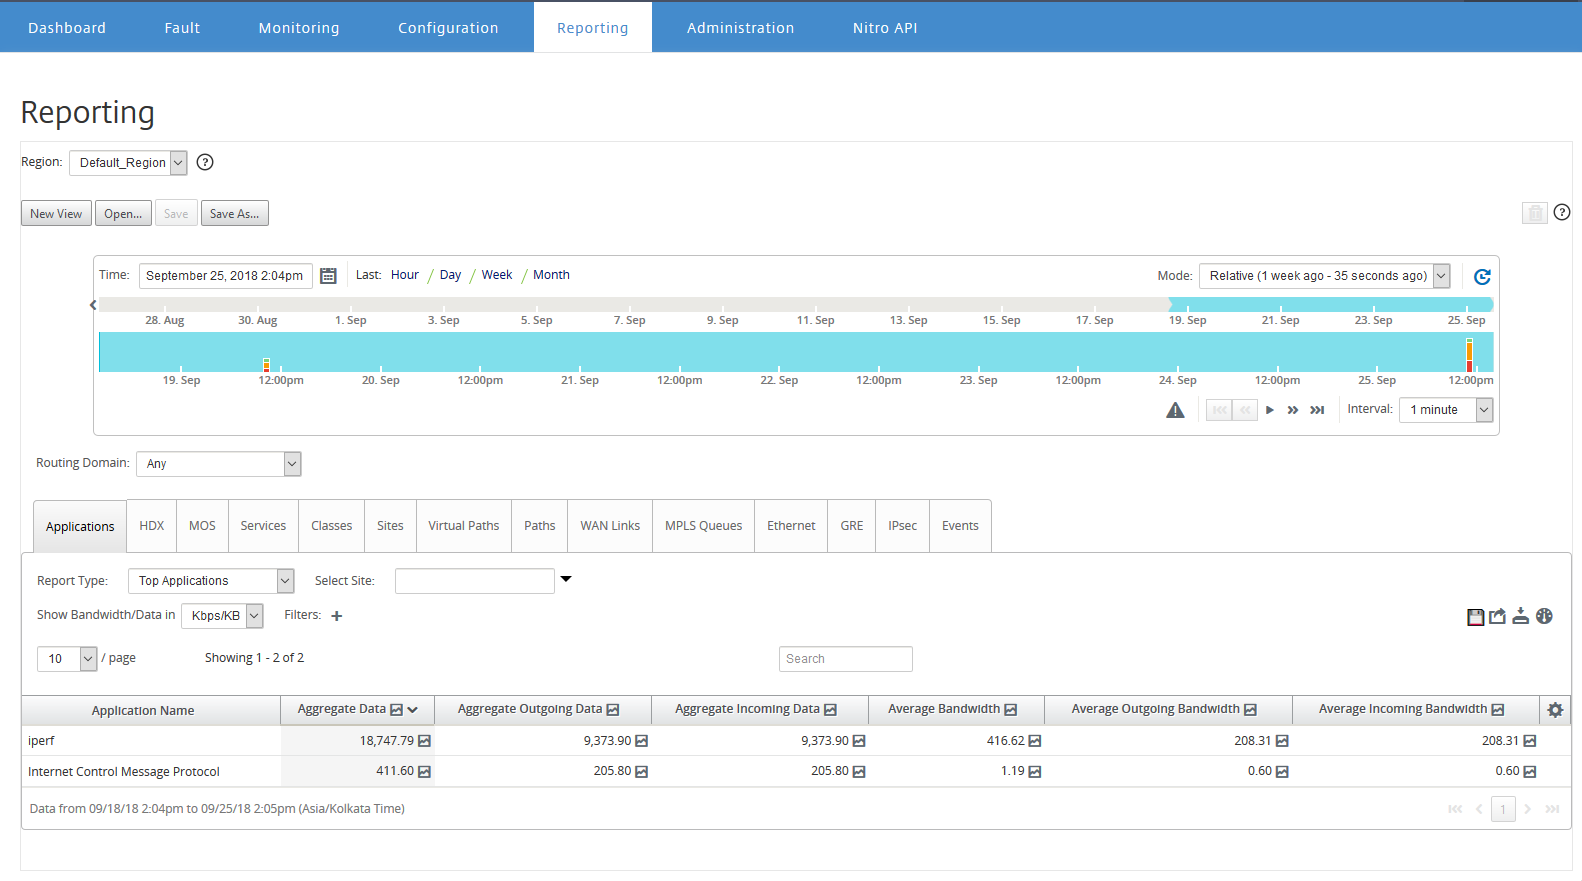
You can select and view reports of a particular time frame by using the timeline controls. For more information, see, Timeline controls.
You can also create, save and open report views. For more information, see, Manage views.
For Multi-region network, you can select specific regions to view statistic reports.
The reports data is fetched from the respective region’s collector.
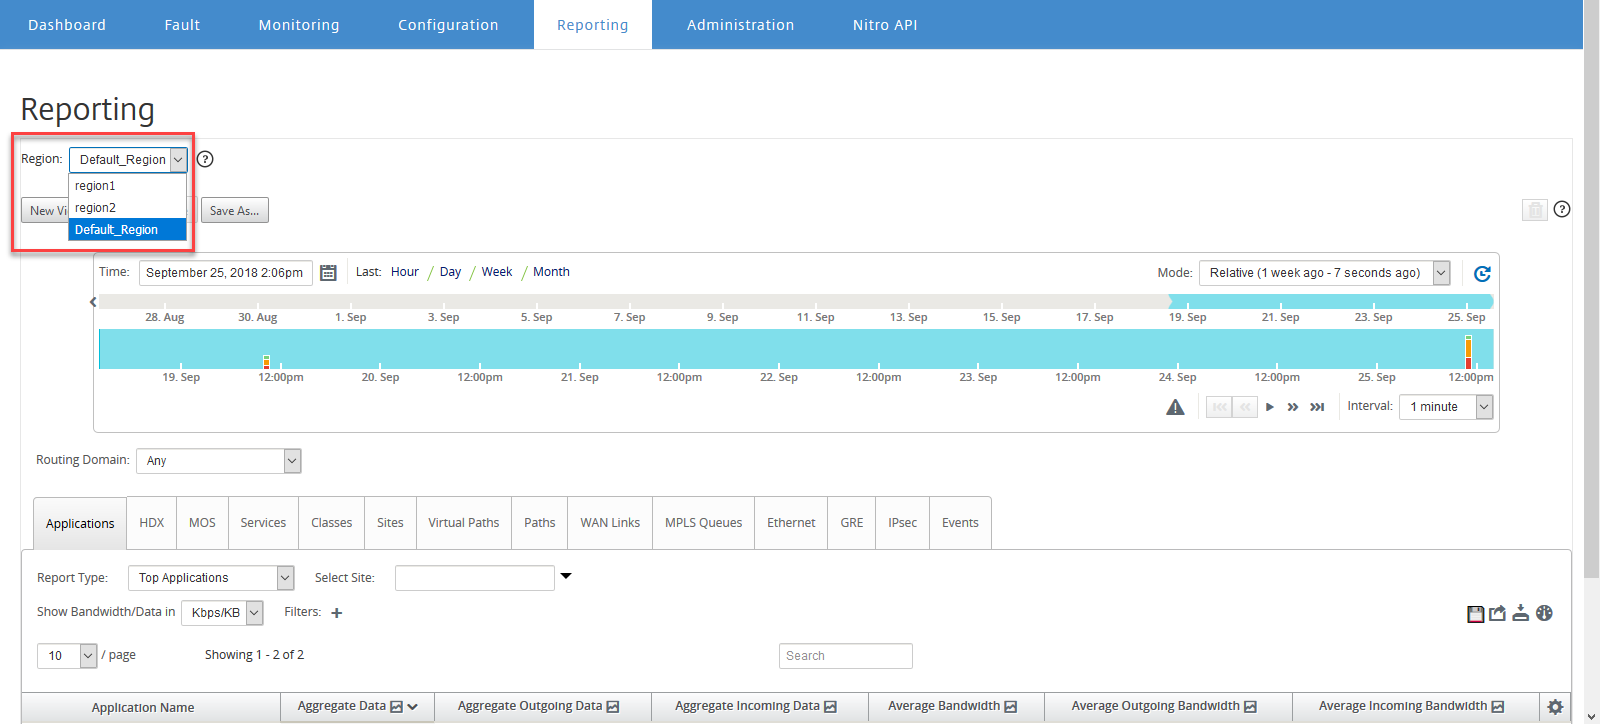
Note
In single-region network deployment, the Region drop-down list is not available.
For more details on viewing different reports, see the following topics: