This content has been machine translated dynamically.
Dieser Inhalt ist eine maschinelle Übersetzung, die dynamisch erstellt wurde. (Haftungsausschluss)
Cet article a été traduit automatiquement de manière dynamique. (Clause de non responsabilité)
Este artículo lo ha traducido una máquina de forma dinámica. (Aviso legal)
此内容已经过机器动态翻译。 放弃
このコンテンツは動的に機械翻訳されています。免責事項
이 콘텐츠는 동적으로 기계 번역되었습니다. 책임 부인
Este texto foi traduzido automaticamente. (Aviso legal)
Questo contenuto è stato tradotto dinamicamente con traduzione automatica.(Esclusione di responsabilità))
This article has been machine translated.
Dieser Artikel wurde maschinell übersetzt. (Haftungsausschluss)
Ce article a été traduit automatiquement. (Clause de non responsabilité)
Este artículo ha sido traducido automáticamente. (Aviso legal)
この記事は機械翻訳されています.免責事項
이 기사는 기계 번역되었습니다.책임 부인
Este artigo foi traduzido automaticamente.(Aviso legal)
这篇文章已经过机器翻译.放弃
Questo articolo è stato tradotto automaticamente.(Esclusione di responsabilità))
Translation failed!
Event report
You can view counts of different events occurring at each site in the SD-WAN network.
For more information about events, see Events.
To view event statistics:
In Citrix SD-WAN Center, navigate to Reports > Events, and in the timeline control select a time period.
You can select and view reports of a particular time frame by using the timeline controls. For more information, see, Timeline controls.
You can also create, save and open report views. For more information, see, Manage views.
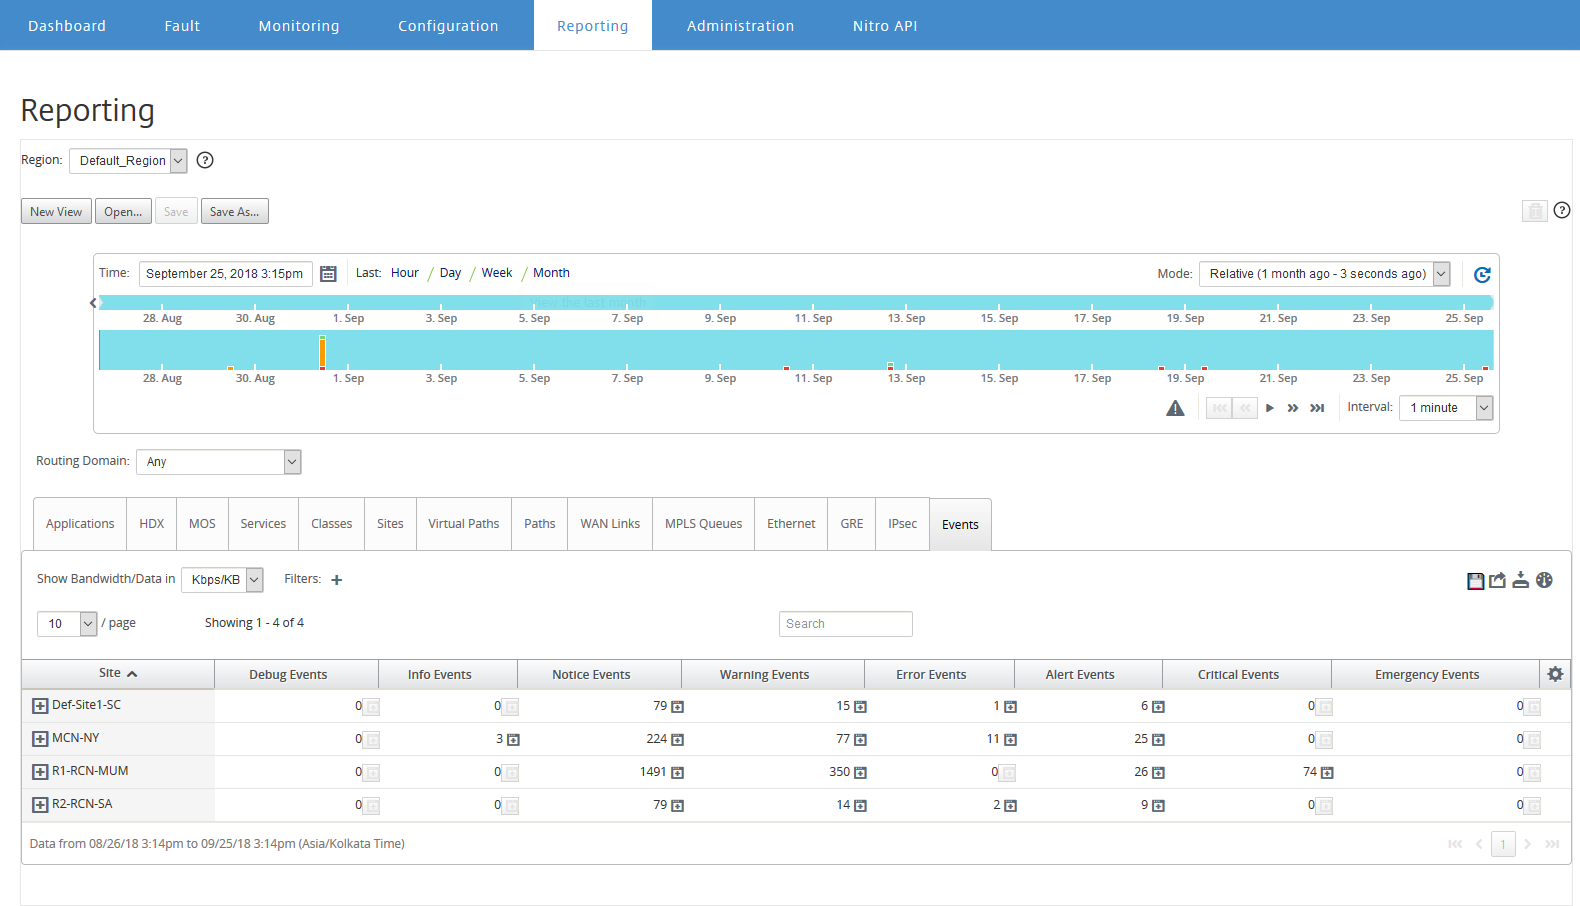
You can view the following metrics:
- Info Events: Number of information events that occurred during the selected time period. These are low-level events.
- Notice Events: Number of notice events that occurred during the selected time period. These are events that the administrator should know about.
- Warning Events: Number of warning events that occurred during the selected time period. These are events that require action in the near future.
- Error Events: Number of error events that occurred during the selected time period. These are events that indicate some type of error.
- Alert Events: Number of alert events that occurred during the selected time period. These are events that might require action.
- Critical Events: Number of critical events that occurred during the selected time period. These are events that indicate an imminent crisis.
- Emergency Events: Number of emergency events that occurred during the selected time period. These are events that indicate an immediate crisis (for example, power supply failure, fan failure, hard disk threshold exceeded, service disabled).
- Debug Events: Number of debugging events that occurred during the selected time period. Debug events are generated when Test Email or Test Syslog options are used on the Citrix SD-WAN appliances.
Note
Click the settings icon to select the metrics that you want to view.
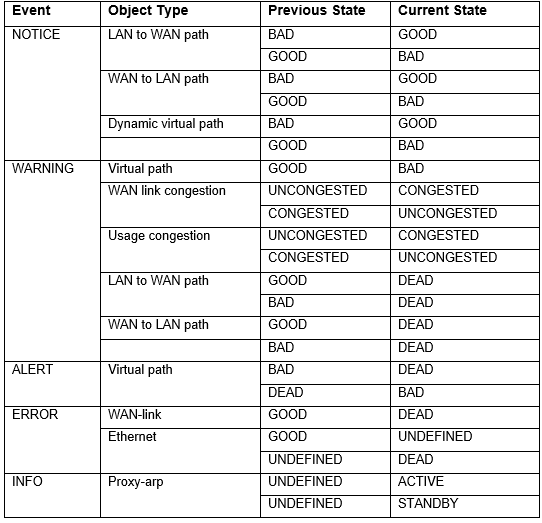
The following table lists a few examples of the state changes of objects for which events are reported.
You can configure Citrix SD-WAN Center to send external event notifications for different event types as email, SNMP traps or syslog messages. For more information, see Event notifications.
Share
Share
In this article
This Preview product documentation is Cloud Software Group Confidential.
You agree to hold this documentation confidential pursuant to the terms of your Cloud Software Group Beta/Tech Preview Agreement.
The development, release and timing of any features or functionality described in the Preview documentation remains at our sole discretion and are subject to change without notice or consultation.
The documentation is for informational purposes only and is not a commitment, promise or legal obligation to deliver any material, code or functionality and should not be relied upon in making Cloud Software Group product purchase decisions.
If you do not agree, select I DO NOT AGREE to exit.