This content has been machine translated dynamically.
Dieser Inhalt ist eine maschinelle Übersetzung, die dynamisch erstellt wurde. (Haftungsausschluss)
Cet article a été traduit automatiquement de manière dynamique. (Clause de non responsabilité)
Este artículo lo ha traducido una máquina de forma dinámica. (Aviso legal)
此内容已经过机器动态翻译。 放弃
このコンテンツは動的に機械翻訳されています。免責事項
이 콘텐츠는 동적으로 기계 번역되었습니다. 책임 부인
Este texto foi traduzido automaticamente. (Aviso legal)
Questo contenuto è stato tradotto dinamicamente con traduzione automatica.(Esclusione di responsabilità))
This article has been machine translated.
Dieser Artikel wurde maschinell übersetzt. (Haftungsausschluss)
Ce article a été traduit automatiquement. (Clause de non responsabilité)
Este artículo ha sido traducido automáticamente. (Aviso legal)
この記事は機械翻訳されています.免責事項
이 기사는 기계 번역되었습니다.책임 부인
Este artigo foi traduzido automaticamente.(Aviso legal)
这篇文章已经过机器翻译.放弃
Questo articolo è stato tradotto automaticamente.(Esclusione di responsabilità))
Translation failed!
Class report
The virtual services can be assigned to particular QoS classes, and different bandwidth restraints can be applied to different classes. A class can be one of three basic types:
- Real-time classes: Serve traffic flows that demand prompt service up to a certain bandwidth limit. Low latency is preferred over aggregate throughput.
- Interactive classes: Serve traffic flows that are sensitive to loss and latency. Interactive classes have lower priority than real-time but have absolute priority over bulk traffic.
- Bulk classes: Serve traffic flows that require high bandwidth and are sensitive to loss. Bulk classes have the lowest priority.
Specifying different bandwidth requirements for different classes enables the virtual path scheduler to arbitrate competing bandwidth requests from multiple classes of the same type. The scheduler uses the Hierarchical Fair Service Curve (HFSC) algorithm to achieve fairness among the classes.
For more information about customizing classes, see Customizing Classes.
To view class statistics:
In Citrix SD-WAN Center, navigate to Reports > Classes, and in the timeline control select a time period.
You can select and view reports of a particular period by using the timeline controls. For more information, see, Timeline controls.
Note
You can view the Class data of last 30 days. Any data beyond this period is automatically removed from the SD-WAN Center collector and the respective regional collectors.
You can also create, save and open report views. For more information, see, Manage views.
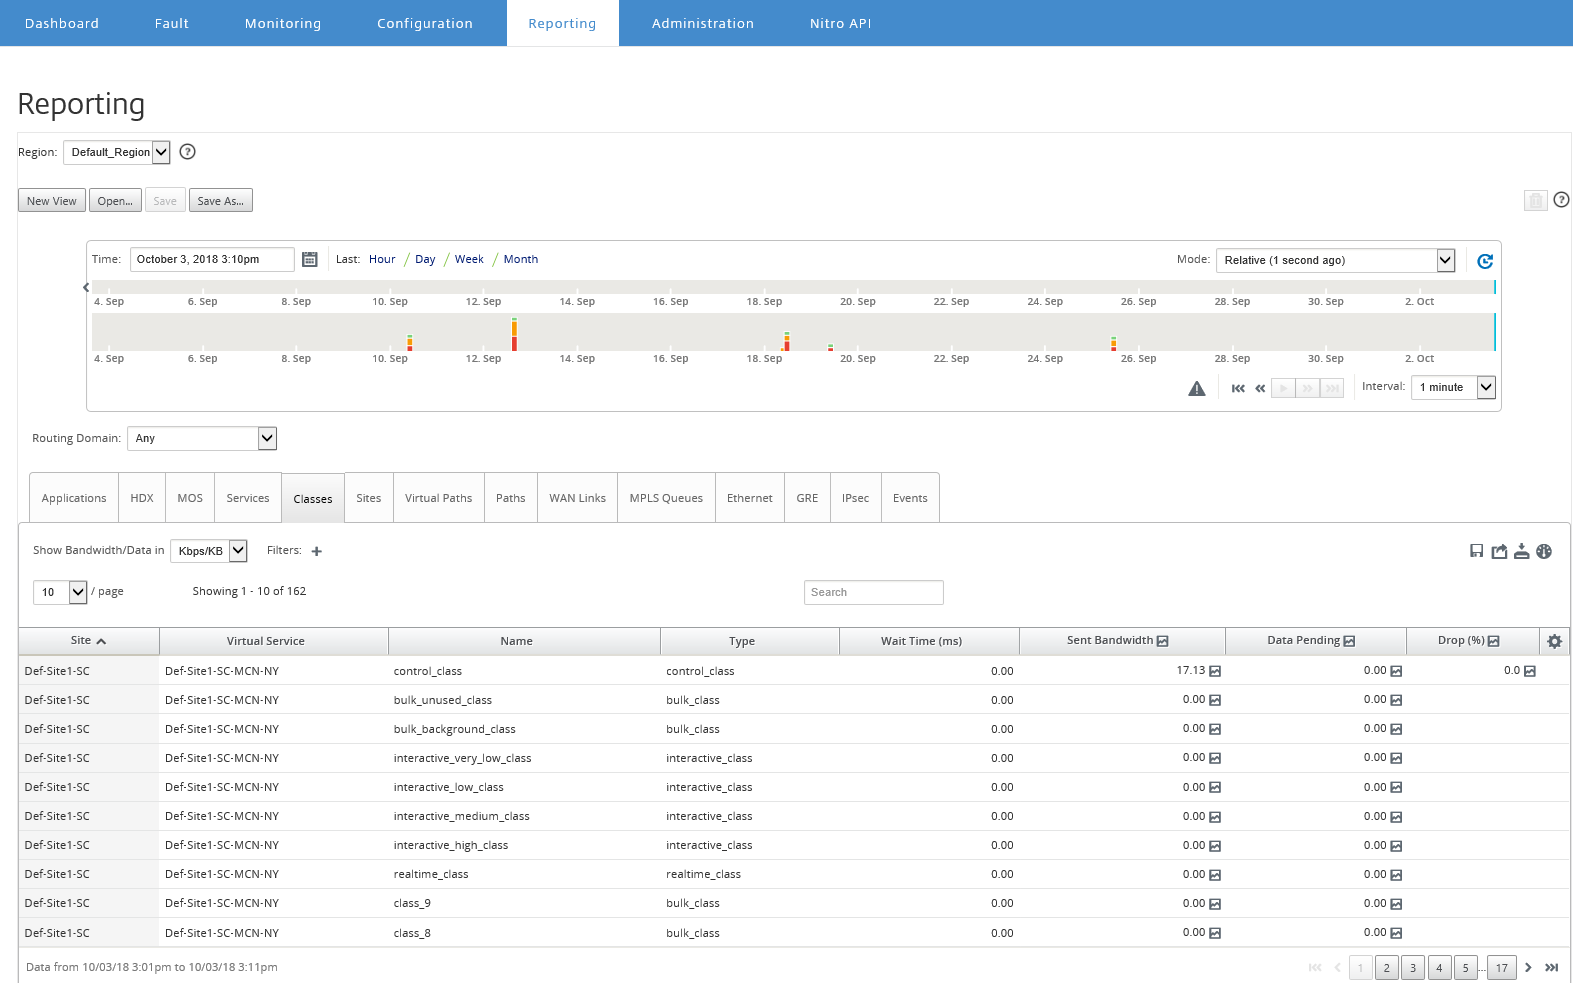
You can view the following metrics:
- Name: Class name
- Type: Class Type. Releatime, interactive, or bulk.
- Wait Time: The time interval between transmitting packets in milliseconds.
- Sent Bandwidth: Transmitted bandwidth
- Data Sent: Data sent, in Kbps.
- Packets Sent: Number of packets sent.
- Data Pending: Data to be sent, in Kbps.
- Packets Pending: Number of packets to be sent.
- Drop: Percentage of data dropped.
- Data Dropped: Data dropped, in Kbps.
- Packets Dropped: Number of packets dropped, because of network congestion.
- Data Coverage: Percentage of the selected period for which data is available.
Note
Click the settings icon to select the metrics that you want to view.
In this article
This Preview product documentation is Cloud Software Group Confidential.
You agree to hold this documentation confidential pursuant to the terms of your Cloud Software Group Beta/Tech Preview Agreement.
The development, release and timing of any features or functionality described in the Preview documentation remains at our sole discretion and are subject to change without notice or consultation.
The documentation is for informational purposes only and is not a commitment, promise or legal obligation to deliver any material, code or functionality and should not be relied upon in making Cloud Software Group product purchase decisions.
If you do not agree, select I DO NOT AGREE to exit.