-
-
-
Site dashboard
This content has been machine translated dynamically.
Dieser Inhalt ist eine maschinelle Übersetzung, die dynamisch erstellt wurde. (Haftungsausschluss)
Cet article a été traduit automatiquement de manière dynamique. (Clause de non responsabilité)
Este artículo lo ha traducido una máquina de forma dinámica. (Aviso legal)
此内容已经过机器动态翻译。 放弃
このコンテンツは動的に機械翻訳されています。免責事項
이 콘텐츠는 동적으로 기계 번역되었습니다. 책임 부인
Este texto foi traduzido automaticamente. (Aviso legal)
Questo contenuto è stato tradotto dinamicamente con traduzione automatica.(Esclusione di responsabilità))
This article has been machine translated.
Dieser Artikel wurde maschinell übersetzt. (Haftungsausschluss)
Ce article a été traduit automatiquement. (Clause de non responsabilité)
Este artículo ha sido traducido automáticamente. (Aviso legal)
この記事は機械翻訳されています.免責事項
이 기사는 기계 번역되었습니다.책임 부인
Este artigo foi traduzido automaticamente.(Aviso legal)
这篇文章已经过机器翻译.放弃
Questo articolo è stato tradotto automaticamente.(Esclusione di responsabilità))
Translation failed!
Site dashboard
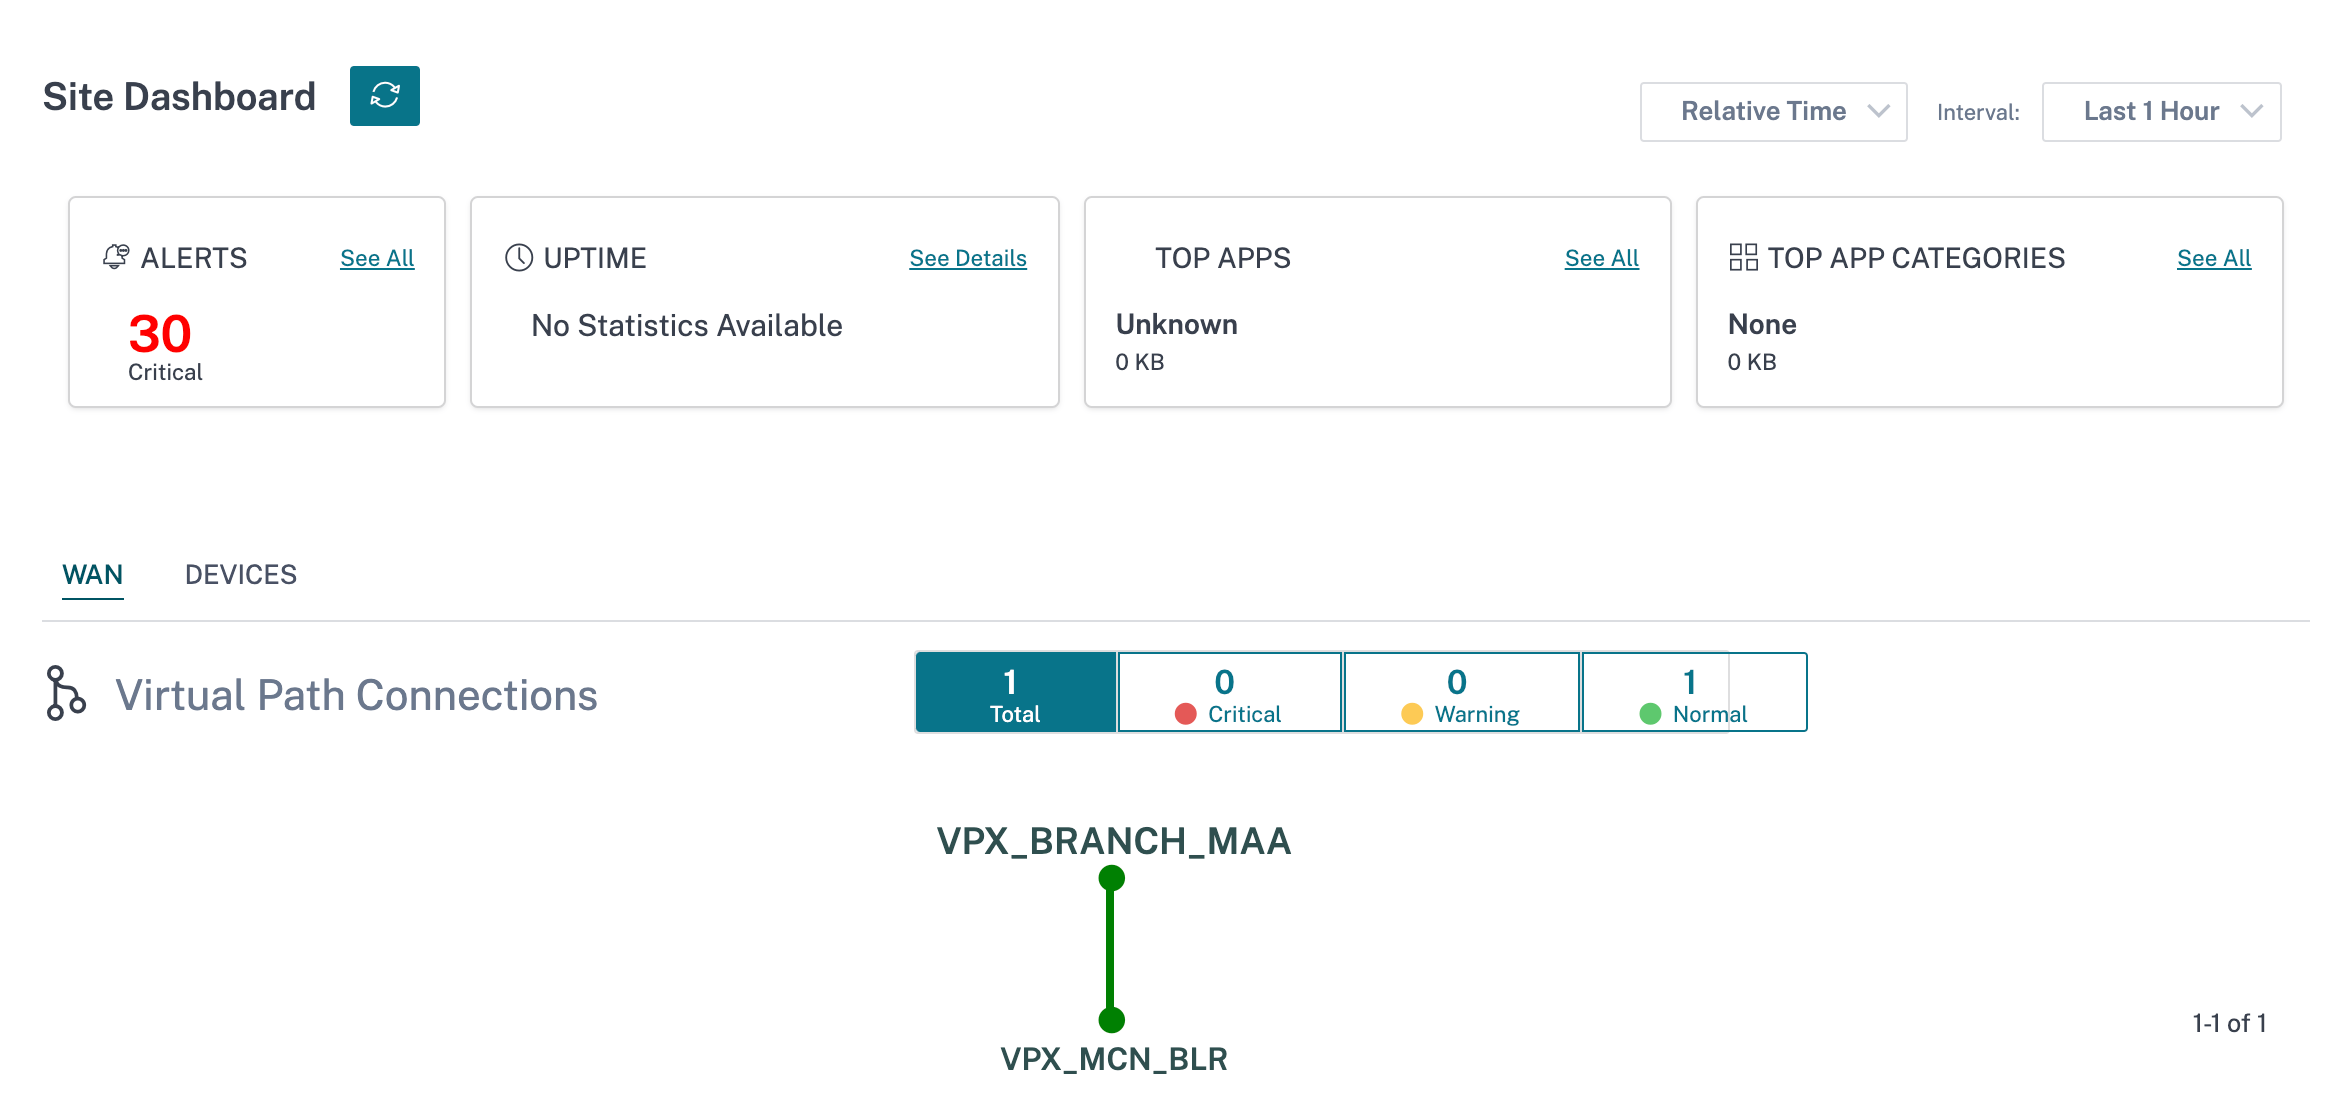
The Site Dashboard provides an overview of a site’s health and usage trends.
The dashboard summarizes the following aspects of a site, with a provision to drill down for more details.
- Critical Alerts: Running count of the critical health alerts, if any, popping up on the site.
- Uptime: Side-by-side comparison of the average uptime offered by the SD-WAN virtual overlay paths v/s the physical underlay paths, associated with a site
- Usage Trends: Top Apps and App Categories associated with a site, based on traffic volume
- Site Details: WAN Connections, and Devices associated with a site
Tip
Click See All or See Details to view statistics that are more detailed.
All the overlay virtual path connections associated with a site are displayed with suitable color-coding to reflect the health of each connection.
You can select any virtual path connection, to review the corresponding health metrics and trends.
The color-coding criteria used for virtual path connections are:
- Critical (Red): Virtual path is DOWN.
- Warning (Orange): Virtual path is UP, but at least one member path is DOWN.
- Normal (Green): Virtual path and all member paths are UP.
Health metrics
Health metrics and graphical trends around availability, latency, loss, jitter, and throughput are displayed for the selected virtual path connection. These statistics are available in both the directions: WAN to LAN and LAN to WAN. All the metrics can be reviewed against a common timeline, to help quickly narrow down the problem domain while troubleshooting.
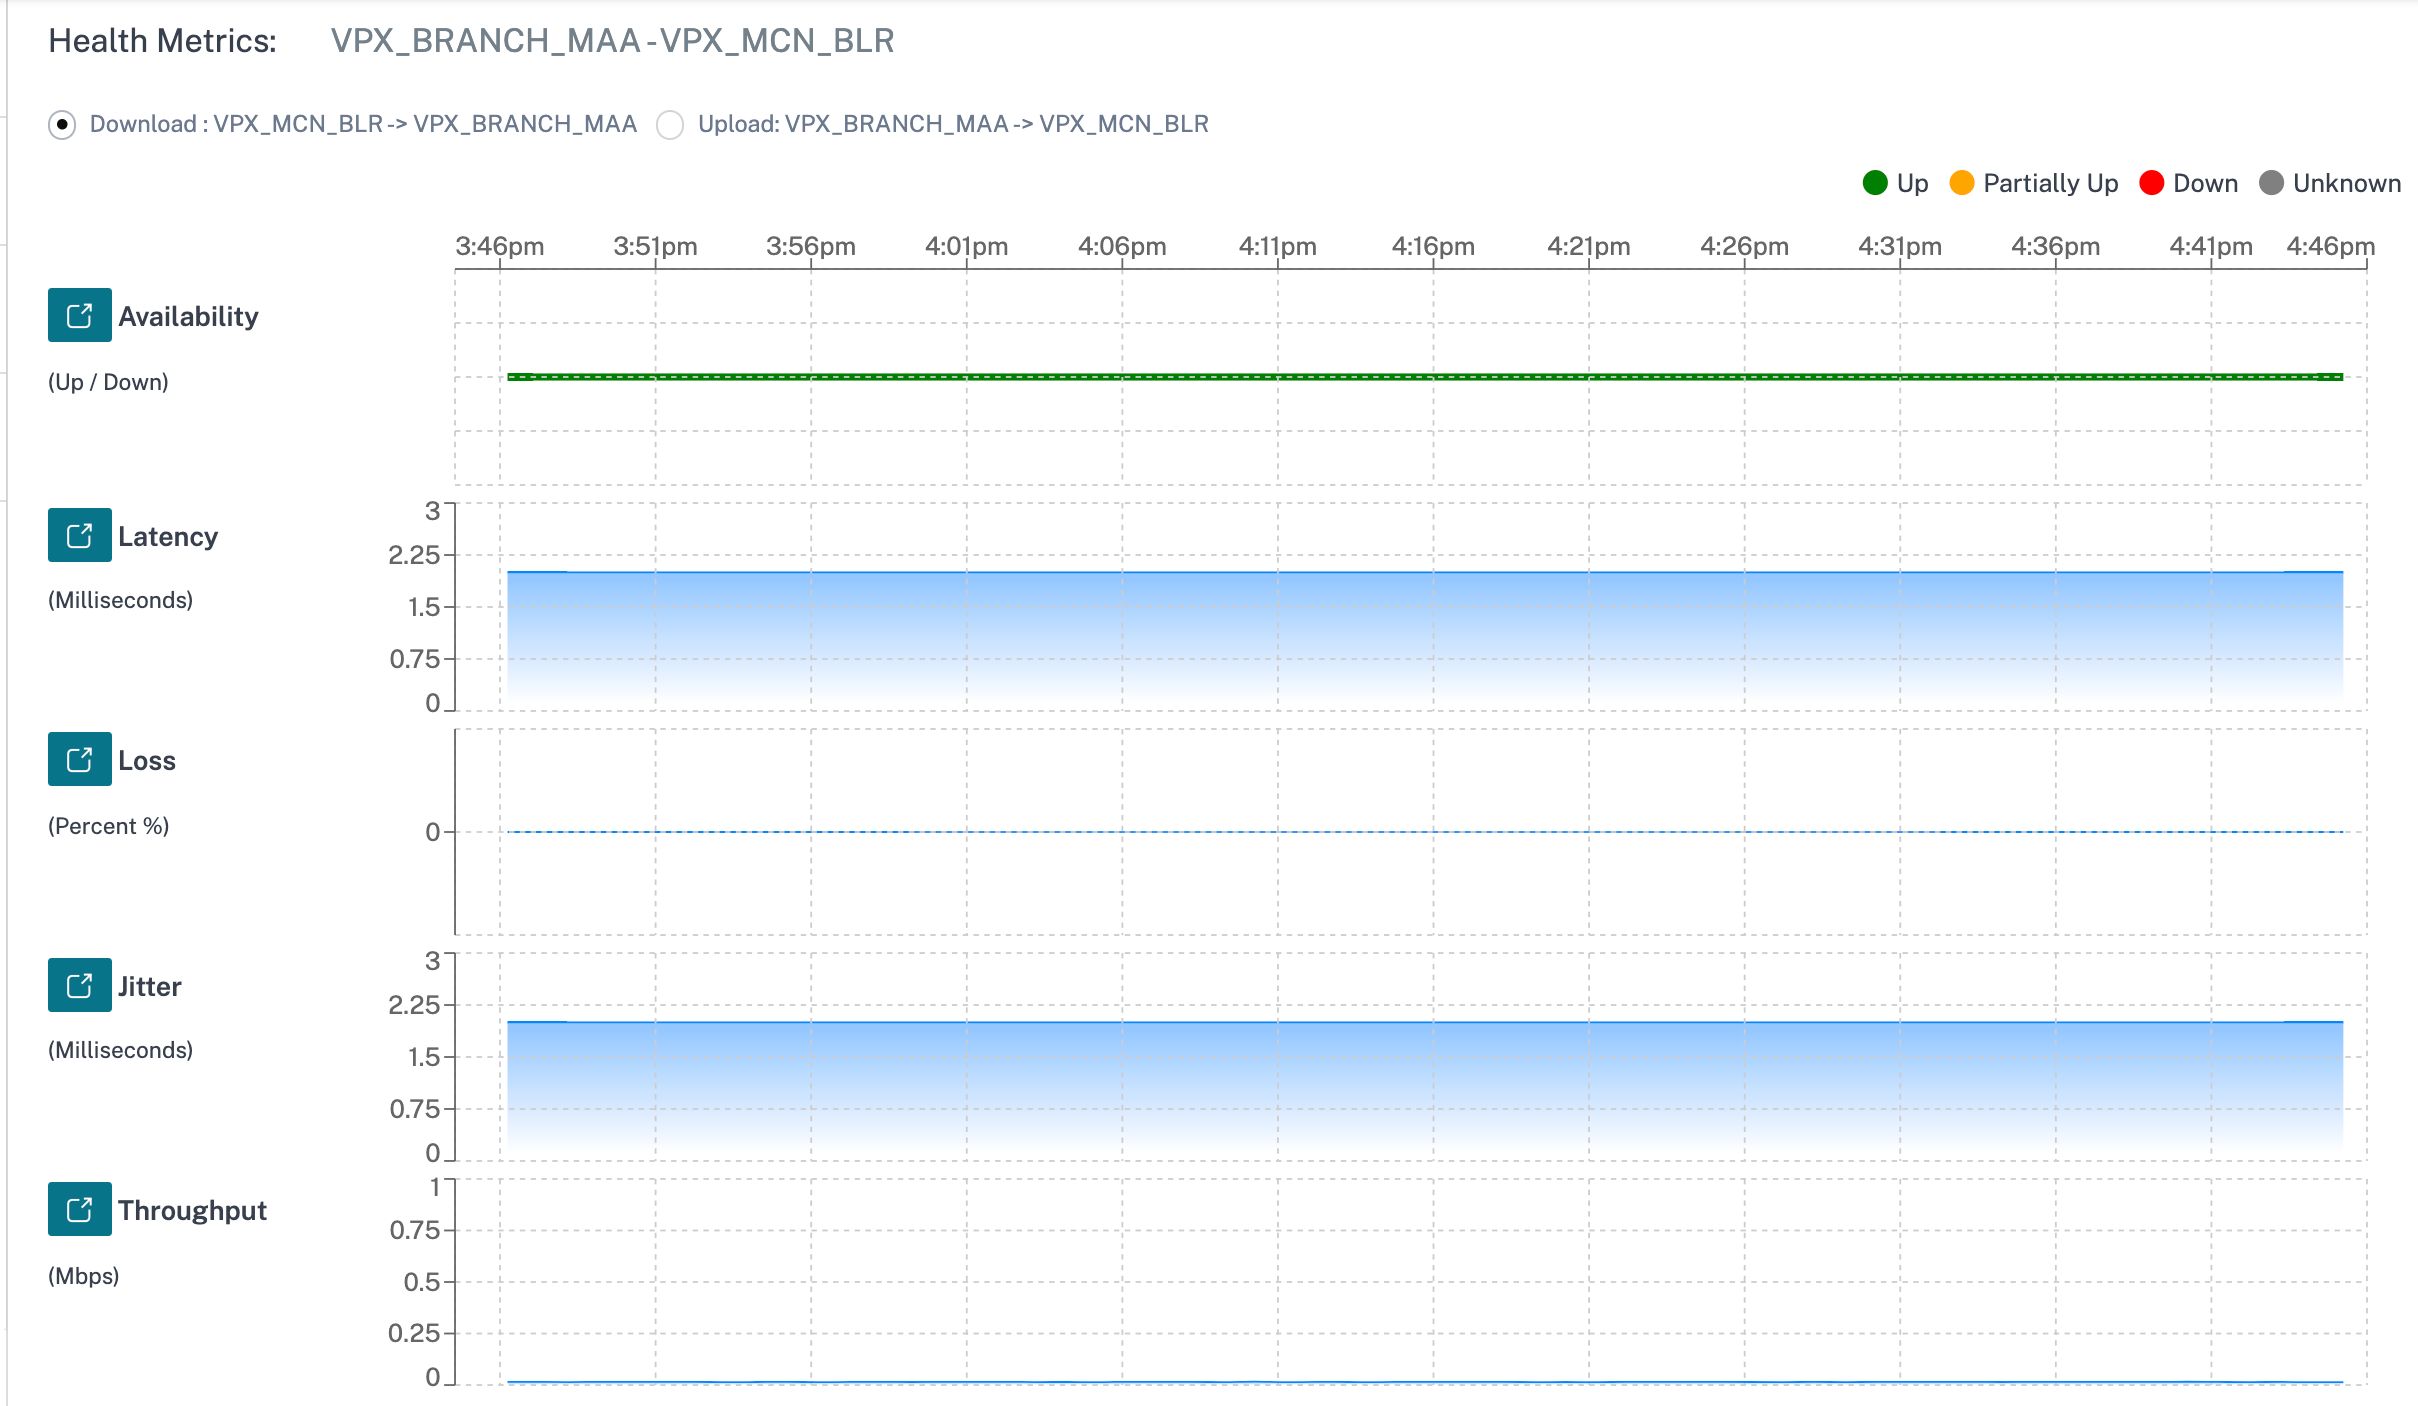
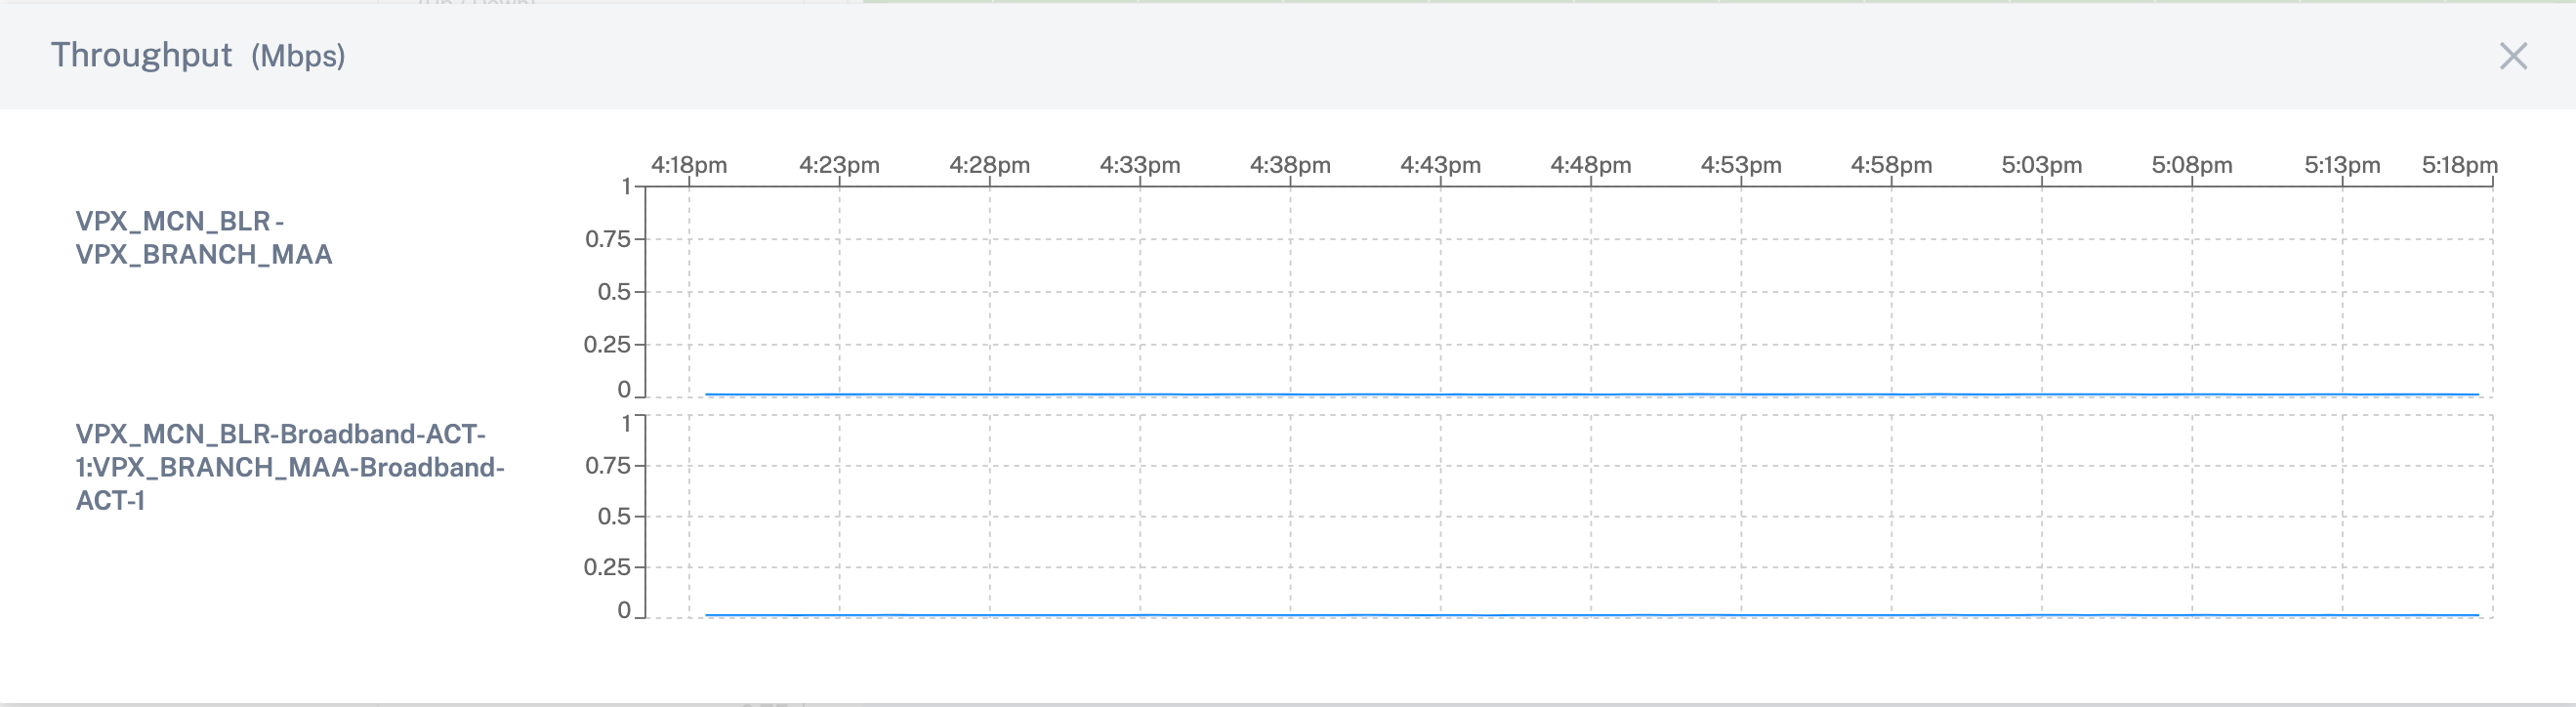
You can further drill down into each health metric to get a comparative view of the overlay virtual path and the underlay member paths for the same metric. This would aid in troubleshooting overlay versus underlay issues.
Devices
The Devices tab displays details associated with the site’s devices, interfaces, and disk temperature. You can also reboot the appliance, reset the appliance configuration or download device logs.
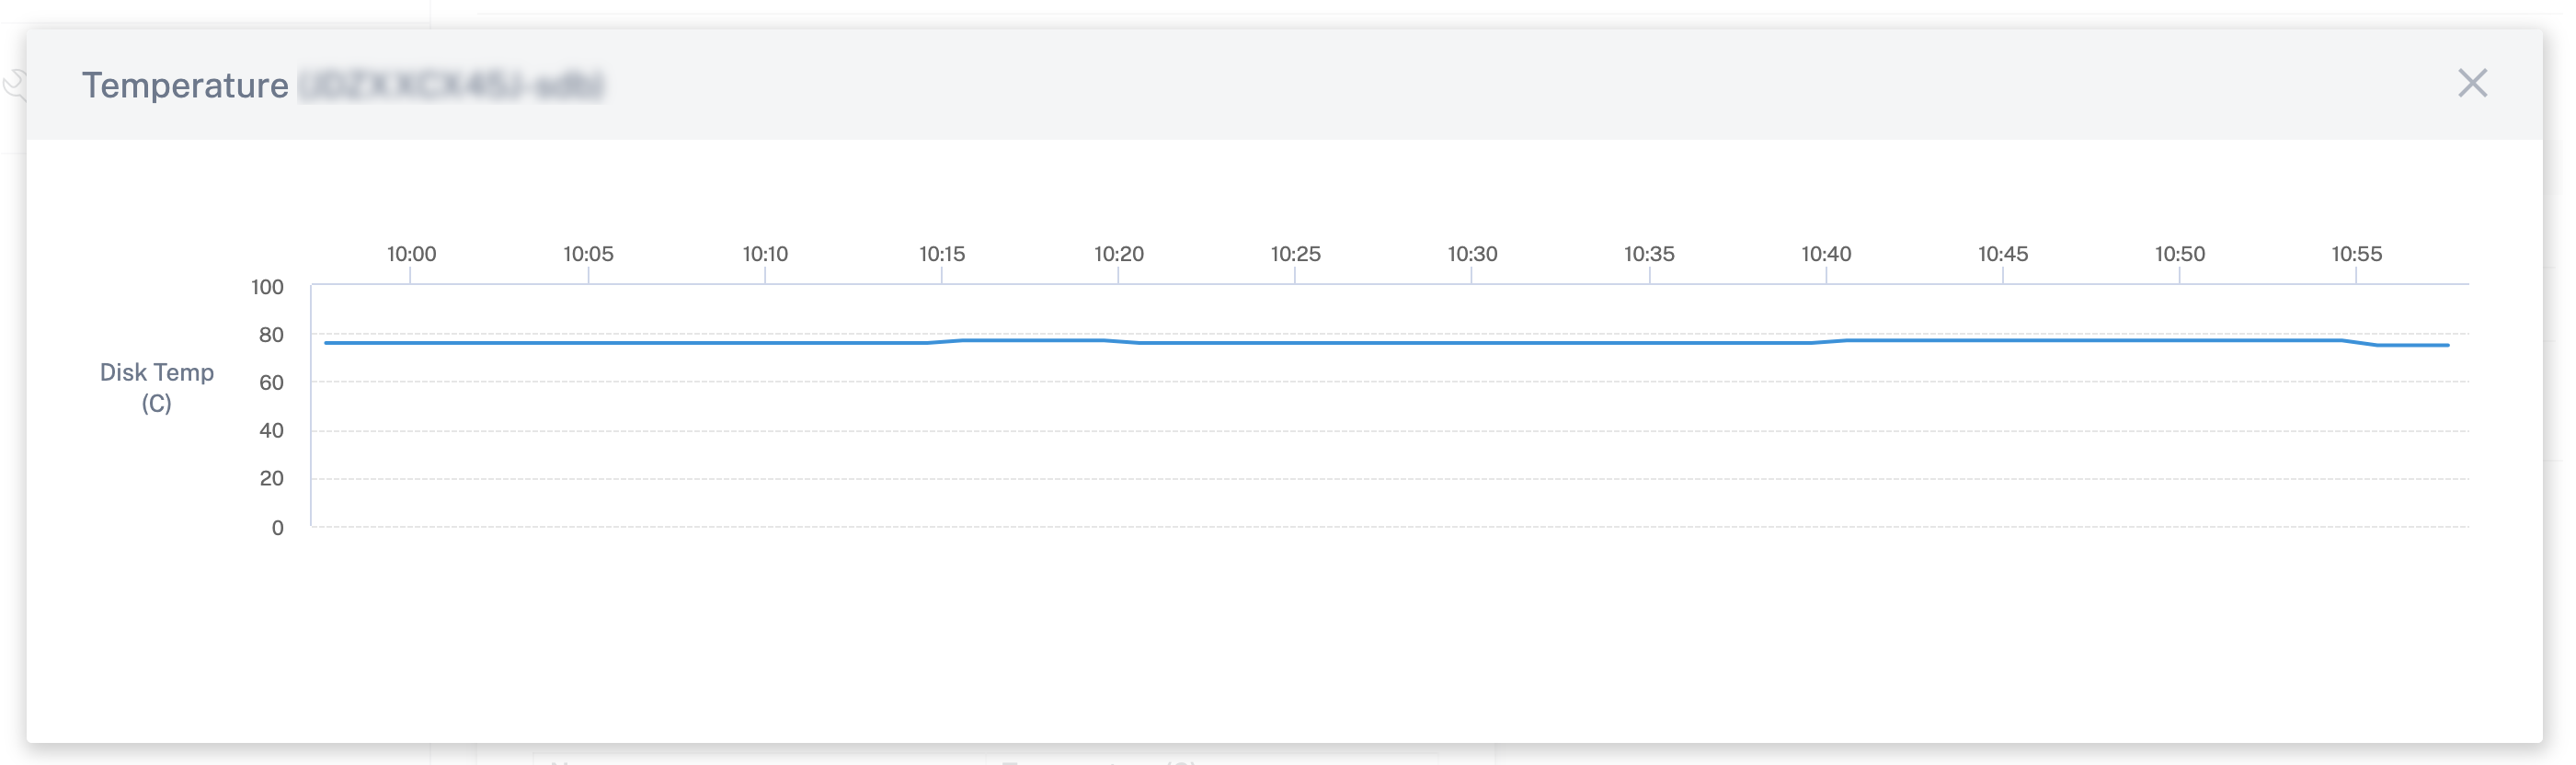
The Temperature section displays the temperature of the system, CPU, and the disks in degree Celsius.
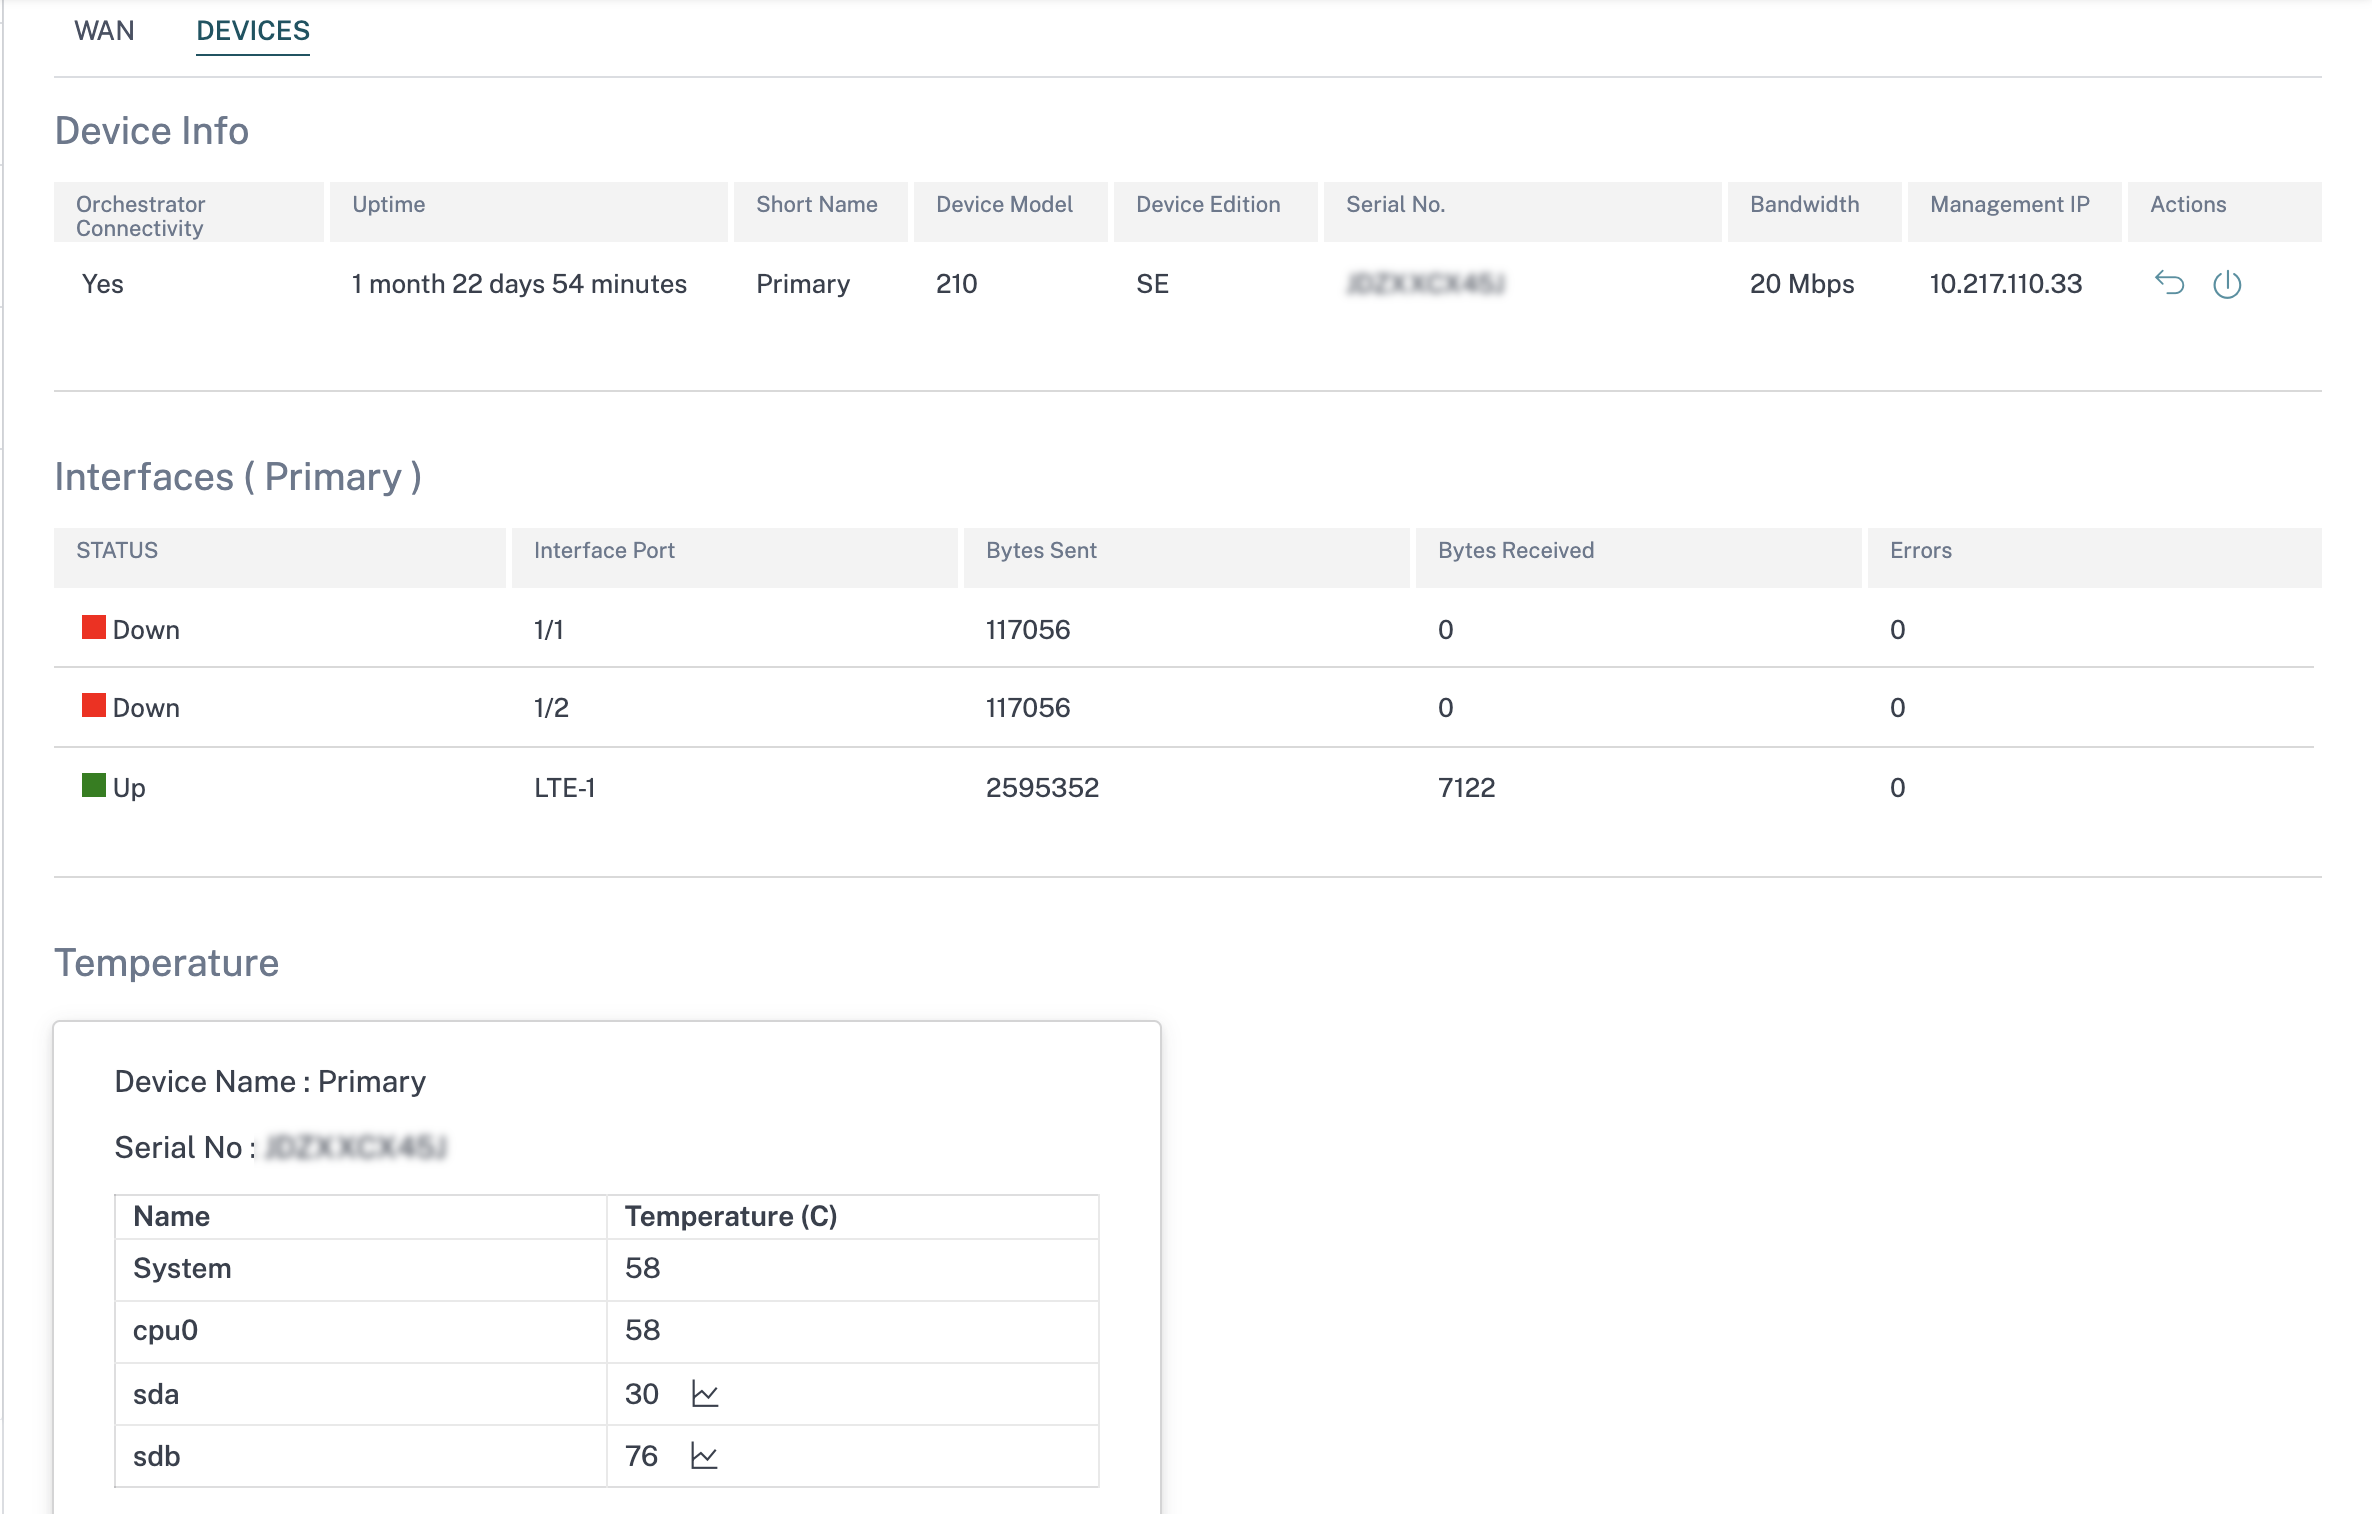
You can also click the graph icon in the Temperature (C) column and view the information in graphical form.
Share
Share
In this article
This Preview product documentation is Cloud Software Group Confidential.
You agree to hold this documentation confidential pursuant to the terms of your Cloud Software Group Beta/Tech Preview Agreement.
The development, release and timing of any features or functionality described in the Preview documentation remains at our sole discretion and are subject to change without notice or consultation.
The documentation is for informational purposes only and is not a commitment, promise or legal obligation to deliver any material, code or functionality and should not be relied upon in making Cloud Software Group product purchase decisions.
If you do not agree, select I DO NOT AGREE to exit.