Customer/Network reports
The Customer Reports provide visibility into network-wide alerts, usage trends, inventory, quality, diagnostics, and firewall status aggregated across all the sites in a customer network.
Alerts
The customer can review a detailed report of all the events and alerts generated across all the sites in this network.
It includes the severity, site at which the alert originated, alert message, time, and other details.
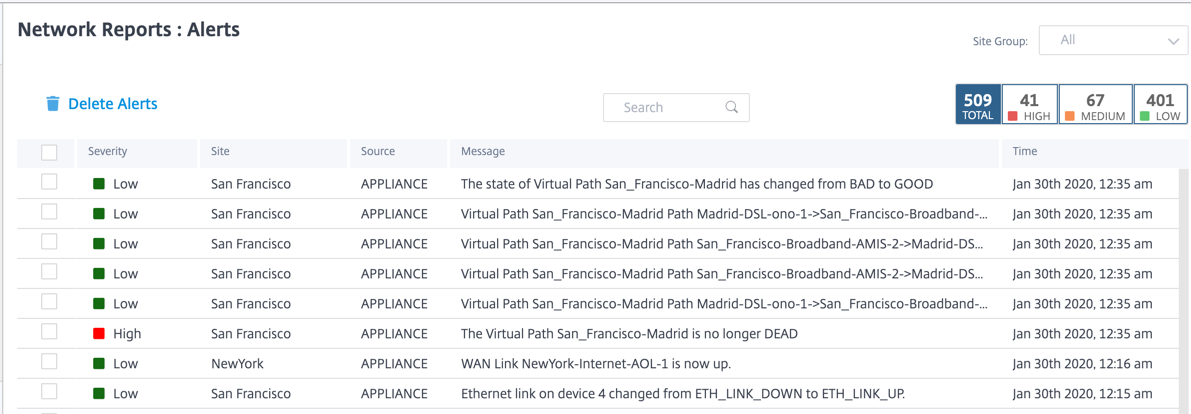
Suitable filtering options can be used as needed for example: Look for all the high severity alerts across all the sites, or all the alerts for a particular site and so on.
You can also select and clear alerts.
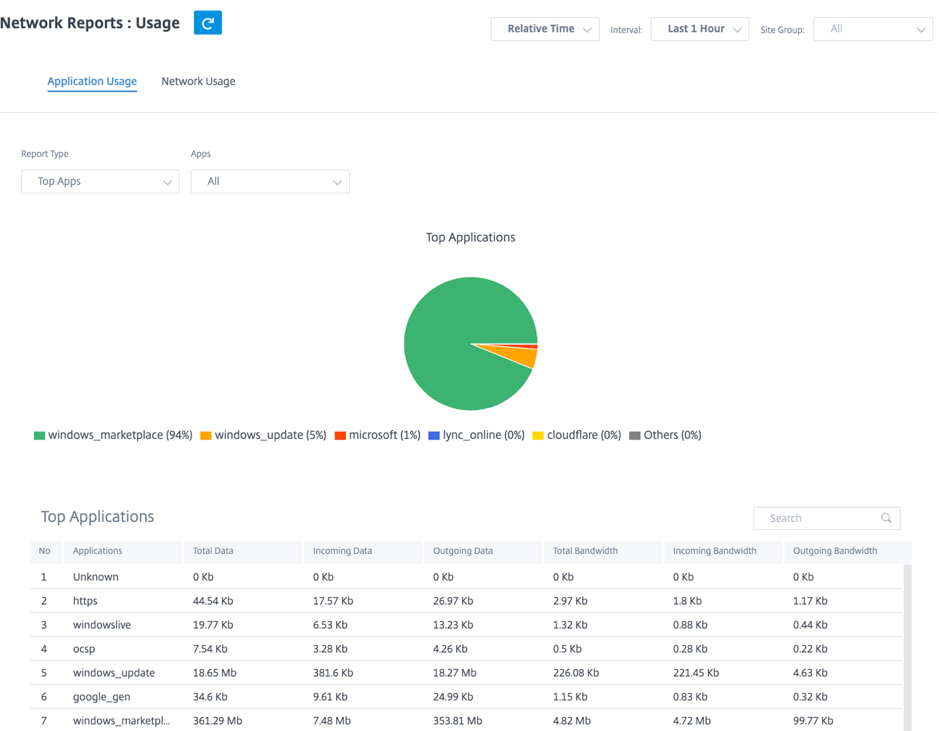
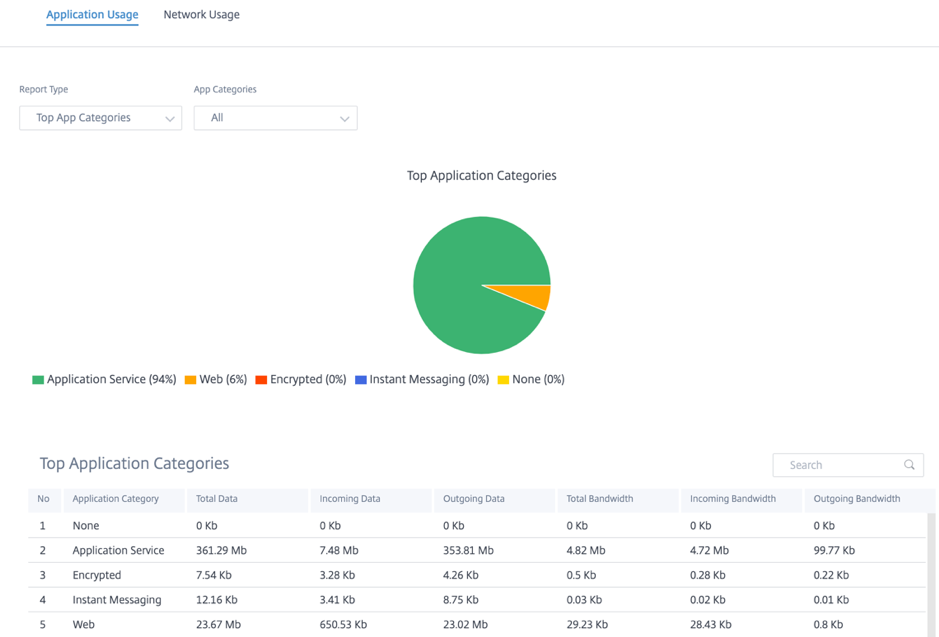
Usage
Customers can review usage trends such as Top Applications, Top Application Categories, App Bandwidth, and Top Sites across all the sites in their network.
Top application and application categories
The Top Applications and Top Application Categories chart shows the top applications and top application families that are widely used across all the sites. This allows you to analyze the data consumption pattern and reassign the bandwidth limit for each class of data within the network.
Application bandwidth
You can view the bandwidth usage statistics for the selected site group or for all sites. The bandwidth statistics are collected for the selected time interval. You can filter the statistics report based on the Report Type, Apps or Apps Categories, and Metrics.
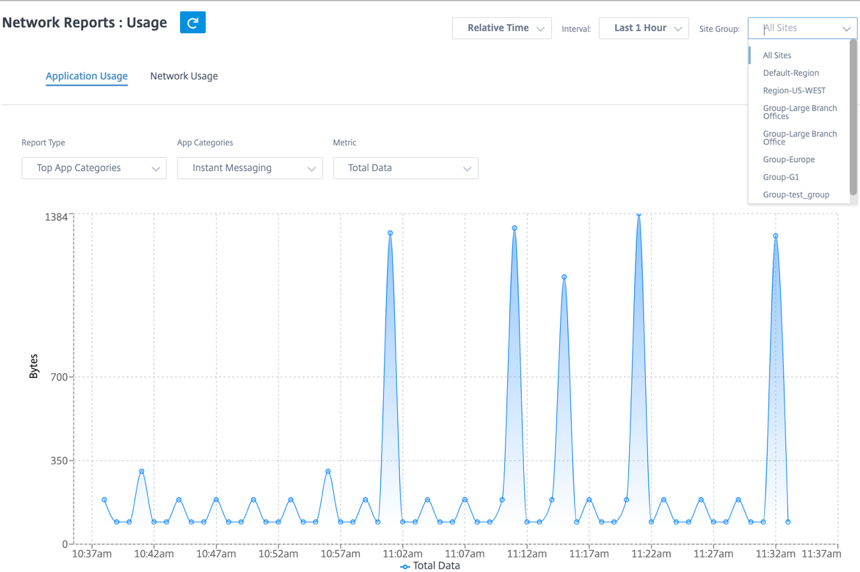
- Report Type: Select Top App or App Categories from the list.
- Apps/App Categories: Select top application or categories (such as network service) from the list.
- Metric: Select the bandwidth metric (such as Total Data, Incoming Data, Total Bandwidth) from the list.
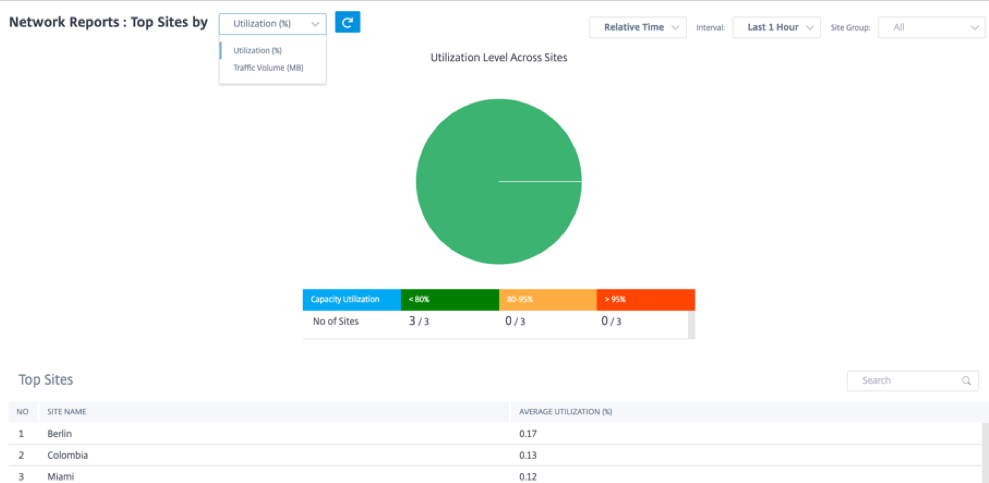
Network usage
The Top Sites chart depicts the top sites in the customer network that have the highest bandwidth usage. You can view the Sites by Utilization (%) or Traffic Volume (MB).
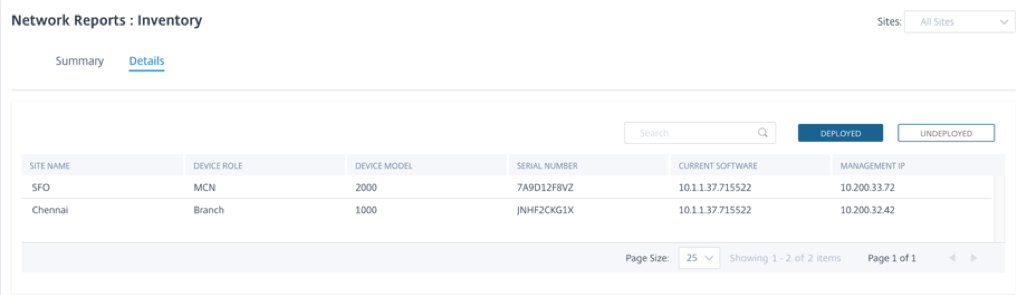
Inventory
The customer can view the entire device inventory across all the sites in the network. You can choose to view an inventory summary or a detailed view.
The inventory summary view provides a chart of the inventory spread, depicting the various appliance models and the number of each type of appliances used across all sites in the customer network.
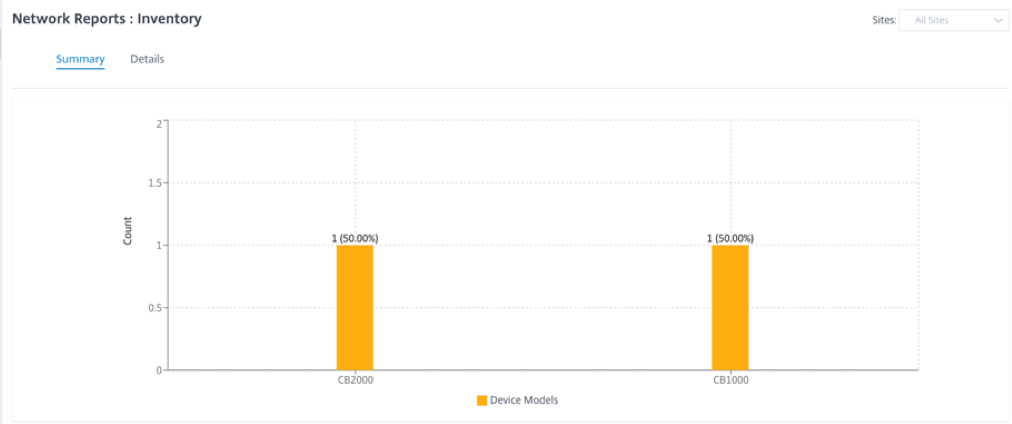
Suitable filtering options can be used as needed for example: Look for all appliances belonging to a specific site, or all appliances with a certain device model and so on.
The inventory detailed view provides a list of all the appliances that are deployed and those appliances that are configured but not deployed yet. Along with the customer, site name, device role, device serial number, current software, and device management IP address.
HDX dashboard and reports
For details on HDX dashboard and reports, see HDX dashboard and reports.
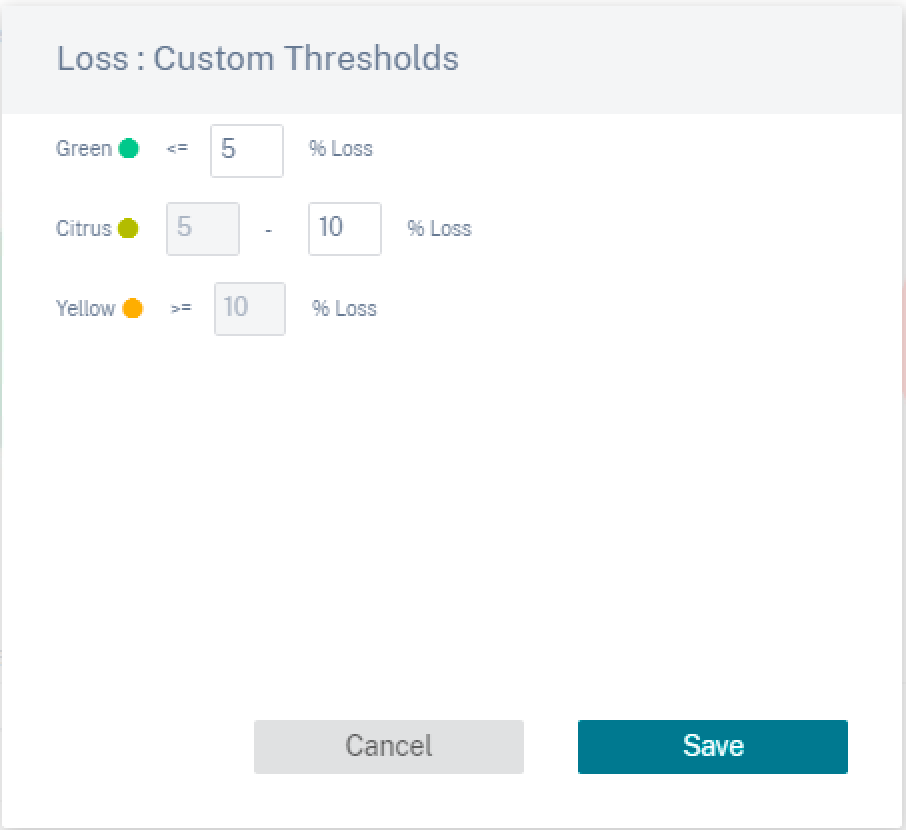
Quality
The Network Quality report enables a network-level comparison between the virtual overlay and the physical underlay paths in terms of availability and loss, latency, and jitter. This helps to effectively monitor how the overlay is faring relative to the underlay network, and also aids troubleshooting. For Latency and Jitter, only the details of the underlay member paths are displayed.
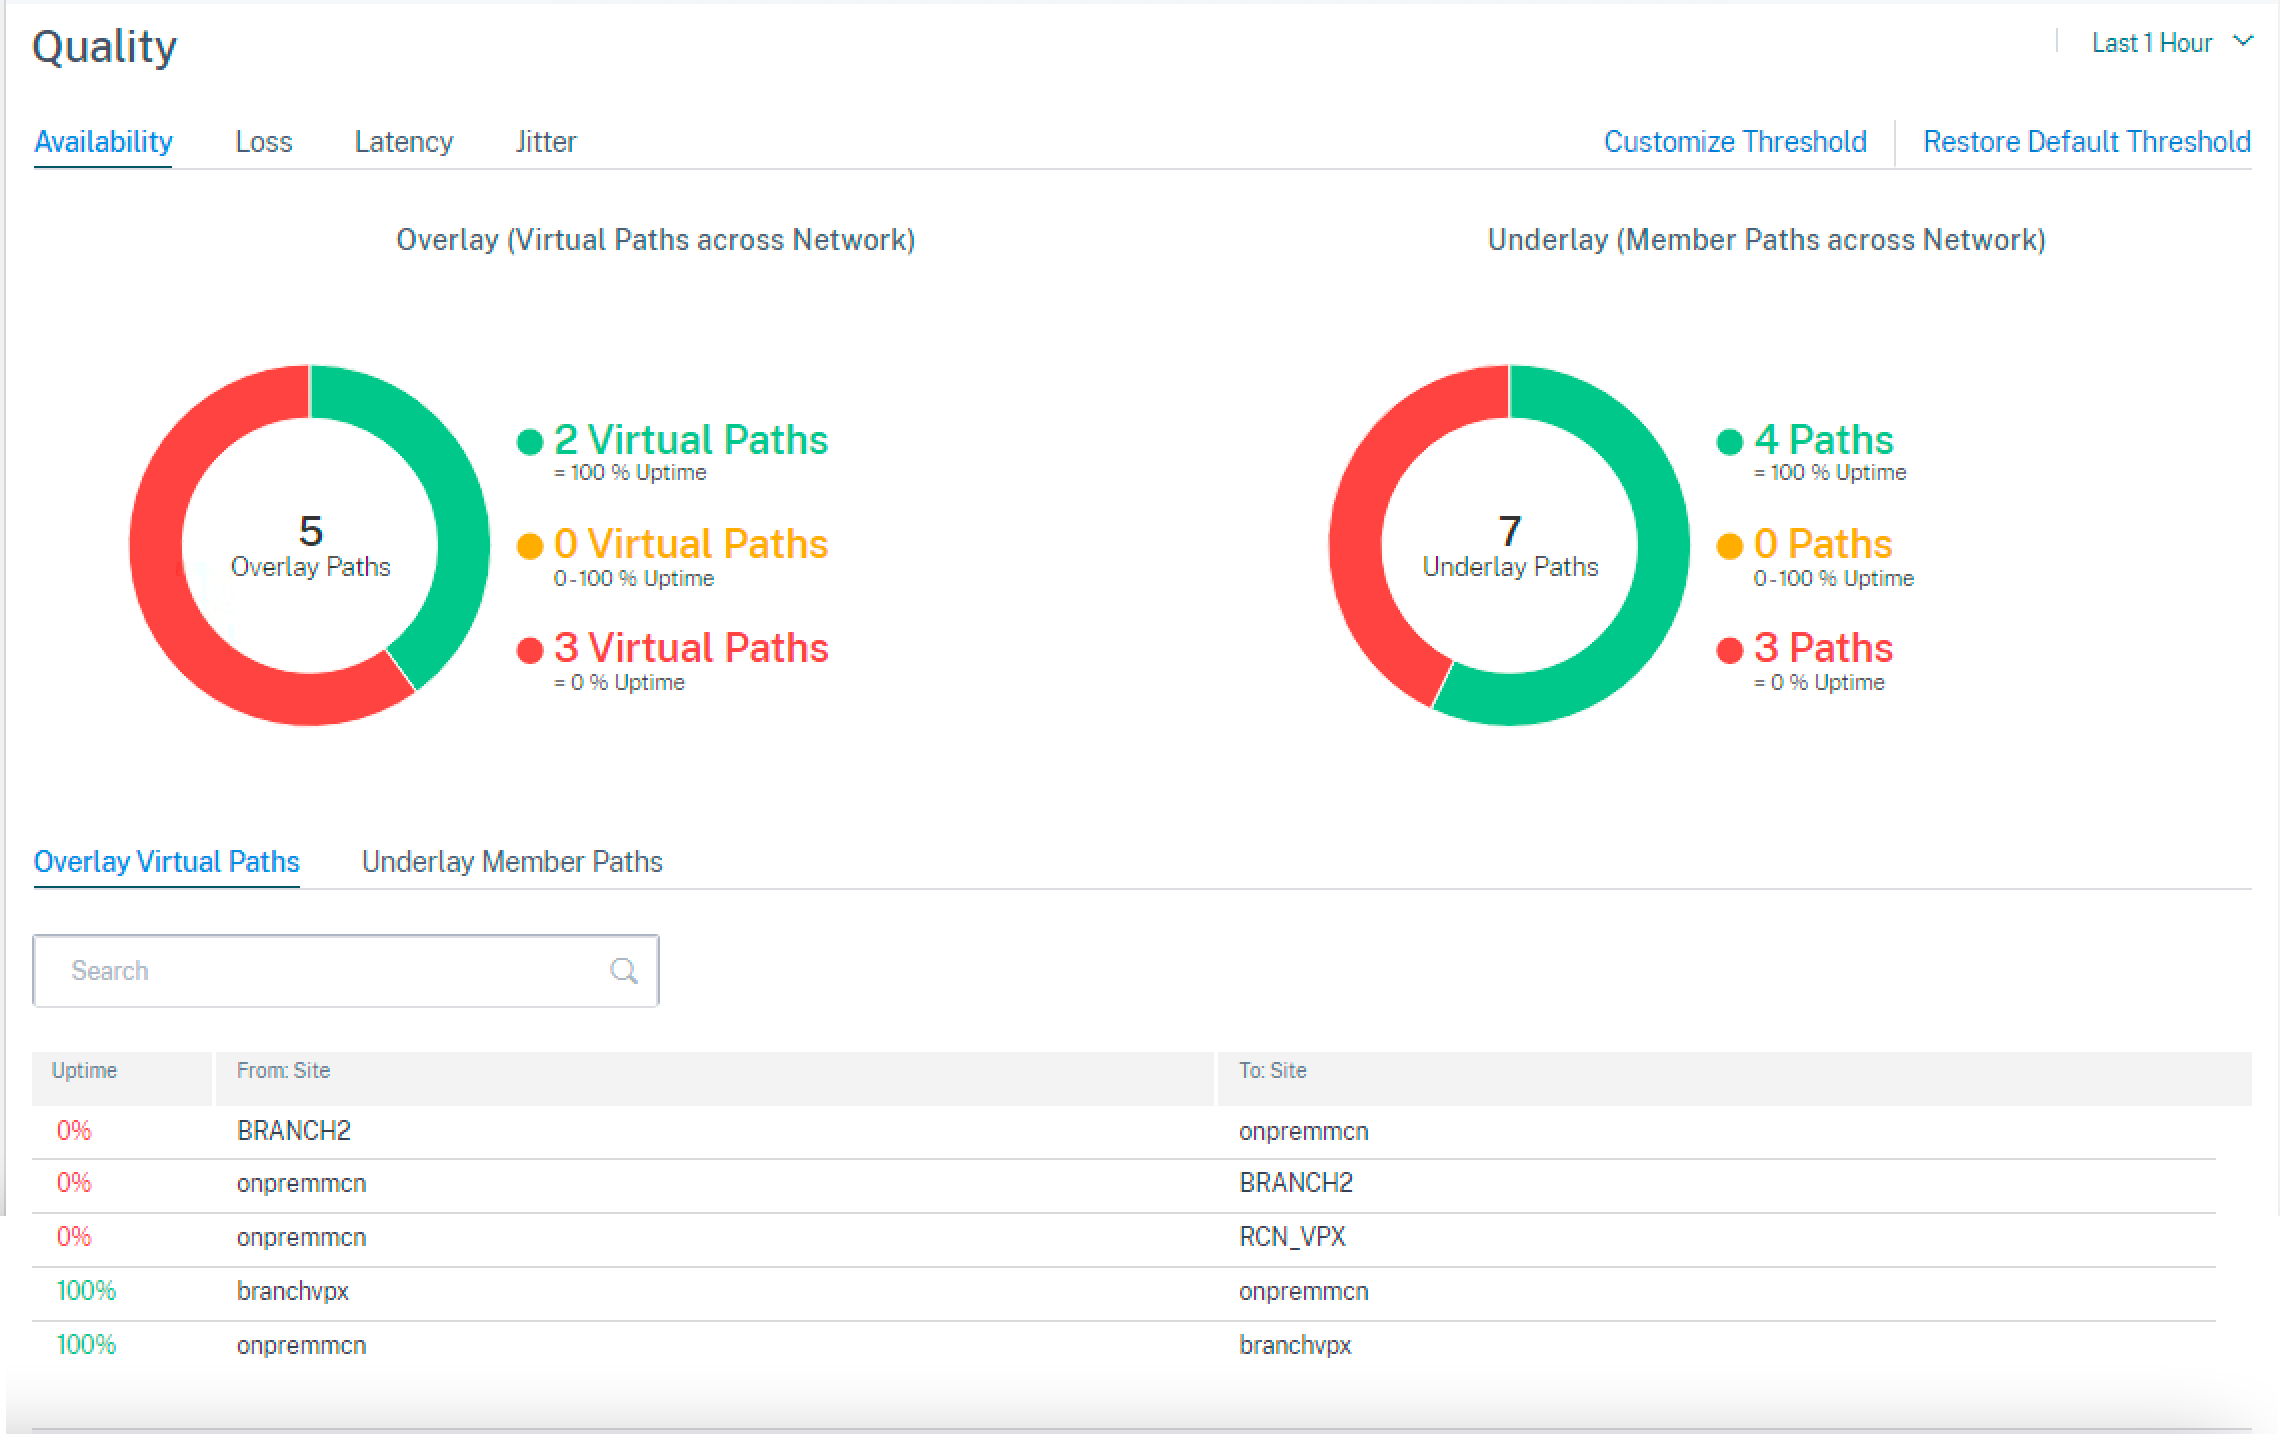
Click the table entry to see the detailed view.
You can customize the threshold for each network quality parameter.
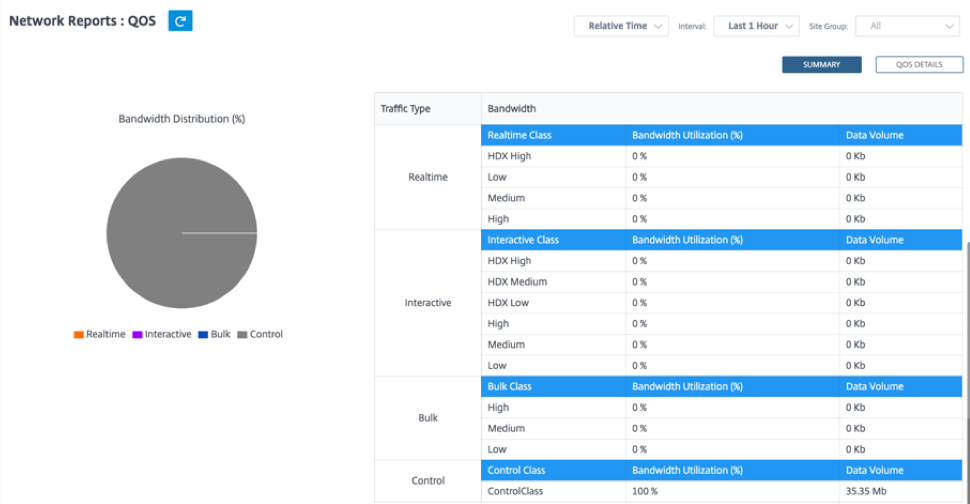
Quality of Service
Quality of Service (QoS) manages data traffic to reduce packet loss, latency, and jitter on the network. For more information, see Quality of Service. The following are two ways to view the Quality-of-Service (QoS) report:
-
Summary View: Summary view provides an overview of bandwidth consumption across all types of traffic - real-time, interactive, bulk, and control across the network and per site.
-
Real-time: Used for low latency, low bandwidth, time-sensitive traffic. Real-time applications are time sensitive but don’t really need high bandwidth (for example voice over IP). Real-time applications are sensitive to latency and jitter, but can tolerate some loss.
-
Interactive: Used for interactive traffic with low to medium latency requirements and low to medium bandwidth requirements. Interactive applications involve human input in the form of mouse clicks or cursor moves. The interaction is typically between a client and a server. The communication might not need high bandwidth but is sensitive to loss and latency. However, server to client does need high bandwidth to transfer graphical information, which might not be sensitive to loss.
-
Bulk: Used for high bandwidth traffic that can tolerate high latency. Applications that handle file transfer and need high bandwidth are categorized as bulk class. These applications involve little human interference and are mostly handled by the systems themselves.
-
Control: Used to transfer control packets that contain routing, scheduling, and link statistics information.
-
-
Detailed View: The detailed view captures trends around bandwidth consumption, traffic volume, packets dropped and so on for each QoS class associated with an overlay virtual path.
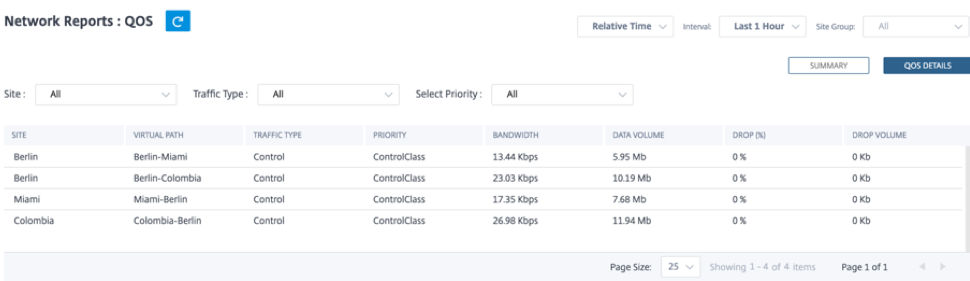
This report is available at the site level where the user can view QoS statistics based on the virtual path between the two sites. For more information see Site reports.
Historical statistics
For each site, you can view the statistics as graphs for the following network parameters:
- Sites
- Virtual Paths
- Paths
- WAN Links
- Interfaces
- Classes
- GRE Tunnels
- IPsec Tunnels
The statistics are collected as graphs. These graphs are plotted as timeline versus usage, allowing you to understand the usage trends of various network object properties. You can view graphs for network-wide application statistics.
You can view or hide the graphs and customize the columns as needed.
Sites
To view the Site statistics, navigate to Reports > Historical Statistics > Sites tab.
Select the site name from the list.
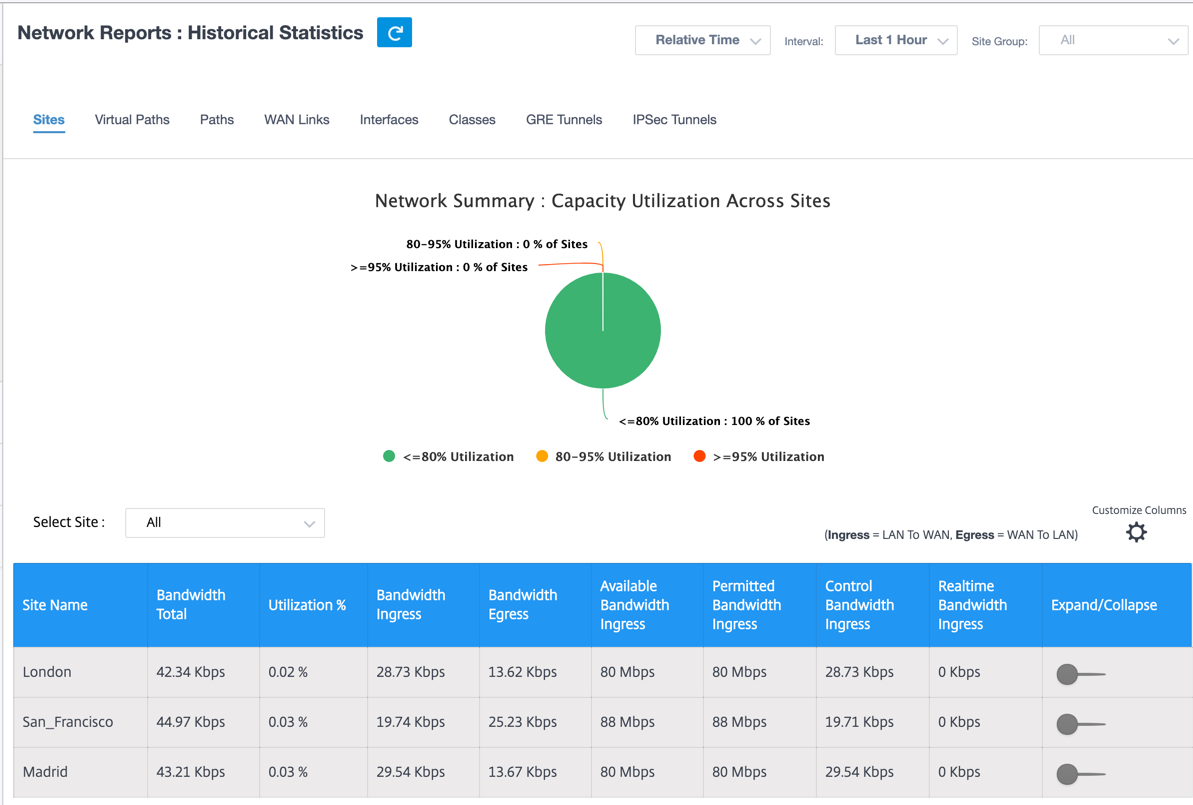
You can view the following metrics:
- Site Name: The site name.
- Bandwidth Total: Total bandwidth consumed by all packet types. Bandwidth = Control Bandwidth + Real-time Bandwidth + Interactive Bandwidth + Bulk Bandwidth.
- Utilization: You can view the site statistics by Utilization (%).
- Bandwidth Ingress: The max and the min download speed through the WAN port.
- Bandwidth Egress: The max and the min upload speed through the WAN port.
- Available Bandwidth Ingress: Total bandwidth allocated to all the WAN links of a site.
- Permitted Bandwidth Ingress: Bandwidth available for transmitting information.
- Control Bandwidth Ingress: Bandwidth used to transfer control packets that contain routing, scheduling, and link statistics information.
- Realtime Bandwidth Ingress: Bandwidth consumed by applications that belong to the real-time class type in the NetScaler SD-WAN configuration. The performance of such applications depends on a great extent upon network latency. A delayed packet is worse than a lost packet (for example, VoIP, Skype for Business).
- Expand/Collapse: You can expand or collapse the data as needed.
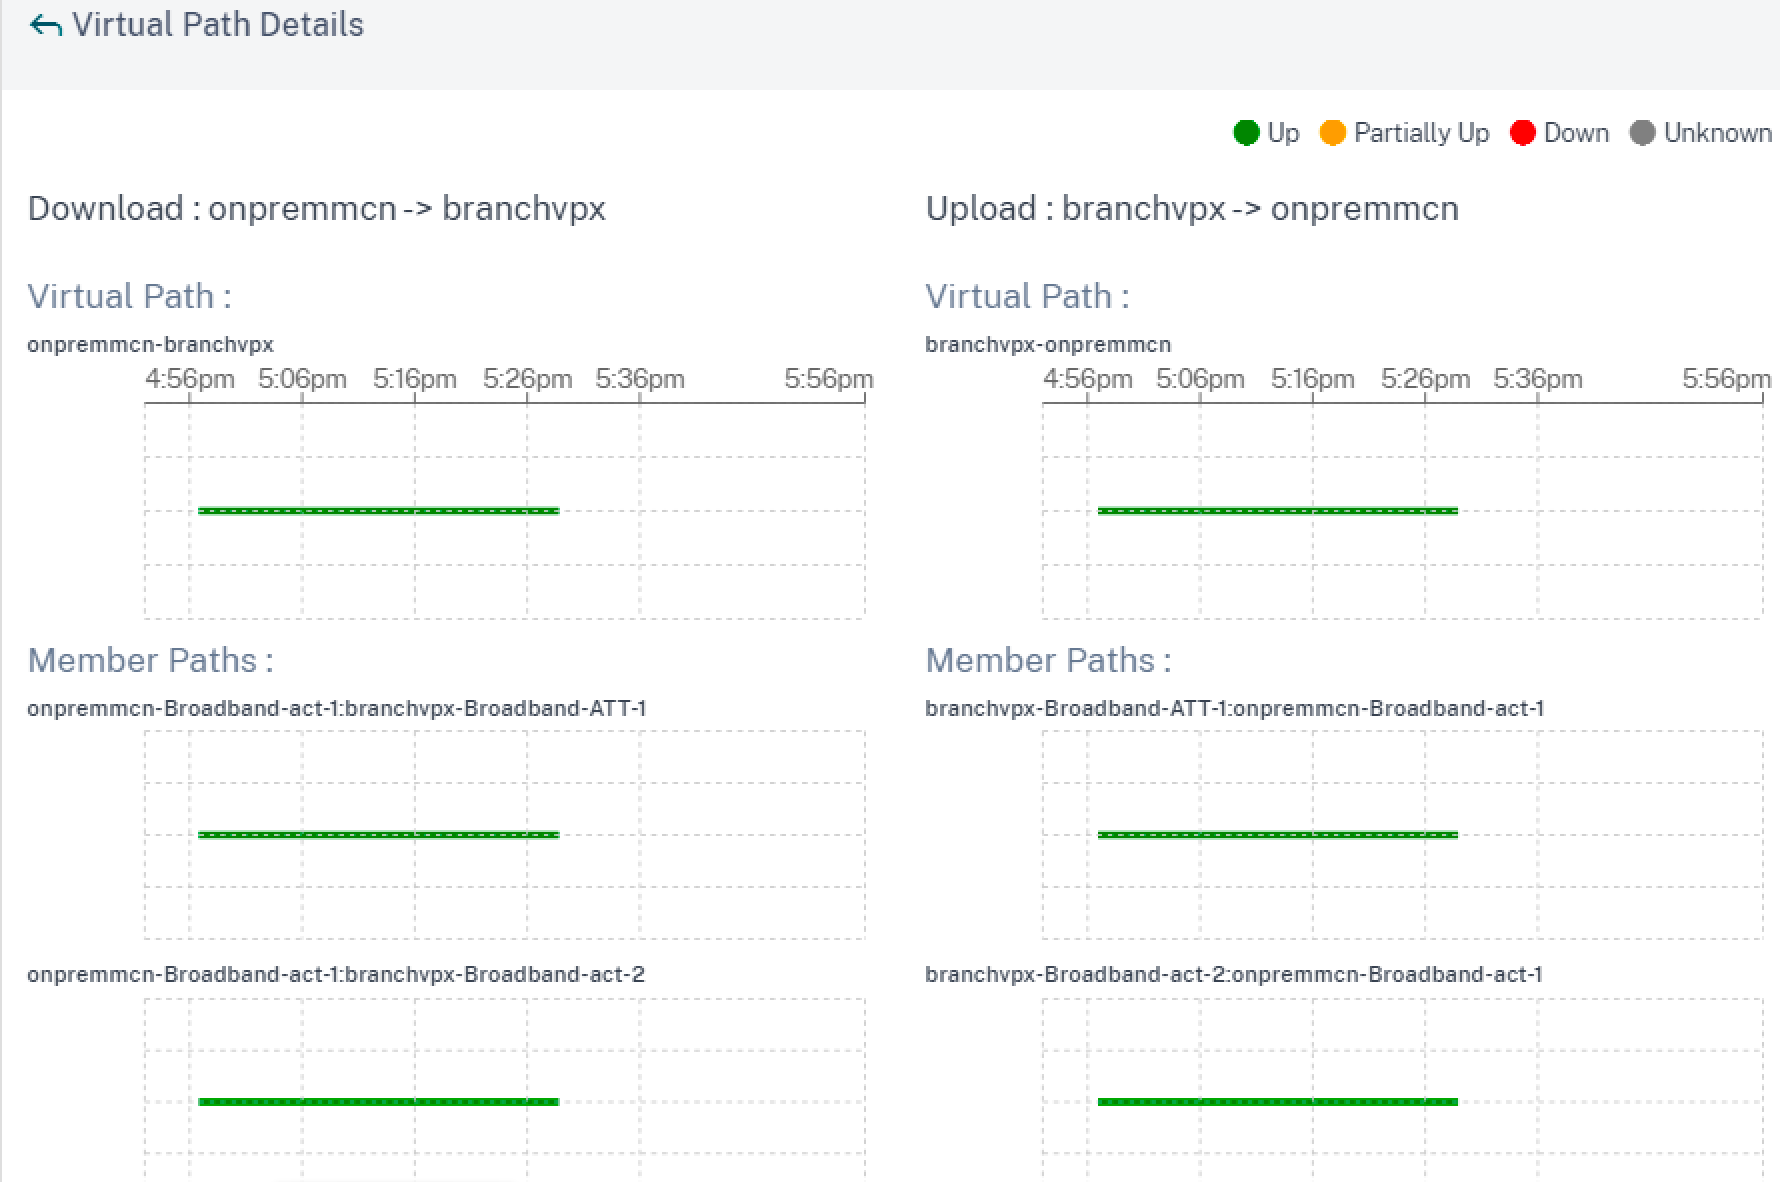
Virtual paths
To view the Virtual Paths statistics, navigate to Reports > Statistics > Virtual Paths tab.
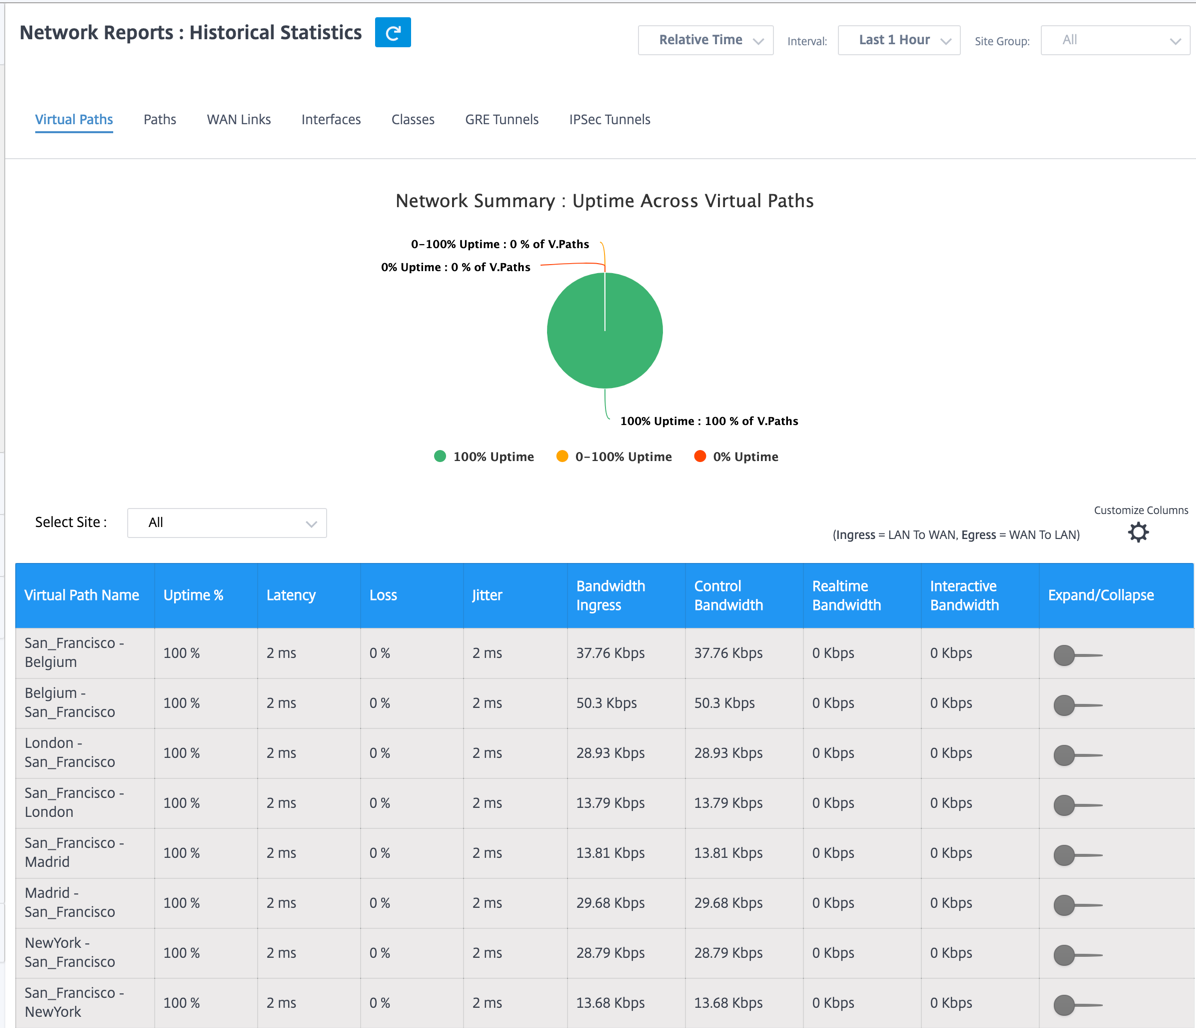
You can view the following metrics:
- Virtual Path Name: The virtual path name.
- Latency: The latency in milliseconds for real-time traffic.
- Loss: Percentage of packets lost.
- Jitter: Variation in the delay of received packets, in milliseconds.
- Bandwidth Ingress: Ingress (LAN to WAN) Bandwidth usage for the selected time period.
- Control Bandwidth: Bandwidth used to transfer control packets that contain routing, scheduling, and link statistics information.
- Real-time Bandwidth: Bandwidth consumed by applications that belong to the real-time class type in the SD-WAN configuration. The performance of such applications depends on a great extent upon network latency. A delayed packet is worse than a lost packet (for example, VoIP, Skype for Business).
- Interactive Bandwidth: Bandwidth consumed by applications that belong to the interactive class type in the SD-WAN configuration. The performance of such applications depends on a great extent upon network latency, and packet loss (for example, XenDesktop, XenApp).
- Bulk Bandwidth: Bandwidth consumed by applications that belong to the bulk class type in the SD-WAN configuration. These applications involve little human intervention and are handled by the systems themselves (for example, FTP, backup operations).
- Expand/Collapse: You can expand or collapse the data as needed.
Paths
To view the Paths statistics, navigate to Reports > Statistics > Paths tab.
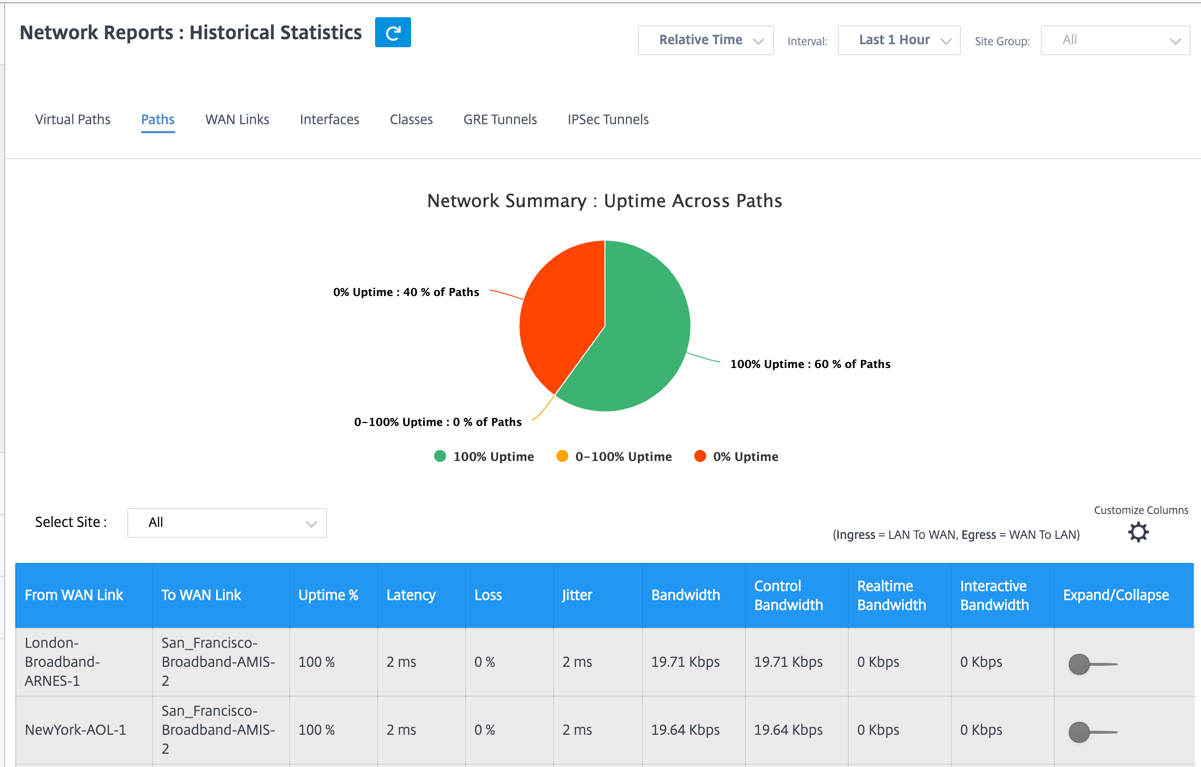
You can view the following metrics:
- From WAN Link: The source WAN link.
- To WAN Link: The destination WAN link.
- Latency: The latency in milliseconds for real time traffic.
- Loss: Percentage of packets lost.
- Jitter: Variation in the delay of received packets, in milliseconds.
- Bandwidth: Total bandwidth consumed by all packet types. Bandwidth= Control Bandwidth + Real-time Bandwidth + Interactive Bandwidth + Bulk Bandwidth.
- Control Bandwidth: Bandwidth used to transfer control packets that contain routing, scheduling, and link statistics information.
- Real-time Bandwidth: Bandwidth consumed by applications that belong to the real-time class type in the SD-WAN configuration. The performance of such applications depends on a great extent upon network latency. A delayed packet is worse than a lost packet (for example, VoIP, Skype for Business).
- Interactive Bandwidth: Bandwidth consumed by applications that belong to the interactive class type in the SD-WAN configuration. The performance of such applications depends on a great extent upon network latency, and packet loss (for example, XenDesktop, XenApp).
- Bulk Bandwidth: Bandwidth consumed by applications that belong to the bulk class type in the SD-WAN configuration. These applications involve little human intervention and are handled by the systems themselves (for example, FTP, backup operations).
- Expand/Collapse: You can expand or collapse the data as needed.
WAN links
To view the statistics at WAN Link level, navigate to Reports > Statistics > WAN Links tab.
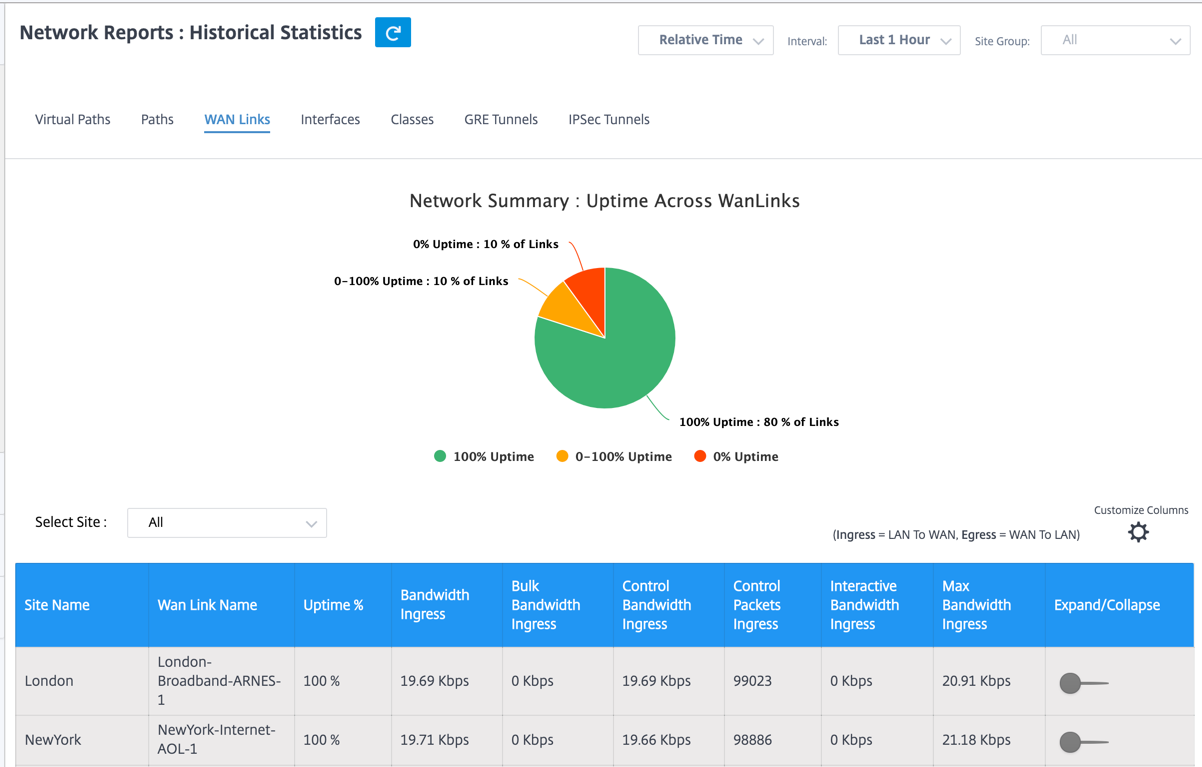
You can view the following metrics:
- WAN Link Name: The path name.
- Bandwidth Ingress: Ingress (LAN to WAN) Bandwidth usage for the selected time period.
- Bulk Bandwidth Ingress: Ingress (LAN to WAN) Virtual Path Bandwidth used by Bulk traffic for the selected time period.
- Control Bandwidth Ingress: Ingress (LAN to WAN) Virtual Path Bandwidth used by Control traffic for the selected time period.
- Control Packet Ingress: Ingress (LAN to WAN) Virtual Path Control packets for the selected time period.
- Interactive Bandwidth Ingress: Ingress (LAN to WAN) Virtual Path Bandwidth used by Interactive traffic for the selected time period.
- Max Bandwidth Ingress: Max Ingress (LAN to WAN) Bandwidth used in a minute for the selected time period.
- Min Bandwidth Ingress: Min Ingress (LAN to WAN) Bandwidth used in a minute for the selected time period.
- Expand/Collapse: You can expand or collapse the data as needed.
Interfaces
The Interfaces statistic report helps you during troubleshooting to quickly see whether any of the ports are down. You can also view the transmitted and received bandwidth, or packet details at each port. You can also view the number of errors that occurred on these interfaces during a certain time period.
To view Interface statistics, navigate to Reports > Statistics > Interfaces tab.
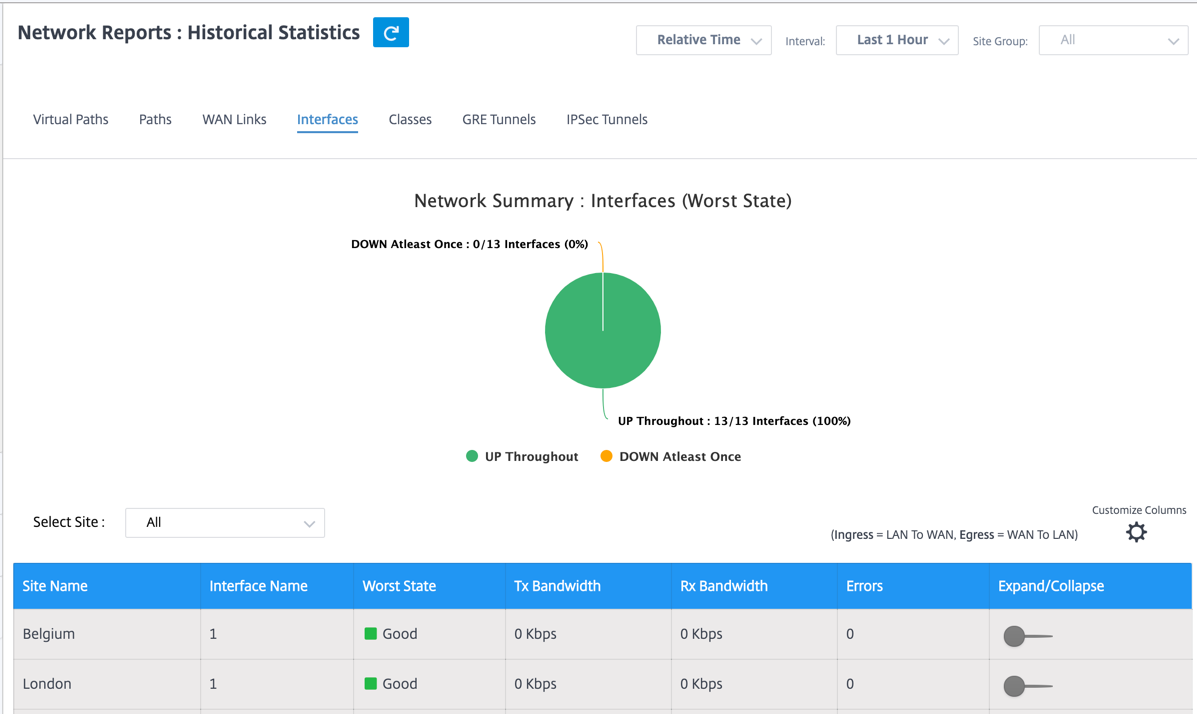
You can view the following metrics:
- Interface Name: The name of the Ethernet interface.
- Tx Bandwidth: Bandwidth transmitted.
- Rx Bandwidth: Bandwidth received.
- Errors: Number of errors observed during the selected time period.
- Expand/Collapse: You can expand or collapse the data as needed.
Classes
The virtual services can be assigned to particular QoS classes, and different bandwidth restraints can be applied to different classes.
To view Class statistics, navigate to Reports > Statistics > Classes tab.
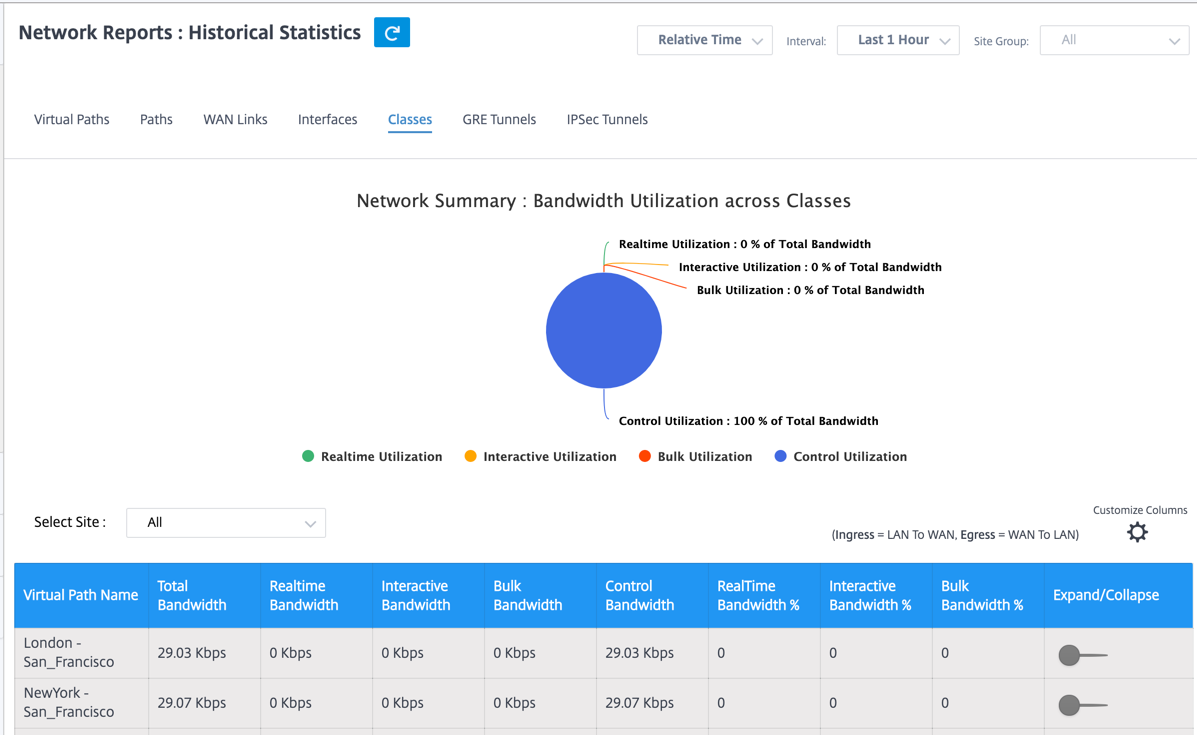
You can view the following metrics:
- QoS Class: The class name.
- Bandwidth: Transmitted bandwidth.
- Data Volume: Data sent, in Kbps.
- Drop Volume: Percentage of data dropped.
- Drop Percent: Percentage of data dropped.
- Expand/Collapse: You can expand or collapse the data as needed.
GRE tunnels
You can use a tunneling mechanism to transport packets of one protocol within another protocol. The protocol that carries the other protocol is called the transport protocol, and the carried protocol is called the passenger protocol. Generic Routing Encapsulation (GRE) is a tunneling mechanism that uses IP as the transport protocol and can carry many different passenger protocols.
The tunnel source address and destination address are used to identify the two endpoints of the virtual point-to-point links in the tunnel. For more information about configuring GRE tunnels on Citrix SD-WAN appliances, see GRE Tunnel.
To view GRE Tunnel statistics, navigate to Reports > Statistics > GRE Tunnels tab.
You can view the following metrics:
- Site Name: The site name.
- Tx Bandwidth: Bandwidth transmitted.
- Rx Bandwidth: Bandwidth received.
- Packet Dropped: Number of packets dropped, because of network congestion.
- Packets Fragmented: Number of packets fragmented. Packets are fragmented to create smaller packets that can pass through a link with an MTU that is smaller than the original datagram. The fragments are reassembled by the receiving host.
- Expand/Collapse: You can expand or collapse the data as needed.
IPsec tunnels
IP Security (IPsec) protocols provide security services such as encrypting sensitive data, authentication, protection against replay, and data confidentiality for IP packets. Encapsulating Security Payload (ESP), and Authentication Header (AH) are the two IPsec security protocols used to provide these security services.
In IPsec tunnel mode, the entire original IP packet is protected by IPsec. The original IP packet is wrapped and encrypted, and a new IP header is added before transmitting the packet through the VPN tunnel. For more information about configuring IPsec tunnels on Citrix SD-WAN appliances, see IPsec Tunnel Termination.
To view IPsec Tunnel statistics, navigate to Reporting > statistics > IPsec Tunnels tab.
You can view the following metrics:
- Tunnel Name: The tunnel name.
- Tunnel State: IPsec tunnel state.
- MTU: Maximum transmission unit—size of the largest IP datagram that can be transferred through a specific link.
- Packet Received: Number of packets received.
- Packets Sent: Number of packets Sent.
- Packet Dropped: Number of packets dropped, because of network congestion.
- Bytes Dropped: Number of bytes dropped.
- Expand/Collapse: You can expand or collapse the data as needed.
Real time statistics
The Real time statics page displays the folowing statistical information at the customer level:
Network statistics
The Network Statistics page provides the following real time statistical information under Reports > Real Time > Network Statistics:
- Sites
- Virtual Paths
- WAN Member Paths
- WAN Links
- WAN Link Usage
- MPLS Queues
- Access Interfaces
- Interfaces
- Intranet
- IPsec Tunnel
- GRE
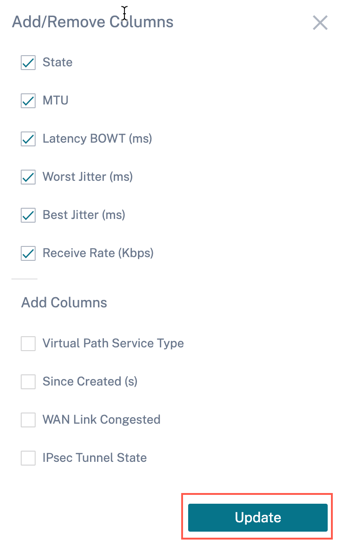
To get a real time statistical report, go to the required tab (such as sites, virtual paths, WAN links), select the site from the drop-down list, and click Retrieve latest data.
Click the plus (+) symbol to add or remove any column from the statistics table and click Update.
App statistics
The App Statistics page provides the following real time statistical information under Reports > Real Time > App Statistics:
- Applications
- App QoS
- QoS Classes
- QoS Rules
- Rule Groups
To get a real time statistical report, go to the required tab (such as applications, QoS rule, QoS classes) select the site from the drop-down list, and click Retrieve latest data.
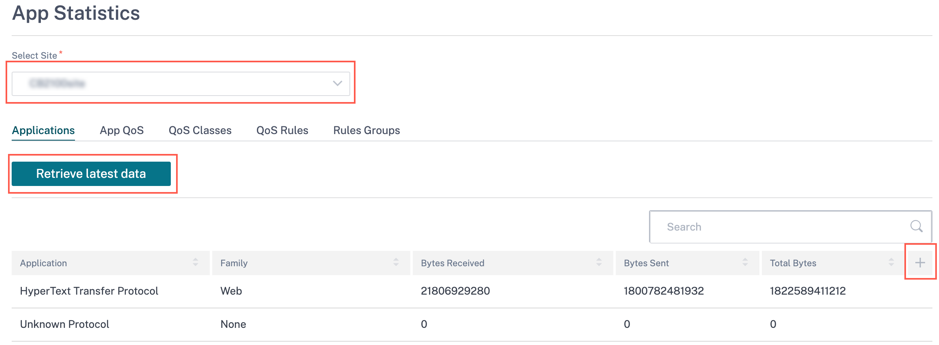
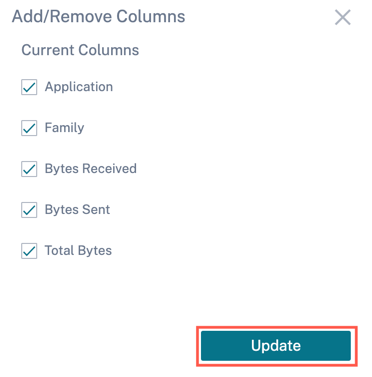
Click the plus (+) symbol if you want to add or remove any column from the statistics table and click Update.
Route statistics
The Routes Statistics page provides the following real time statistical information under Reports > Real Time > Route Statistics:
- ARP
- Routes
- Application Routes
- Observed Protocols
- Multicast Group
- NDP Rules Groups
To get a real time statistical report, go to the required tab (such as ARP, Routes, Application Routes) select the site from the drop-down list, and click Retrieve latest data.
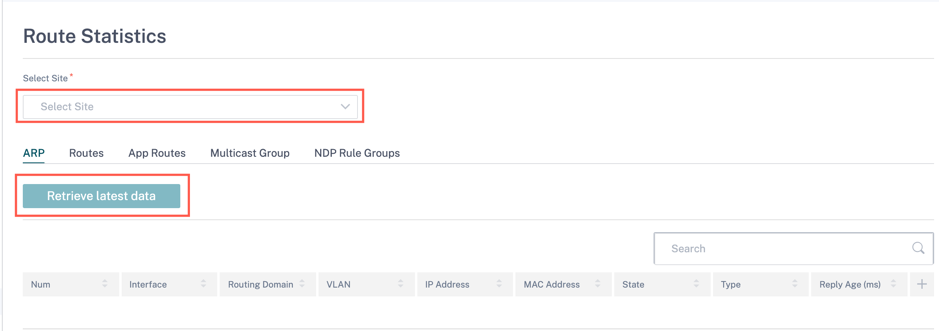
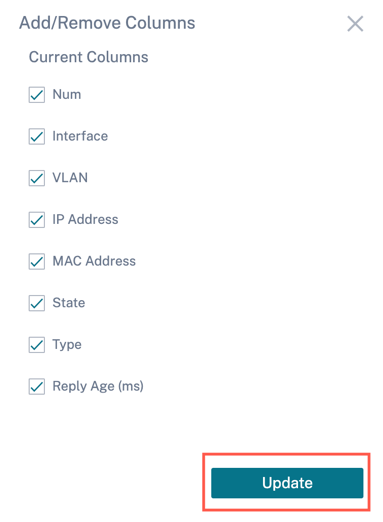
Click the plus (+) symbol if you want to add or remove any column from the statistics table and click Update.
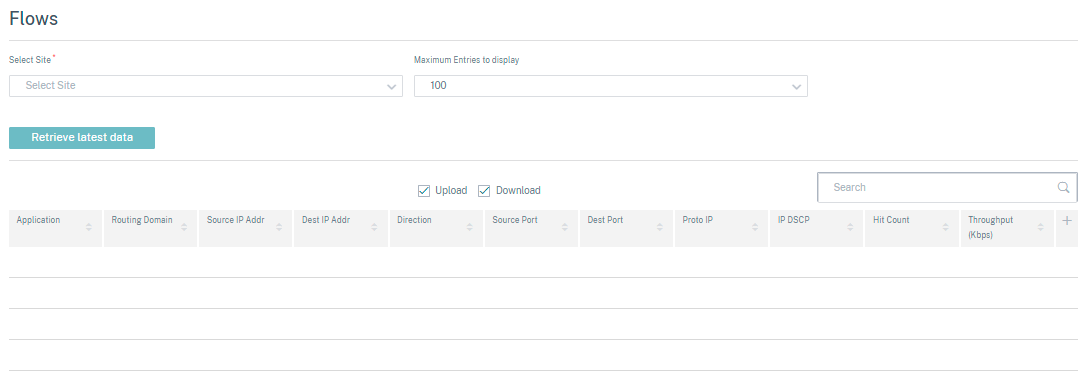
Flows
At the network level, select the site from the drop-down list before you can fetch the statistics. The Flows feature provides a unidirectional flow information related to a particular session going through the appliance. This provides information on the destination service type the flow is falling into and also the information related to the rule and class type and also the transmission mode.
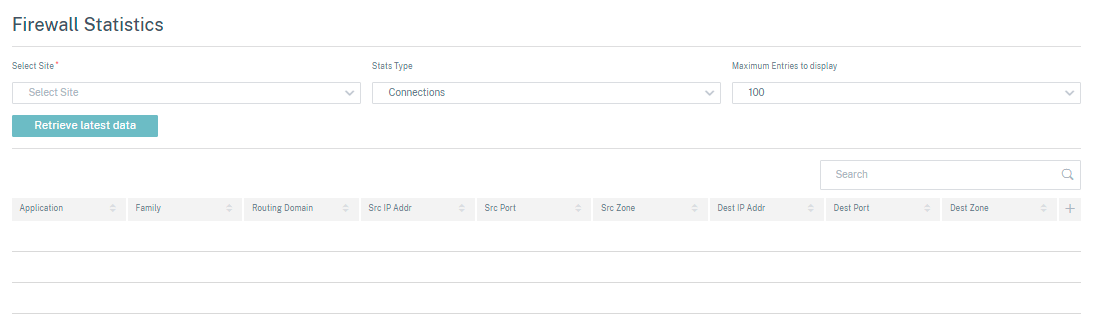
Firewall statistics
At the network level, select the site from the drop-down list before you can fetch the statistics. The Firewall statictics provide the state of the connection related to a particular session based on the firewall action configured. Firewall connections also provide complete details about the source and destination of the connection.
Application Quality
Application QoE is a measure of Quality of Experience of applications in the SD-WAN network. It measures the quality of applications that flow through the virtual paths between two SD-WAN appliances. The Application QoE score is a value between 0 and 10. The score range that it falls in determines the quality of an application. Application QoE enables network administrators to review the quality of experience of applications and take proactive measures when the quality goes below the acceptable threshold.
| Quality | Range | Color Coding |
|---|---|---|
| Good | 8–10 | Green |
| Fair | 4–8 | Orange |
| Poor | 0–4 | Red |
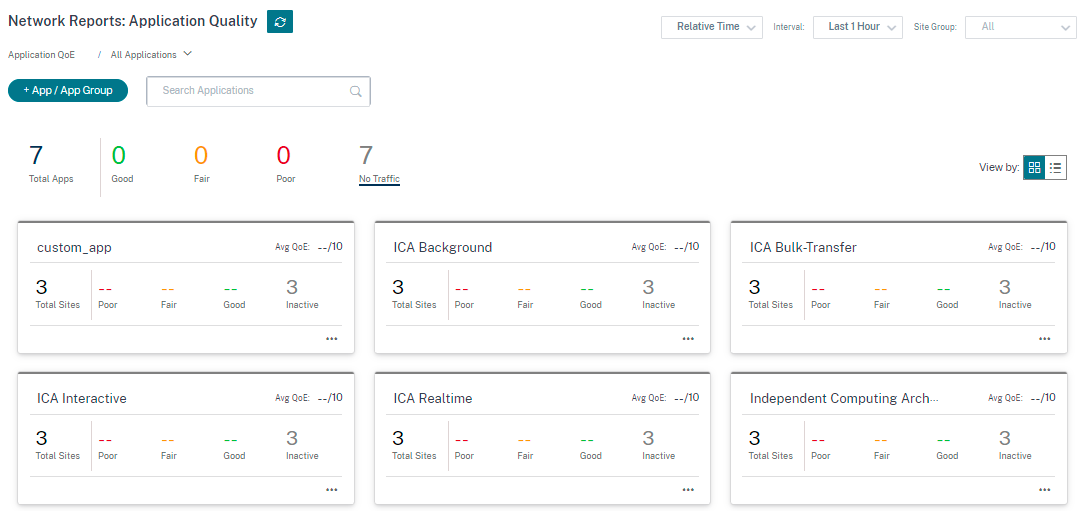
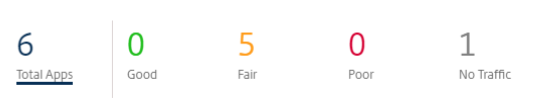
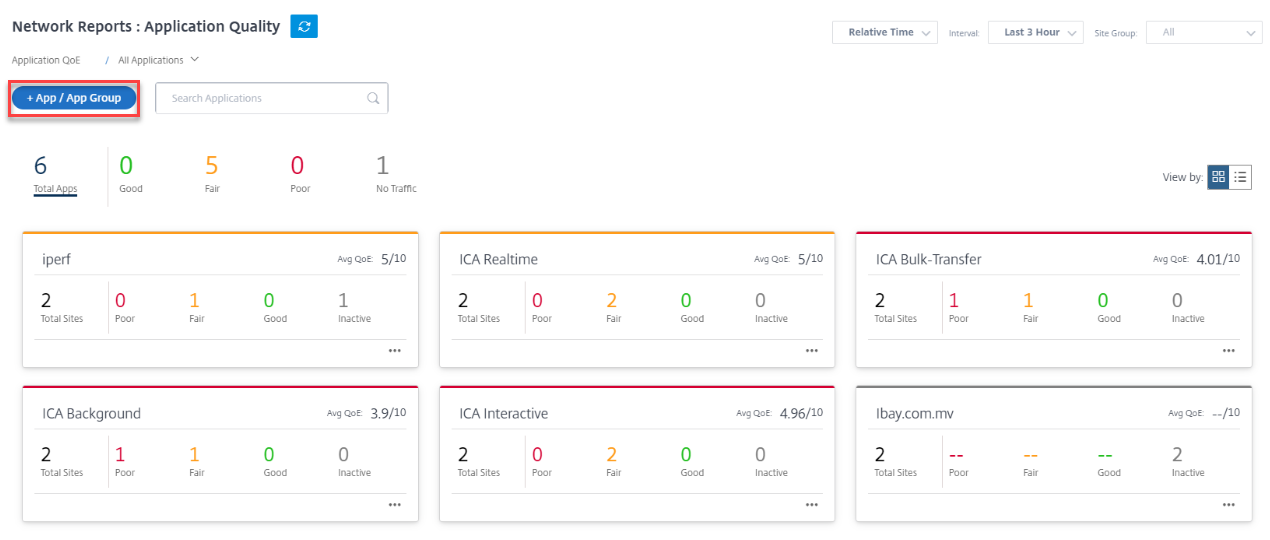
The top of the dashboard displays the overall number of applications and the number of applications that have good, fair, or poor Application QoE in the network. It also displays the number of applications that do not have any traffic.
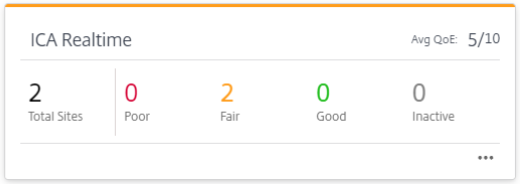
The individual application card displays the number of sites that have poor, fair, or good Application QoE for the specific application. It also displays the number of sites that are not actively using the application. The Avg QoE is the average QoE score of the application across all the sites in the network.
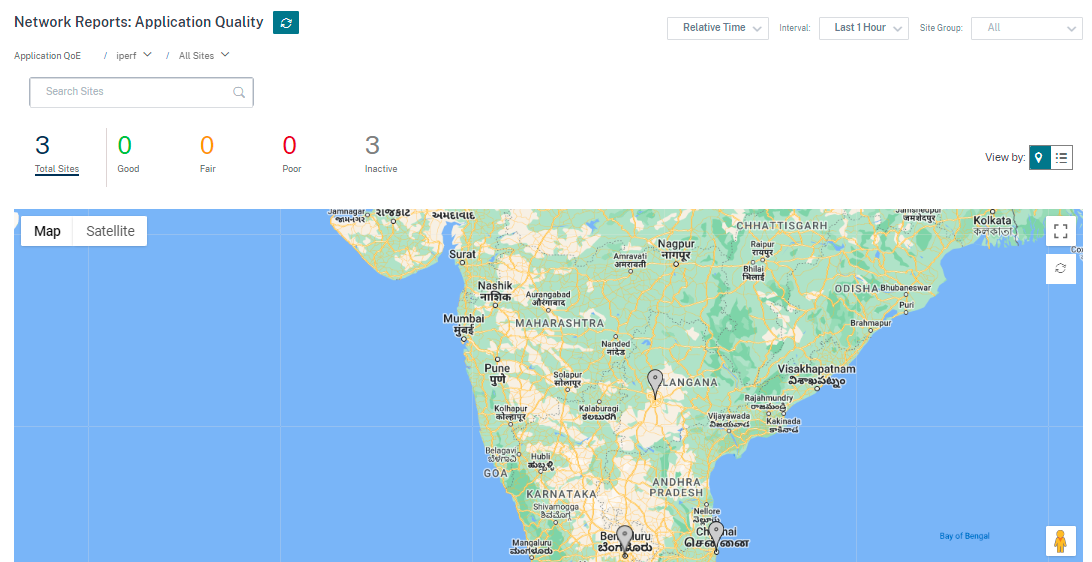
Click an individual application card to view the details on the number of sites that have good, fair, or poor application QoE for the selected application. A map view of all the sites that is running the selected application is displayed. Click a site in the map to further drill down and view the Application QoE statistics of the various virtual paths at the site.
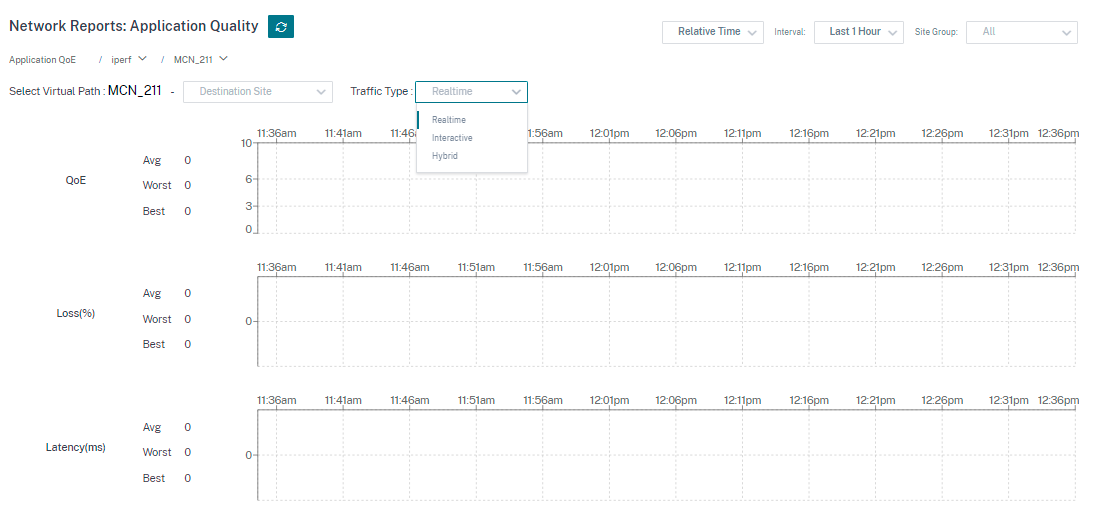
You can view the following metrics for Real-time, Interactive, and Hybrid traffic for the selected timeframe:
- QoE: The QoE score for the traffic.
- Loss: The loss percentage for the traffic.
- Latency: The latency in milliseconds for the traffic.
- Jitter: The jitter observed in milliseconds for the traffic.
Application QoE profiles
Click + App / App Group to map applications, custom applications, or application groups to the default or custom QoE profiles.
The QoE profiles define the threshold for real-time, interactive, and hybrid traffic. The QoE thresholds as per the QoE profiles are applied to the selected application or application group.
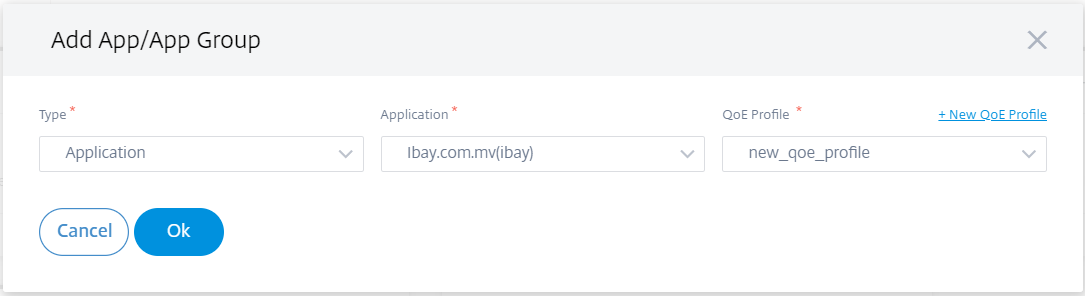
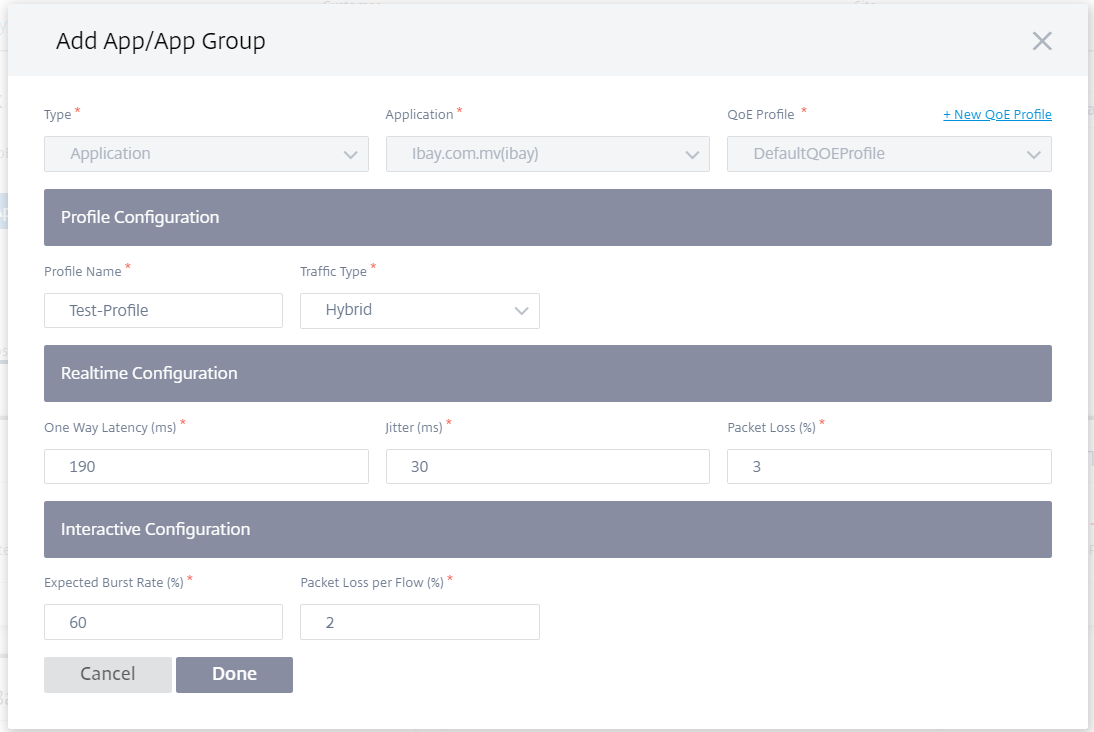
Click + New QoE Profile to create a new application QoE profile and enter the value for the following parameters:
- Profile Name: A name to identify the profile that sets thresholds for real-time and interactive traffic.
- Traffic Type: Choose the type of traffic – Real-time, Interactive, or Hybrid. If the traffic type is Hybrid, you can configure both Real-time and Interactive QoE profile thresholds.
-
Realtime Configuration: Configure thresholds for traffic flows that select the real-time QoS policy. A flow of a real-time application that meets the following thresholds for latency, loss, and jitter is considered to be of good quality.
- One Way latency: The latency threshold in milliseconds. The default QoE profile value is 160 ms.
- Jitter: The jitter threshold in milliseconds. The default QoE profile value is 30 ms.
- Packet Loss: The percentage of packet loss. The default QoE profile value is 2%.
-
Interactive Configuration: Configure thresholds for traffic flows that select the interactive QoS policy. A flow of an interactive application that meets the following threshold for burst ratio and packet loss is considered to be of good quality.
- Expected Burst Rate: The percentage of expected burst rate. The egress burst rate must be at least the configured percentage of ingress burst rate. The default QoE profile value is 60%.
- Packet loss per flow: The percentage of packet loss. The default QoE profile value is 1%.
The newly added application is displayed in the Application Quality dashboard.
You can also define and configure application QoE from App & DNS Settings for more information see, Application quality profiles and Application quality configuration.