Site reports
The Site Reports provide visibility into site-level alerts, usage trends, quality, device information, and firewall statistics.
Alerts
The site administrator can review a detailed report of all the events and alerts generated at the site level.
It includes the severity, site at which the alert originated, alert message, time, and other details.
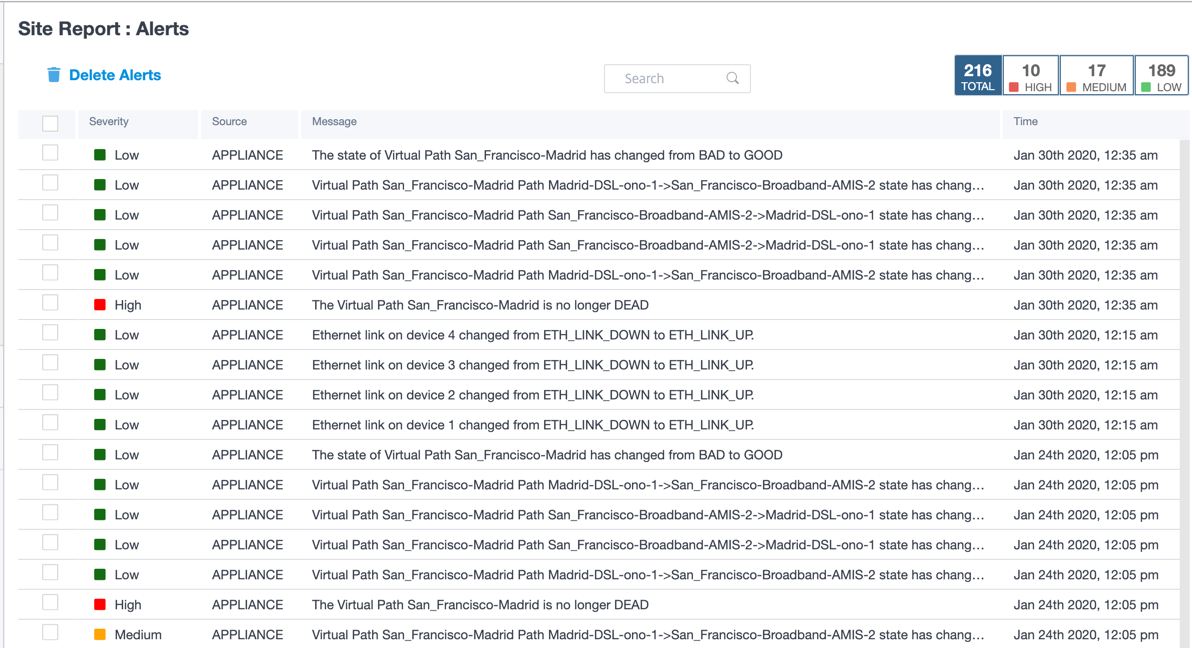
Suitable filtering options can be used as needed for example: Look for all the high severity alerts at the site or the alerts that occurred during a particular period.
You can also select and clear alerts.
Usage
Site administrators can review usage trends such as Top Applications, Top Application Categories, and App Bandwidth in a particular site.
Top applications and application categories
The Top Applications and Top Application Categories chart shows the top applications and top application families that are widely used in the site. This allows you to analyze the data consumption pattern and reassign the bandwidth limit for each class of data within the site.
You can also view the bandwidth usage statistics. The bandwidth statistics are collected for the selected time interval. You can filter the statistical report based on the Report Type, Apps or Apps Categories, and Metrics.
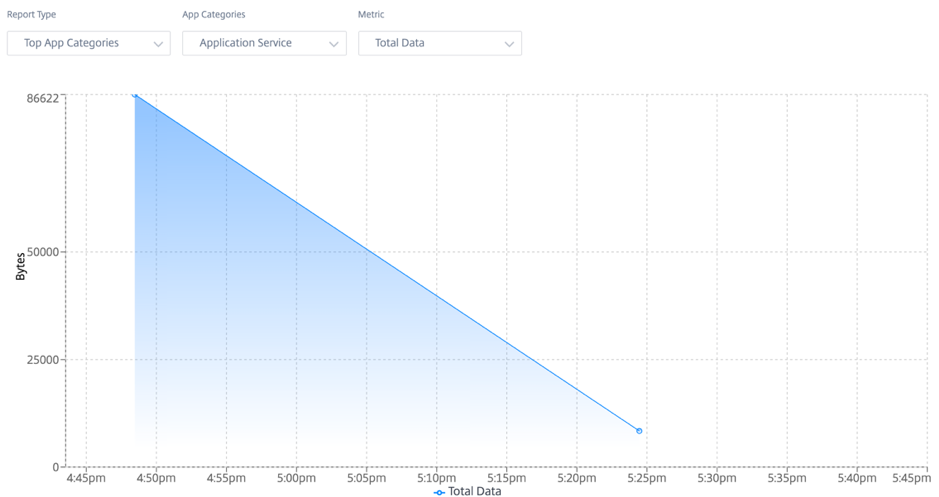
- Report Type: Select Top App or App Categories from the list.
- Apps/App Categories: Select top application or categories (such as network service) from the list.
- Metric: Select the bandwidth metric (such as Total Data, Incoming Data, Total Bandwidth) from the list.
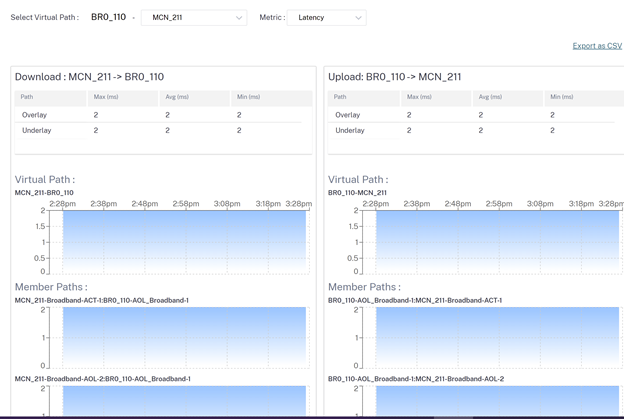
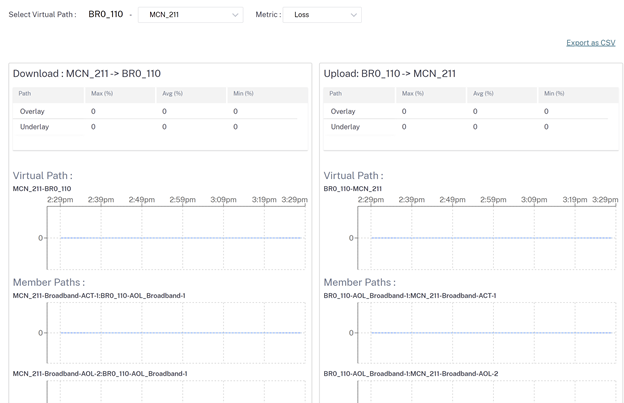
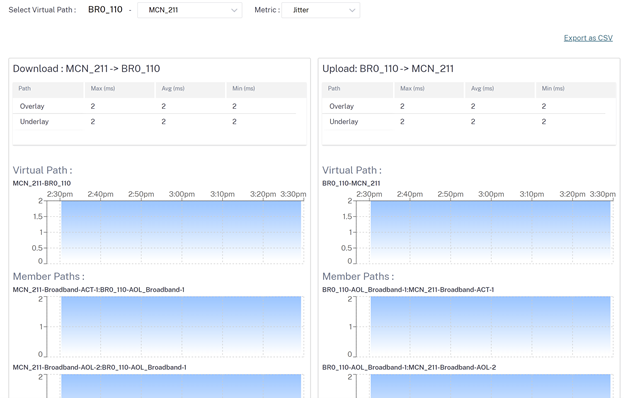
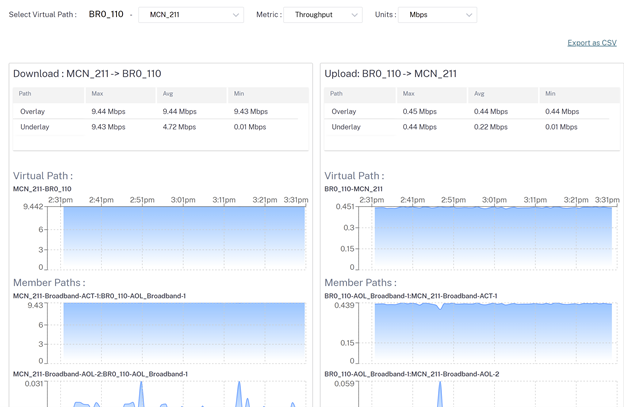
Quality
Site administrators can use the Quality reports to analyze the Quality of Experience (QoE) at the site for each QoS metric such as availability, loss, latency, and jitter. The quality metric is displayed for both the overlay virtual paths and its underlying member paths.
-
Availability
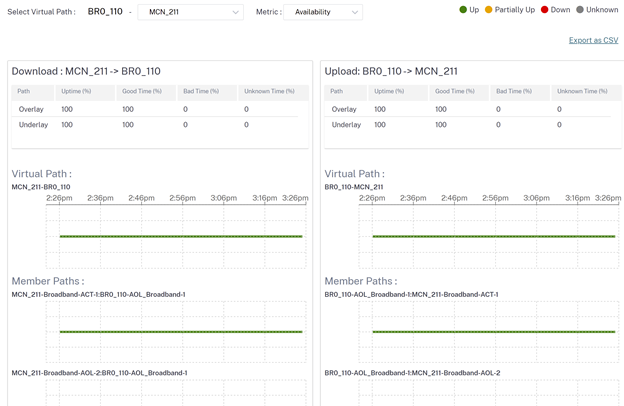
-
Latency
-
Loss
-
Jitter
-
Throughput
Export as CSV
With the Export as CSV capability, you can download the path graph points (virtual/member path) for any time series (hourly, weekly and so on) as an excel Comma-separated Value (CSV) file and be able to plot all distinct points of data for a particular site report.
To download/export the path graph as CSV, navigate to Reports > Quality at site level. Select the site and metric from the drop-down list and click the Export as CSV link.
Select the path you want to fetch the data for and click Download Graph Points.
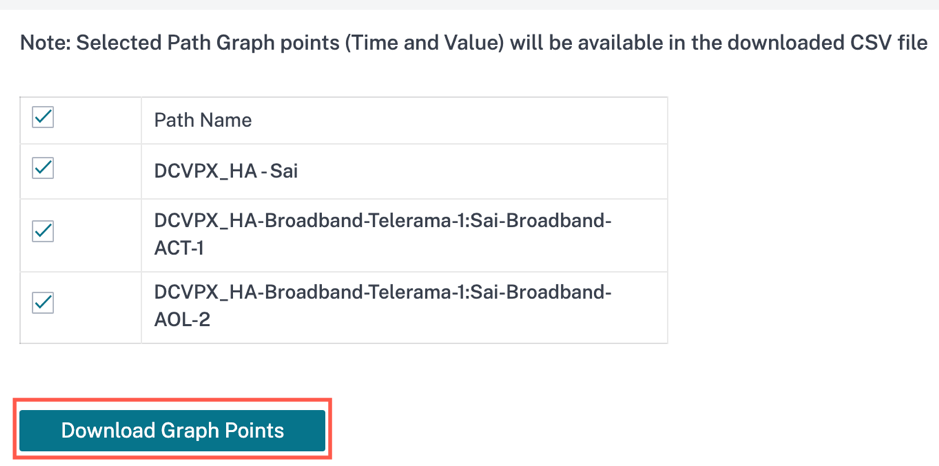
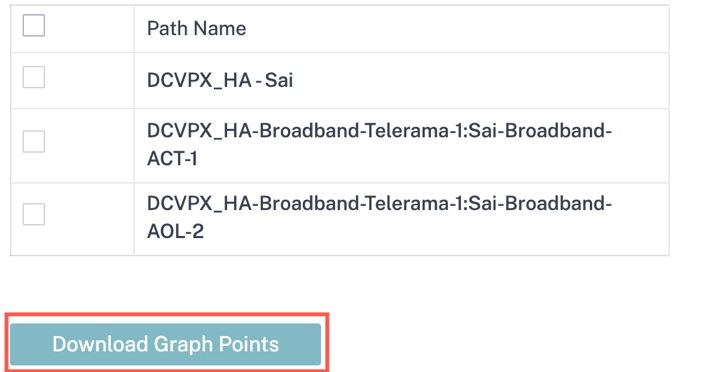
By default, all the path check boxes are auto selected. You can modify it as needed.
Note
If none of the paths is selected, the Download Graph Points button remains disabled.
The naming convention of the downloaded CSV file is SiteQuality followed by a timestamp of the download. You can view each path with a pair of time and value along with a unique identifier. You can see the time in milliseconds and the value as in unit.
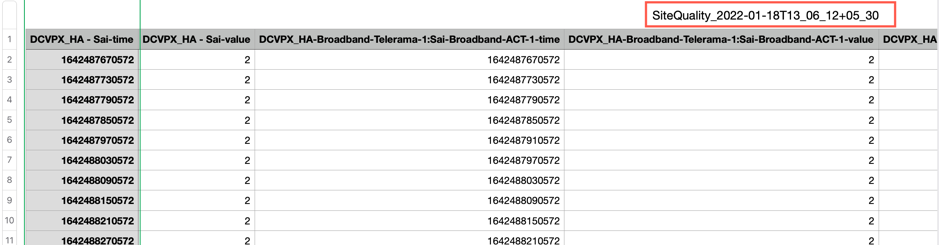
Based on the following metric selection, you can see different values are getting generated in the CSV file:
- Loss: Value shows in %.
- Latency and Jitter: Value shows in milliseconds.
- Throughput: Value shows in Kbps.
-
Availability: Shows the path up, partially up, down, and unknown time.
- If the value is 4, then the path is in Up state.
- If the value is 3, then the path is partially Up state.
- If the value is lesser than 3, then the path is in Bad/down state.
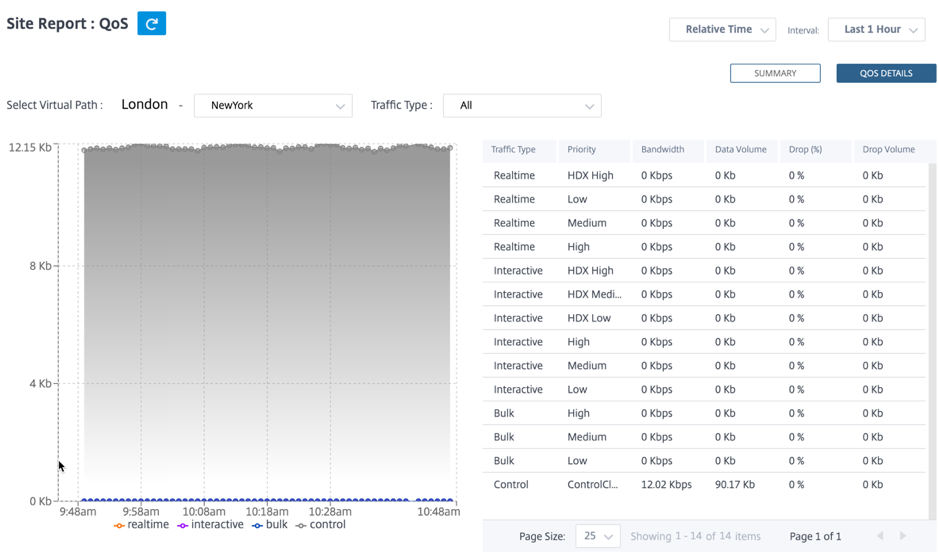
Quality of Service
Quality of Service (QoS) manages data traffic to reduce packet loss, latency, and jitter on the network. For more information, see Quality of Service. The following are two ways to view the Quality-of-Service (QoS) report:
-
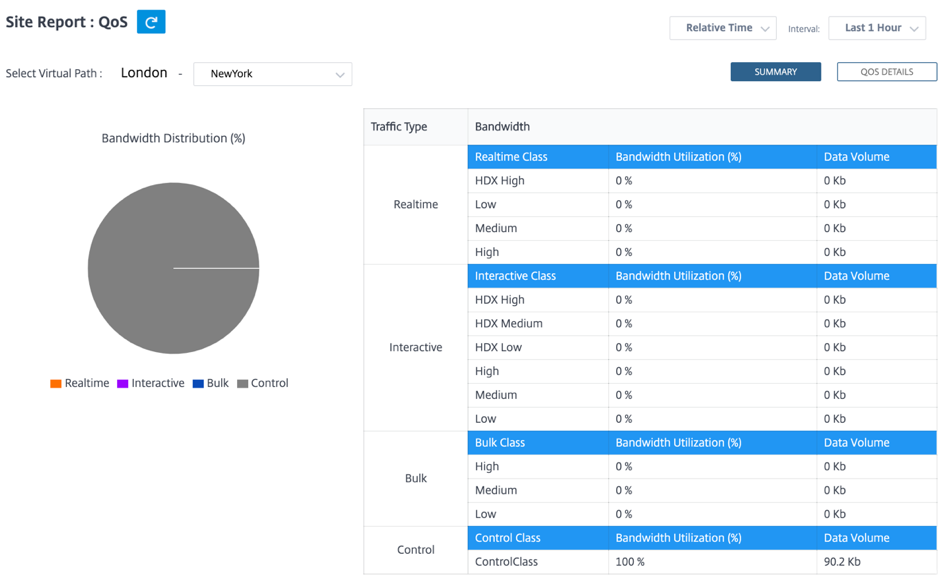
Summary View: Summary view provides an overview of bandwidth consumption across all types of traffic - real-time, interactive, bulk, and control across the network and per site.
-
Real-time: Used for low latency, low bandwidth, time-sensitive traffic. Real-time applications are time sensitive but don’t really need high bandwidth (for example voice over IP). Real-time applications are sensitive to latency and jitter, but can tolerate some loss.
-
Interactive: Used for interactive traffic with low to medium latency requirements and low to medium bandwidth requirements. Interactive applications involve human input in the form of mouse clicks or cursor moves. The interaction is typically between a client and a server. The communication might not need high bandwidth but is sensitive to loss and latency. However, server to client does need high bandwidth to transfer graphical information, which might not be sensitive to loss.
-
Bulk: Used for high bandwidth traffic that can tolerate high latency. Applications that handle file transfer and need high bandwidth are categorized as bulk class. These applications involve little human interference and are mostly handled by the systems themselves.
-
Control: Used to transfer control packets that contain routing, scheduling, and link statistics information.
-
-
Detailed View: The detailed view captures trends around bandwidth consumption, traffic volume, packets dropped and so on For each QoS class associated with an overlay virtual path. You can view QoS statistics based on the virtual path between two sites.
Historical statistics
For each site, you can view the statistics as graphs for the following network parameters:
- Virtual Paths
- Paths
- WAN Links
- Interfaces
- Classes
- Services
- GRE Tunnels
- IPsec Tunnels
The statistics are collected as graphs. These graphs are plotted as timeline versus usage, allowing you to understand the usage trends of various network object properties. You can view graphs for network-wide application statistics.
You can view or hide the graphs and customize the columns as needed.
Virtual paths
To view the Virtual Paths statistics, navigate to Reports > Statistics > Virtual Paths tab.
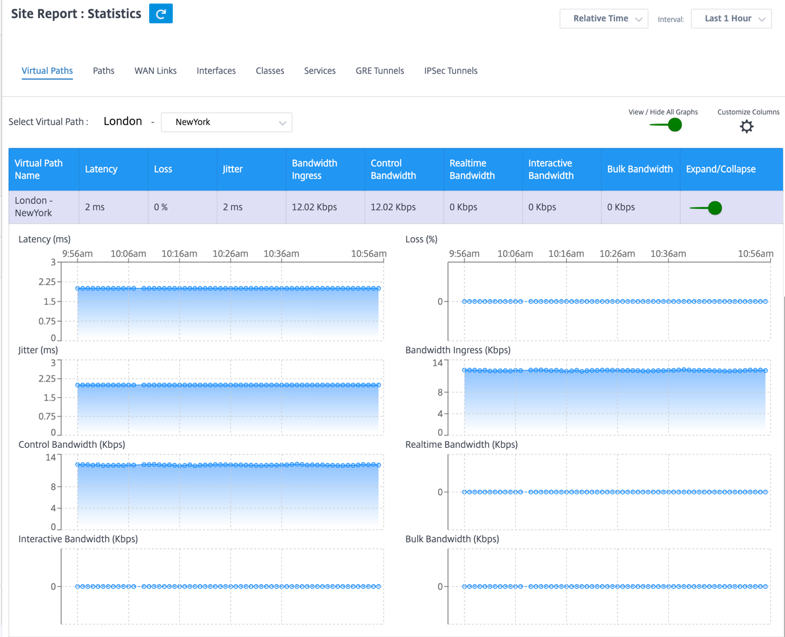
You can view the following metrics:
- Virtual Path Name: The virtual path name.
- Latency: The latency in milliseconds for real time traffic.
- Loss: Percentage of packets lost.
- Jitter: Variation in the delay of received packets, in milliseconds.
- Bandwidth Ingress: Ingress (LAN > WAN) Bandwidth usage for the selected time period.
- Control Bandwidth: Bandwidth used to transfer control packets that contain routing, scheduling, and link statistics information.
- Real-time Bandwidth: Bandwidth consumed by applications that belong to the real-time class type in the SD-WAN configuration. The performance of such applications depends on a great extent upon network latency. A delayed packet is worse than a lost packet (for example, VoIP, Skype for Business).
- Interactive Bandwidth: Bandwidth consumed by applications that belong to the interactive class type in the SD-WAN configuration. The performance of such applications depends on a great extent upon network latency, and packet loss (for example, XenDesktop, XenApp).
- Bulk Bandwidth: Bandwidth consumed by applications that belong to the bulk class type in the SD-WAN configuration. These applications involve little human intervention and are mostly handled by the systems themselves (for example, FTP, backup operations).
- Expand/Collapse: You can expand or collapse the data as needed.
Paths
To view the Paths statistics, navigate to Reports > Statistics > Paths tab.
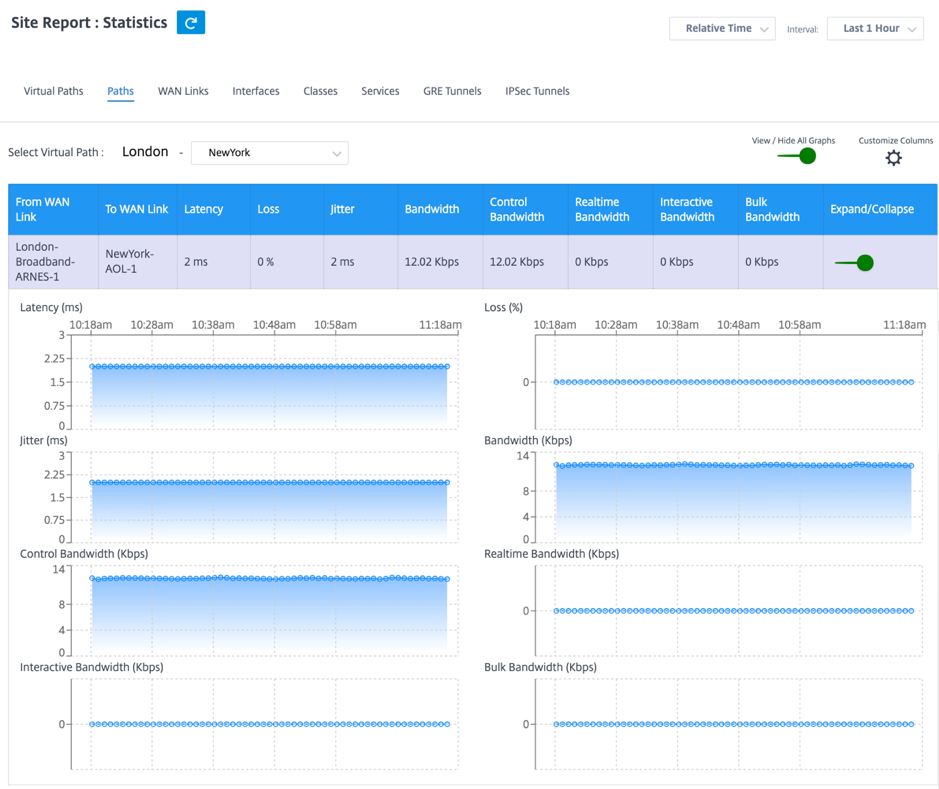
You can view the following metrics:
- From WAN Link: The source WAN link.
- To WAN Link: The destination WAN link.
- Latency: The latency in milliseconds for real time traffic.
- Loss: Percentage of packets lost.
- Jitter: Variation in the delay of received packets, in milliseconds.
- Bandwidth: Total bandwidth consumed by all packet types. Bandwidth= Control Bandwidth + Real-time Bandwidth + Interactive Bandwidth + Bulk Bandwidth.
- Control Bandwidth: Bandwidth used to transfer control packets that contain routing, scheduling, and link statistics information.
- Real-time Bandwidth: Bandwidth consumed by applications that belong to the real-time class type in the SD-WAN configuration. The performance of such applications depends on a great extent upon network latency. A delayed packet is worse than a lost packet (for example, VoIP, Skype for Business).
- Interactive Bandwidth: Bandwidth consumed by applications that belong to the interactive class type in the SD-WAN configuration. The performance of such applications depends on a great extent upon network latency, and packet loss (for example, XenDesktop, XenApp).
- Bulk Bandwidth: Bandwidth consumed by applications that belong to the bulk class type in the SD-WAN configuration. These applications involve little human intervention and are mostly handled by the systems themselves (for example, FTP, backup operations).
- Expand/Collapse: You can expand or collapse the data as needed.
WAN links
To view the statistics at WAN Link level, navigate to Reports > Statistics > WAN Links tab.
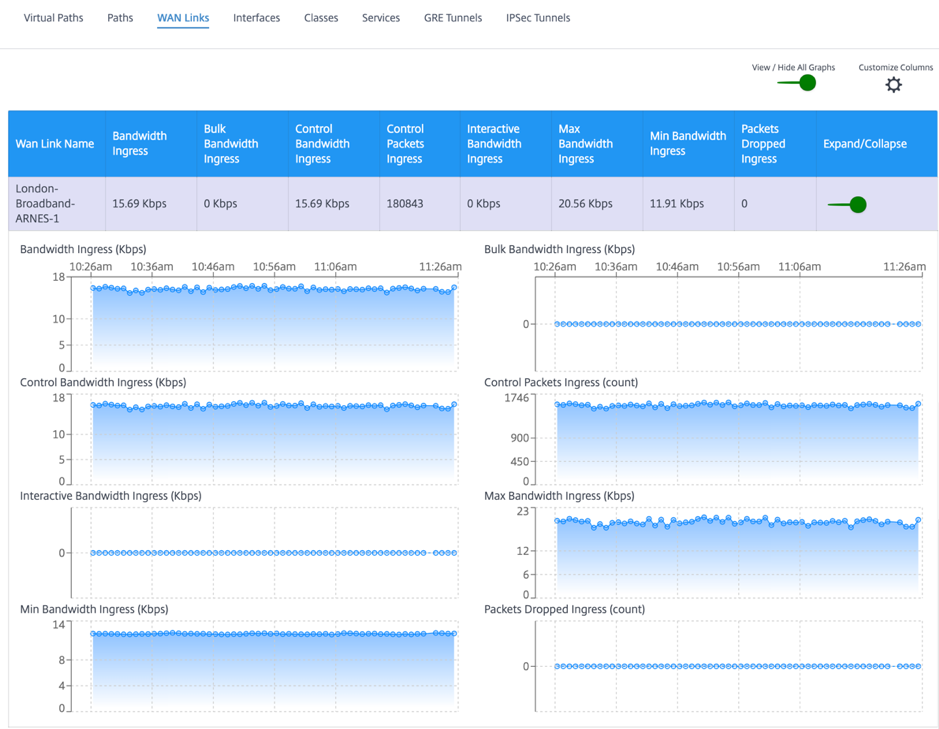
You can view the following metrics:
- WAN Link Name: The path name.
- Bandwidth Ingress: Ingress (LAN > WAN) Bandwidth usage for the selected time period.
- Bulk Bandwidth Ingress: Ingress (LAN > WAN) virtual path bandwidth used by Bulk traffic for the selected time period.
- Control Bandwidth Ingress: Ingress (LAN > WAN) virtual path bandwidth used by Control traffic for the selected time period.
- Control Packet Ingress: Ingress (LAN > WAN) Virtual Path Control packets for the selected time period.
- Interactive Bandwidth Ingress: Ingress (LAN > WAN) virtual path bandwidth used by Interactive traffic for the selected time period.
- Max Bandwidth Ingress: Maximum ingress (LAN > WAN) bandwidth used in a minute for the selected time period.
- Min Bandwidth Ingress: Minimum ingress (LAN > WAN) bandwidth used in a minute for the selected time period.
- Expand/Collapse: You can expand or collapse the data as needed.
Interfaces
The Interfaces statistical report helps you during troubleshooting to quickly see whether any of the ports are down. You can also view the transmitted and received bandwidth, or packet details at each port. You can also view the number of errors that occurred on these interfaces during a certain time period.
To view Interface statistics, navigate to Reports > Statistics > Interfaces tab.
You can view the following metrics:
- Interface Name: The name of the Ethernet interface.
- Tx Bandwidth: Bandwidth transmitted.
- Rx Bandwidth: Bandwidth received.
- Errors: Number of errors observed during the selected time period.
- Expand/Collapse: You can expand or collapse the data as needed.
Classes
The virtual services can be assigned to particular QoS classes, and different bandwidth restraints can be applied to different classes.
To view Class statistics, navigate to Reports > Statistics > Classes tab.
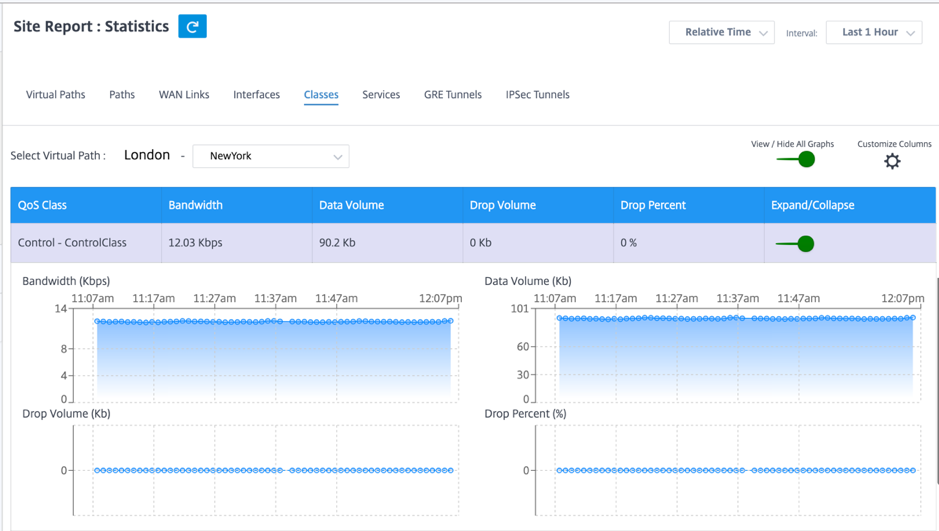
You can view the following metrics:
- QoS Class: The class name.
- Bandwidth: Transmitted bandwidth.
- Data Volume: Data sent, in Kbps.
- Drop Volume: Percentage of data dropped.
- Drop Percent: Percentage of data dropped.
- Expand/Collapse: You can expand or collapse the data as needed.
Services
To view the Services statistics, navigate to Reports > Statistics > Services tab.
Select the service type from the list. The options are as follows:
-
Passthrough – This service manages traffic that is not intercepted, delayed, shaped, or changed by the SD-WAN. Traffic directed to the Passthrough Service includes broadcasts, ARPs, and other non-IPv4 traffic, and traffic on the Virtual WAN Appliance local subnet, configured subnets, or Rules applied by the Network Administrator. This traffic is not delayed, shaped, or changed by the SD-WAN. Therefore, you must ensure that Passthrough traffic does not consume substantial resources on the WAN links that the SD-WAN Appliance is configured to use for other services.
-
Intranet – This service manages Enterprise Intranet traffic that has not been defined for transmission across a Virtual Path. As with Internet traffic, it remains unencapsulated, and the SD-WAN manages bandwidth by rate-limiting this traffic relative to other service types during times of congestion. Under certain conditions, and if configured for Intranet Fallback on the Virtual Path, traffic that ordinarily travels with a Virtual Path can instead be treated as Intranet traffic, to maintain network reliability.
-
Internet – This service manages traffic between an Enterprise site and sites on the public Internet. Traffic of this type is not encapsulated. During times of congestion, the SD-WAN actively manages bandwidth by rate-limiting Internet traffic relative to the Virtual Path, and Intranet traffic according to the SD-WAN configuration established by the Administrator.
You can view the following metrics:
- Site Name: The site name.
- Bandwidth Ingress: Ingress (LAN > WAN) Bandwidth usage for the selected time period.
- Packet Ingress: (LAN > WAN) Packets sent for the selected time interval.
- Expand/Collapse: You can expand or collapse the data as needed.
GRE tunnels
You can use a tunneling mechanism to transport packets of one protocol within another protocol. The protocol that carries the other protocol is called the transport protocol, and the carried protocol is called the passenger protocol. Generic Routing Encapsulation (GRE) is a tunneling mechanism that uses IP as the transport protocol and can carry many different passenger protocols.
The tunnel source address and destination address are used to identify the two endpoints of the virtual point-to-point links in the tunnel. For more information about configuring GRE tunnels on Citrix SD-WAN appliances, see GRE Tunnel.
To view GRE Tunnel statistics, navigate to Reports > Statistics > GRE Tunnels tab.
You can view the following metrics:
- Site Name: The site name.
- Tx Bandwidth: Bandwidth transmitted.
- Rx Bandwidth: Bandwidth received.
- Packet Dropped: Number of packets dropped, because of network congestion.
- Packets Fragmented: Number of packets fragmented. Packets are fragmented to create smaller packets that can pass through a link with an MTU that is smaller than the original datagram. The fragments are reassembled by the receiving host.
- Expand/Collapse: You can expand or collapse the data as needed.
IPsec tunnels
IP Security (IPsec) protocols provide security services such as encrypting sensitive data, authentication, protection against replay, and data confidentiality for IP packets. Encapsulating Security Payload (ESP), and Authentication Header (AH) are the two IPsec security protocols used to provide these security services.
In IPsec tunnel mode, the entire original IP packet is protected by IPsec. The original IP packet is wrapped and encrypted, and a new IP header is added before transmitting the packet through the VPN tunnel. For more information about configuring IPsec tunnels on Citrix SD-WAN appliances, see IPsec Tunnel Termination.
To view IPsec Tunnel statistics, navigate to Reporting > statistics > IPsec Tunnels tab.
You can view the following metrics:
- Tunnel Name: The tunnel name.
- Tunnel State: IPsec tunnel state.
- MTU: Maximum transmission unit—size of the largest IP datagram that can be transferred through a specific link.
- Packet Received: Number of packets received.
- Packets Sent: Number of packets Sent.
- Packet Dropped: Number of packets dropped, because of network congestion.
- Bytes Dropped: Number of bytes dropped.
- Expand/Collapse: You can expand or collapse the data as needed.
Real time statistics
Network Statistics
You can get the following real time statistical information under Reports > Real Time > Network Statistics:
- Site
- Virtual Paths
- WAN Member Paths
- WAN Links
- WAN Link Usage
- MPLS Queues
- Access Interfaces
- Interfaces
- Intranet
- IPsec Tunnel
- GRE
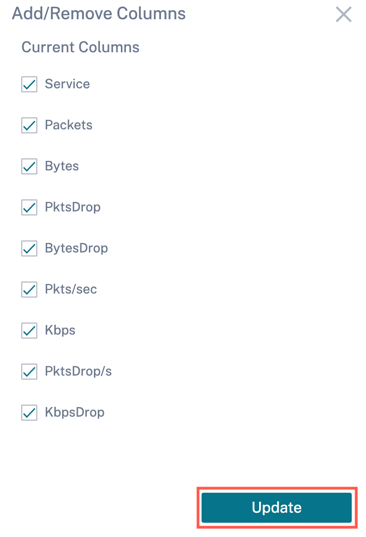
To get the real time statistical report, go to the required tab (such as site, virtual paths, WAN links) and click Retrieve latest data.
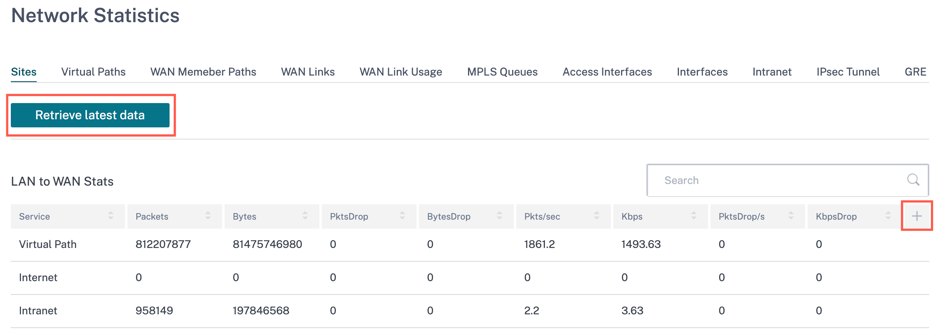
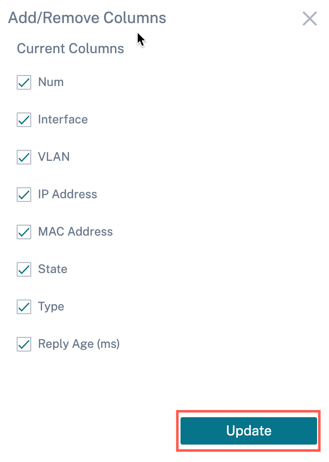
Click the plus (+) symbol if you want to add or remove any column from the statistics table and click Update.
MPLS Queues
MPLS queues allow you to define the queues corresponding to the Service Provider MPLS queues, on the MPLS WAN Links. For information on configuring MPLS queues, see MPLS Queues.
To view MPLS Queue statistics, at the site level, navigate to Reports > Real Time > Network Statistics. Click MPLS Queues, and click Retrieve latest data. The latest MPLS queues data is retrieved from the appliance and is displayed in the Citrix SD-WAN Orchestrator for On-premises.
You can view the direction, no of packets, delta packets, and mismatched DSCP packets for Intranet and Virtual path services.
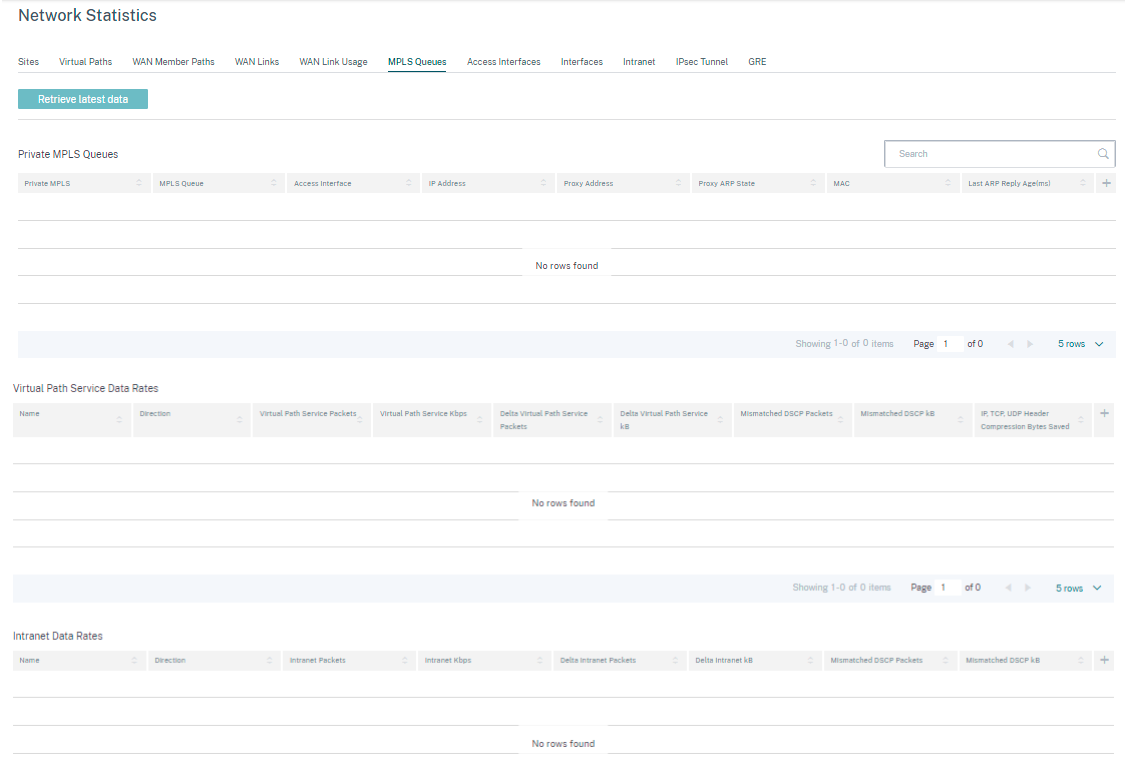
For private MPLS Queues, you can view the following details:
- Private MPLS: The private MPLS WAN link.
- MPLS Queue: The MPLS queue associated with the MPLS WAN link.
- Access Interface: The access interface associated with the MPLS queue.
- IP Address: The IP address associated with the MPLS queue.
- Proxy Address: The proxy IP address associated with the MPLS queue.
- Proxy ARP State: The state of proxy address resolution protocol. Enabled, disabled, or N/A
- MAC: The MAC address of the interface associated with the MPLS queue.
- Last ARP Reply age: Time in milliseconds when the last ARP reply was received.
For more details on troubleshooting, see Troubleshooting MPLS queues.
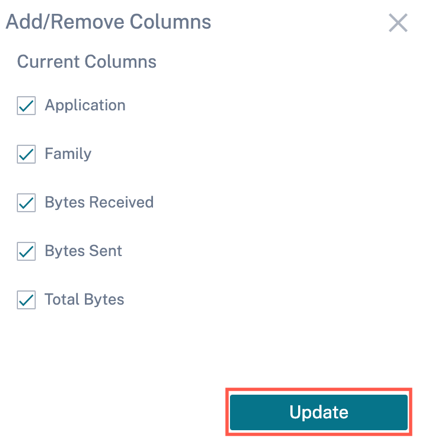
App statistics
You can get the following real time statistical information under Reports > Real Time > App Statistics:
- Applications
- Observed Protocols
- App QoS
- QoS Classes
- QoS Rules
- Rule Groups
To get the real time statistical report, go to the required tab (such as applications, App QoS, QoS rule) and click Retrieve latest data.
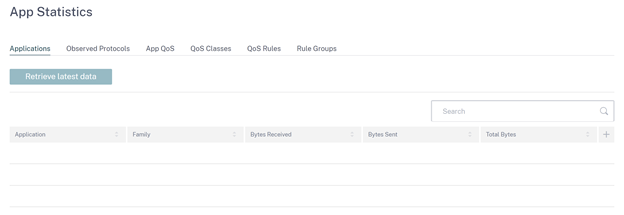
Click the plus (+) symbol if you want to add or remove any column from the statistics table and click Update.
Route statistics
You can get the following real time route statistical information under Reports > Real Time > Route Statistics:
- ARP (Address Resolution Protocol)
- Routes
- App Routes
- Observed Protocols
- Multicast group
- NDP Rule Groups
To get the real time statistical report, go to the required tab (such as ARP, Routes, App Routes) and click Retrieve latest data.
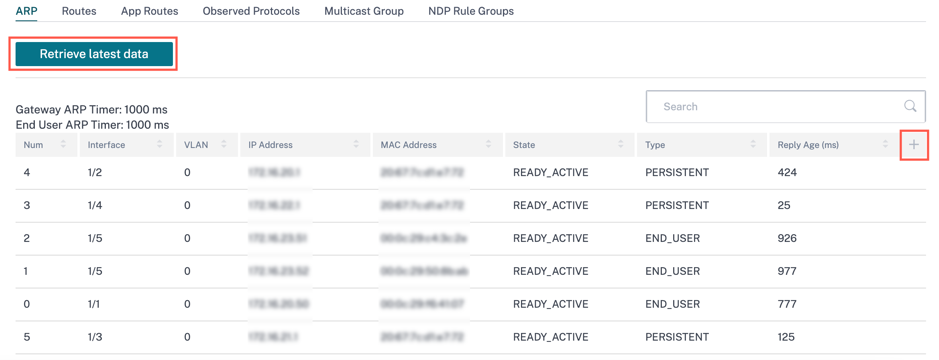
Click the plus (+) symbol if you want to add or remove any column from the statistics table and click Update.
Firewall statistics
The Firewall statistics page provides the state of the connection, Network Address Protocol (NAT) policies, filter policies related to a particular session based on the firewall action configured. Firewall connections also provide complete details about the source and destination of the connection.
You can get the real time firewall statistical information under Reports > Real Time > Firewall Statistics. Select the statistics type from the drop-down list (Connection, NAT Policies, Filter Policies). Select the number for maximum entries to display, and click Retrieve latest data.
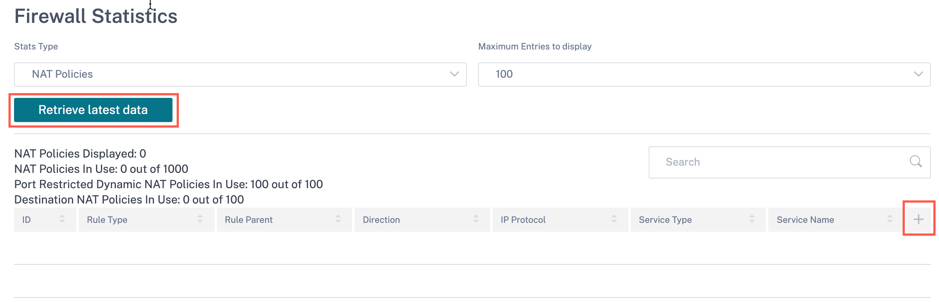
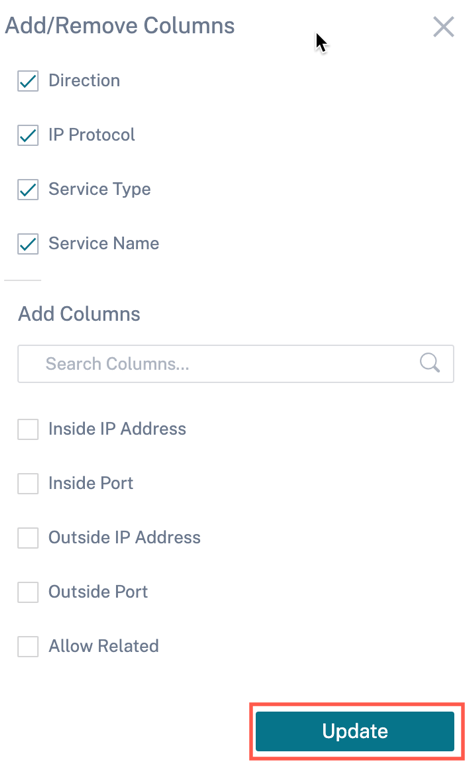
Click the plus (+) symbol if you want to add or remove any column from the statistics table and click Update.
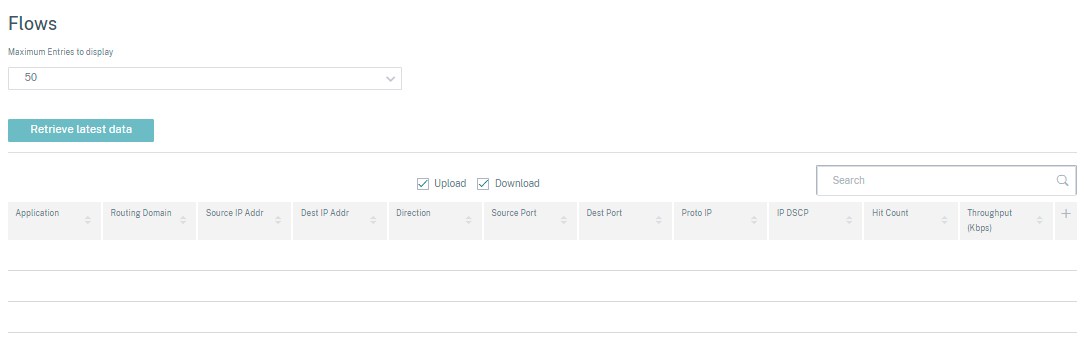
Flows
The Flows feature provides unidirectional flow information related to a particular session going through the appliance. This provides information on the destination service type the flow is falling into and also the information related to the rule and class type and also the transmission mode.
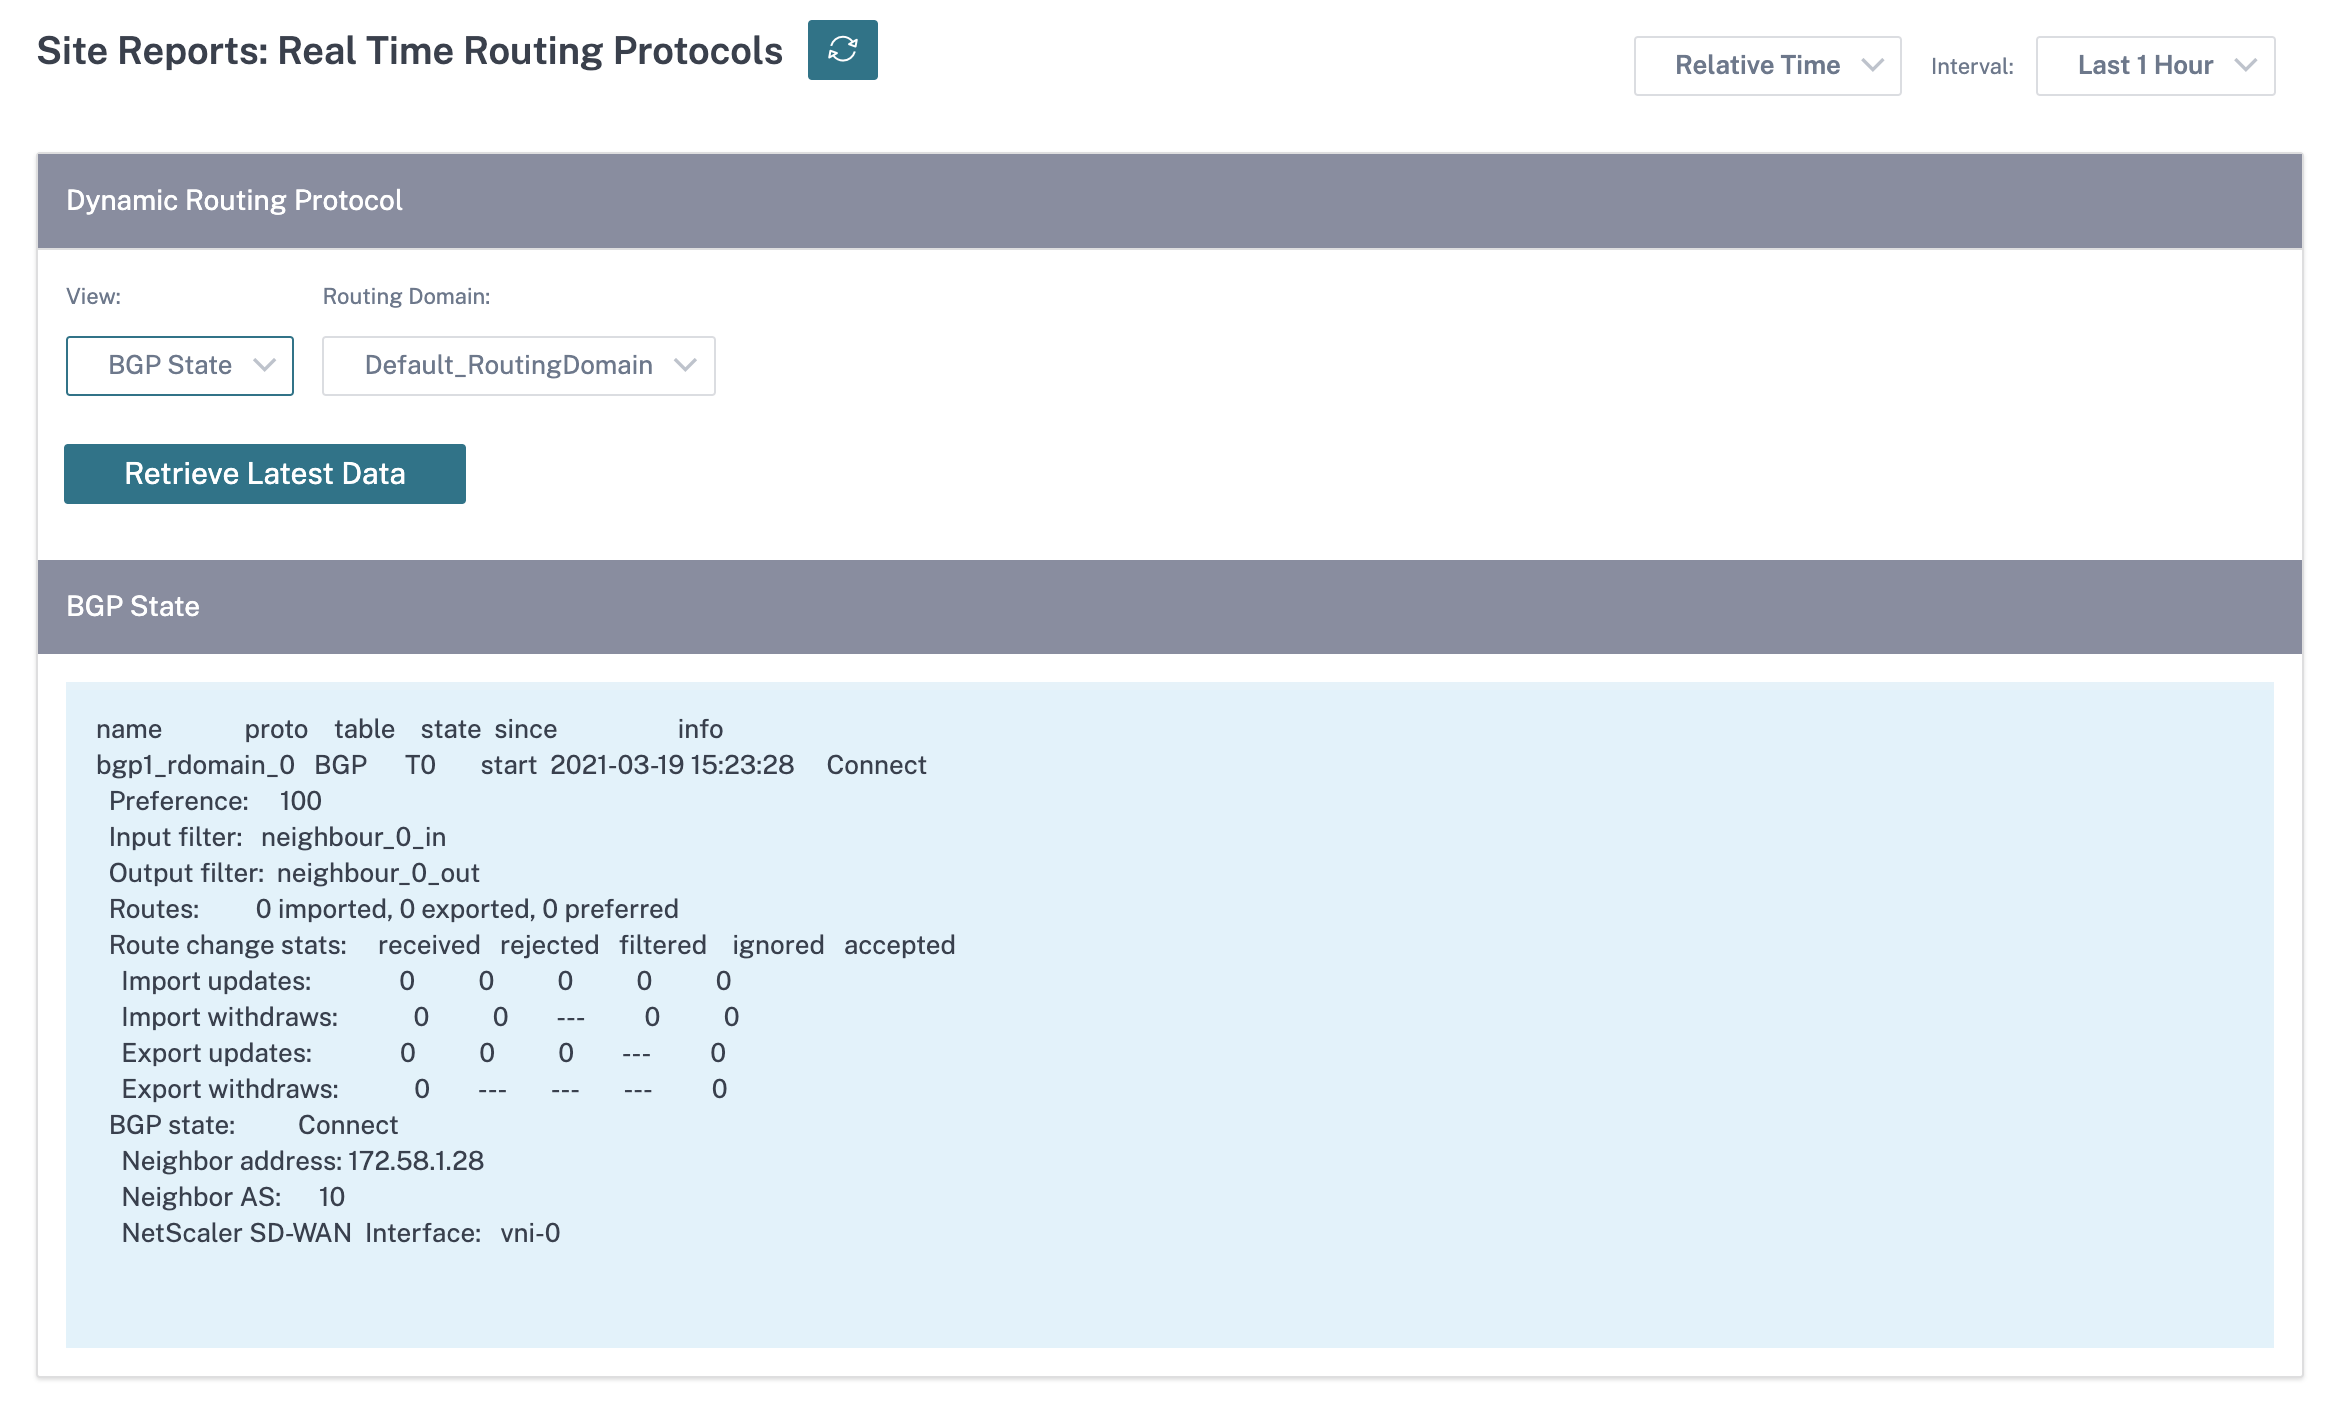
Routing Protocols
The Routing Protocols report provides the details of the parameters associated with the routing protocols. Choose a protocol from the View drop-down list and a routing domain from the Routing Domain drop-down list. Click Retrieve Latest Data to view the current data.
You can view the parameter details associated with the following:
- BGP State
- OSPF State
- OSPF Topology
- OSPF Interface
- OSPF LSADB
- OSPF Neighbors
- Route Table
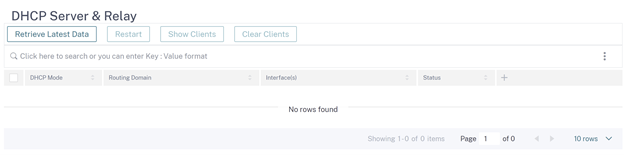
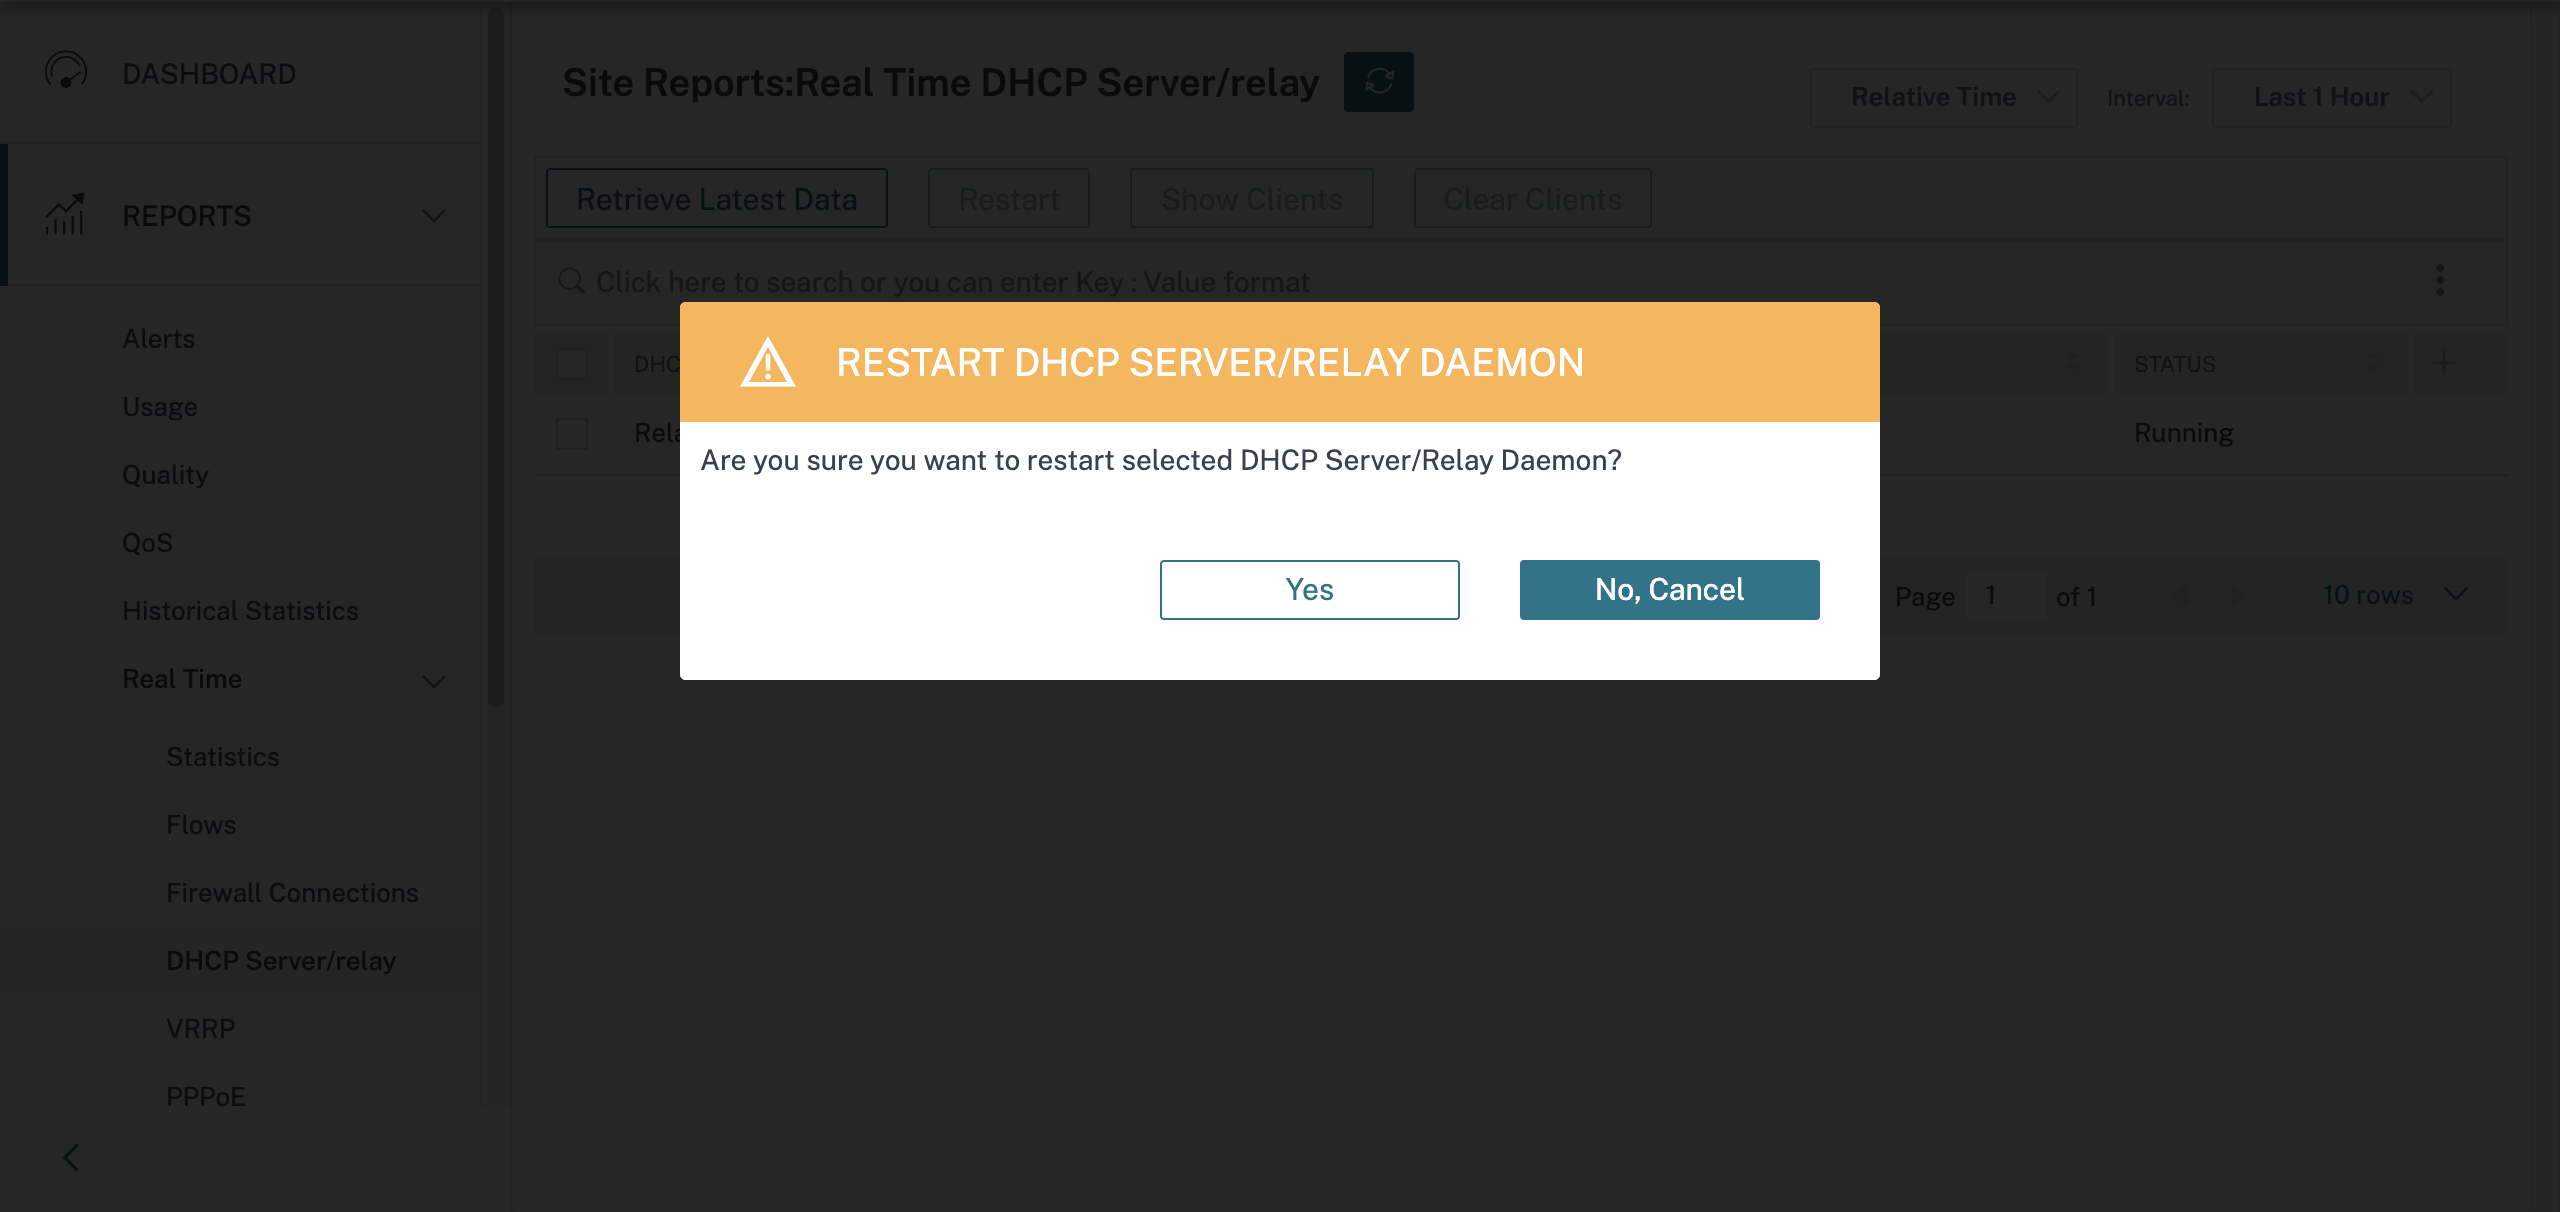
DHCP Server & Relay
The DHCP Server/Relay report provides the information on the interfaces configured as DHCP Server or Relay and its associated routing domain and status. You can search for the required DHCP server or relay information using the Key: Value format.
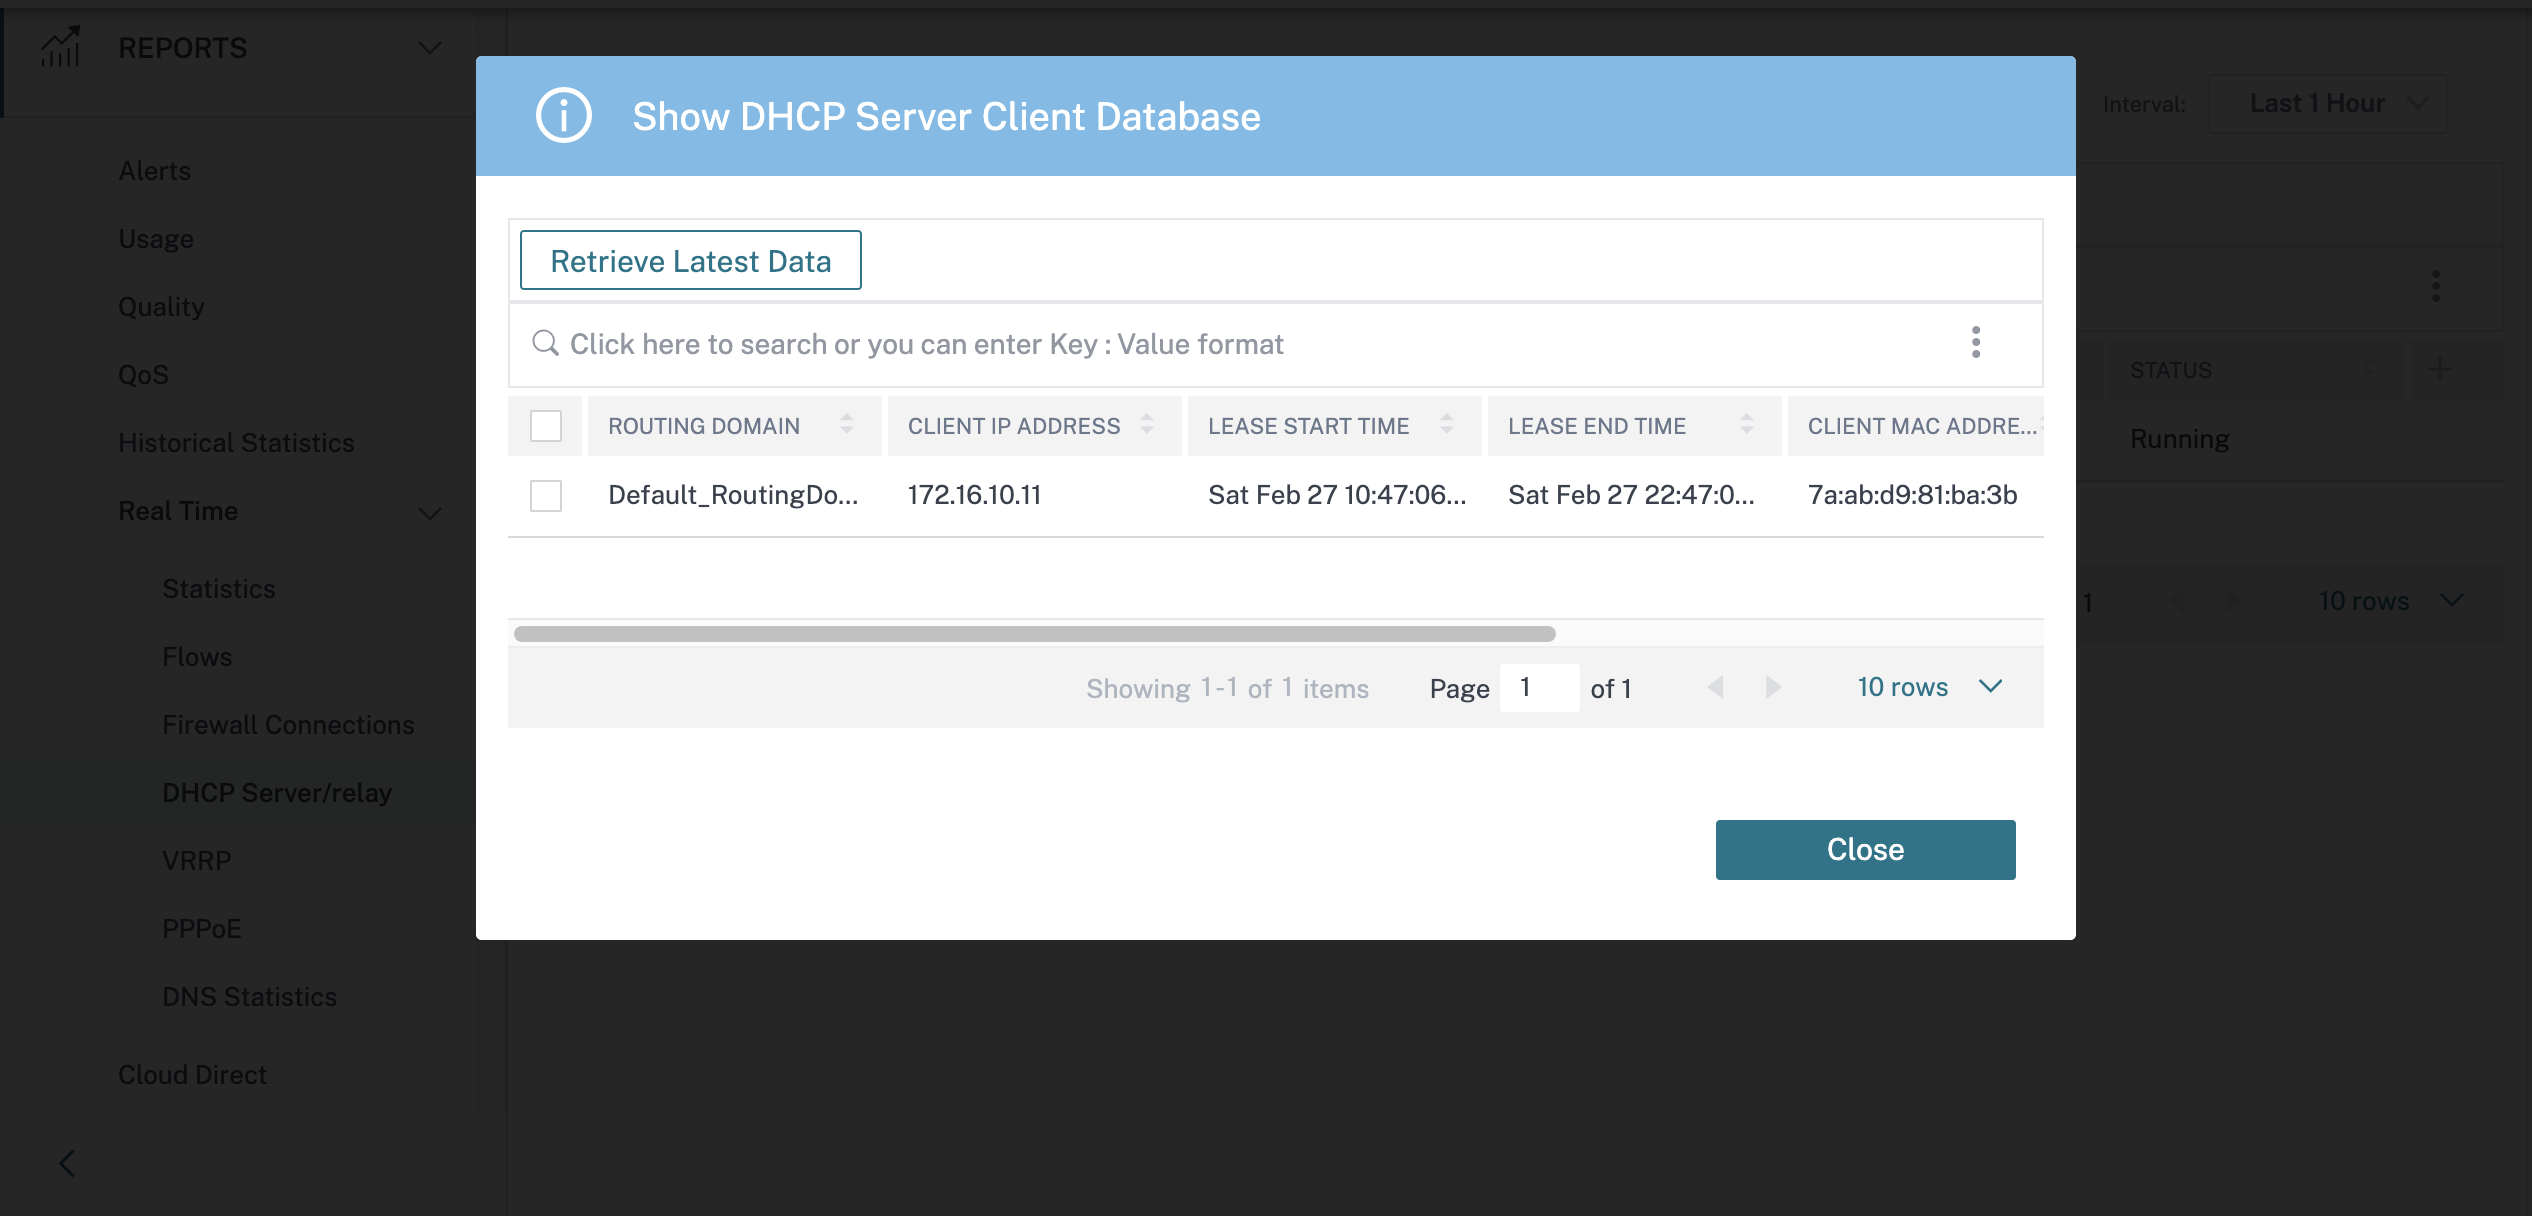
If the mode is Server, you can click Show Clients and view the list of DHCP clients associated with the DHCP server.
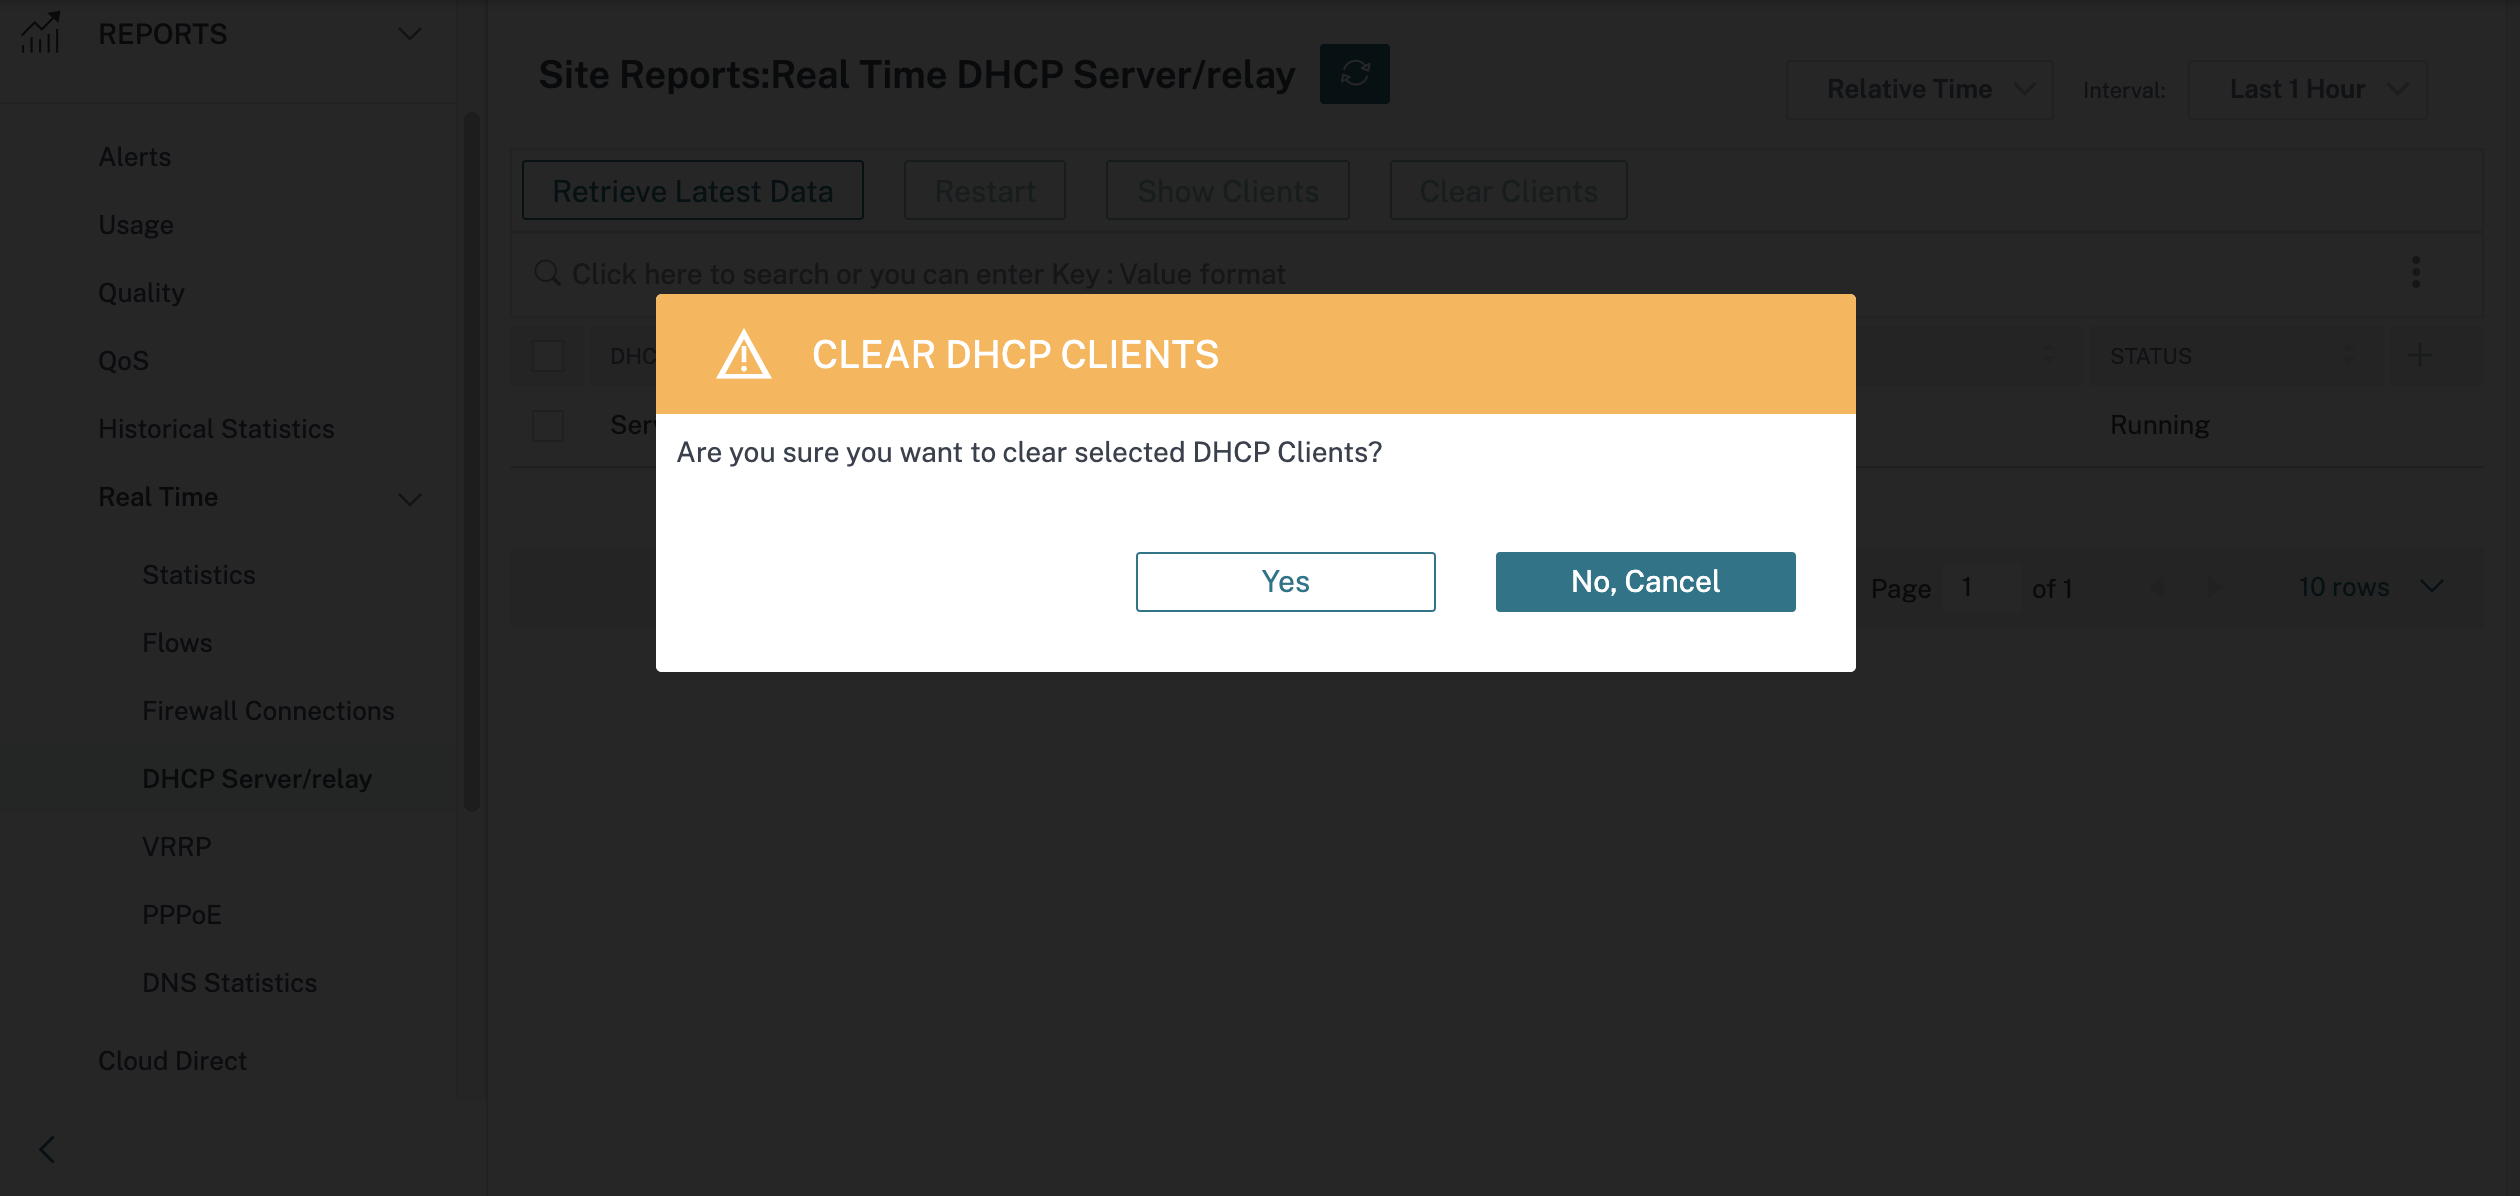
Click Clear Clients to remove the DHCP clients that are currently associated with the DHCP server.
Click Restart to restart the DHCP Server or Relay.
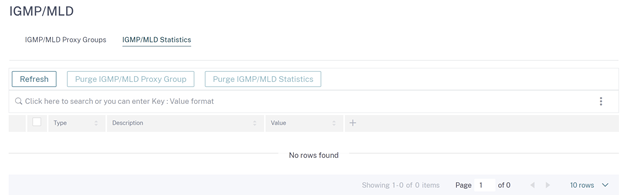
IGMP/MLD
When the multicast receivers initiate a join group request, you can see the receiver details under Reports > Real Time > IGMP/MLD > IGMP/MLD Statistics. You can see this information at both the source and the destination. Click Refresh to get the current data.
The following image shows that the IGMP packets received and the filter type RECV is used to include IGMP receive packets.
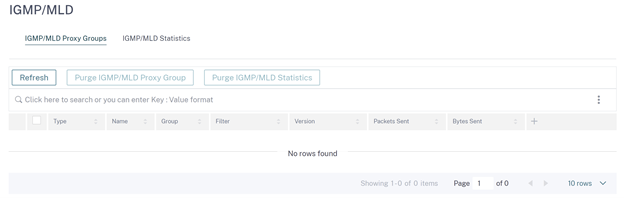
To view the details of IGMP proxy groups, navigate to Reports > Real Time > IGMP/MLD > IGMP/MLD Proxy Groups. Click Refresh to get the current data.
Select Purge IGMP/MLD Statistics to remove IGMP statistical data from the IGMP stats table.
Select Purge IGMP/MLD Groups to remove IGMP group data from the IGMP groups table.
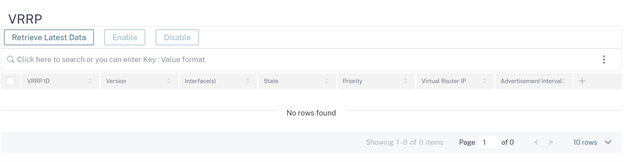
VRRP
The VRRP real-time report provides details about the configured VRRP groups. To view Virtual Router Redundancy Protocol (VRRP) report, navigate to Reports > Real Time > VRRP. Click Retrieve Latest Data to get the current data.
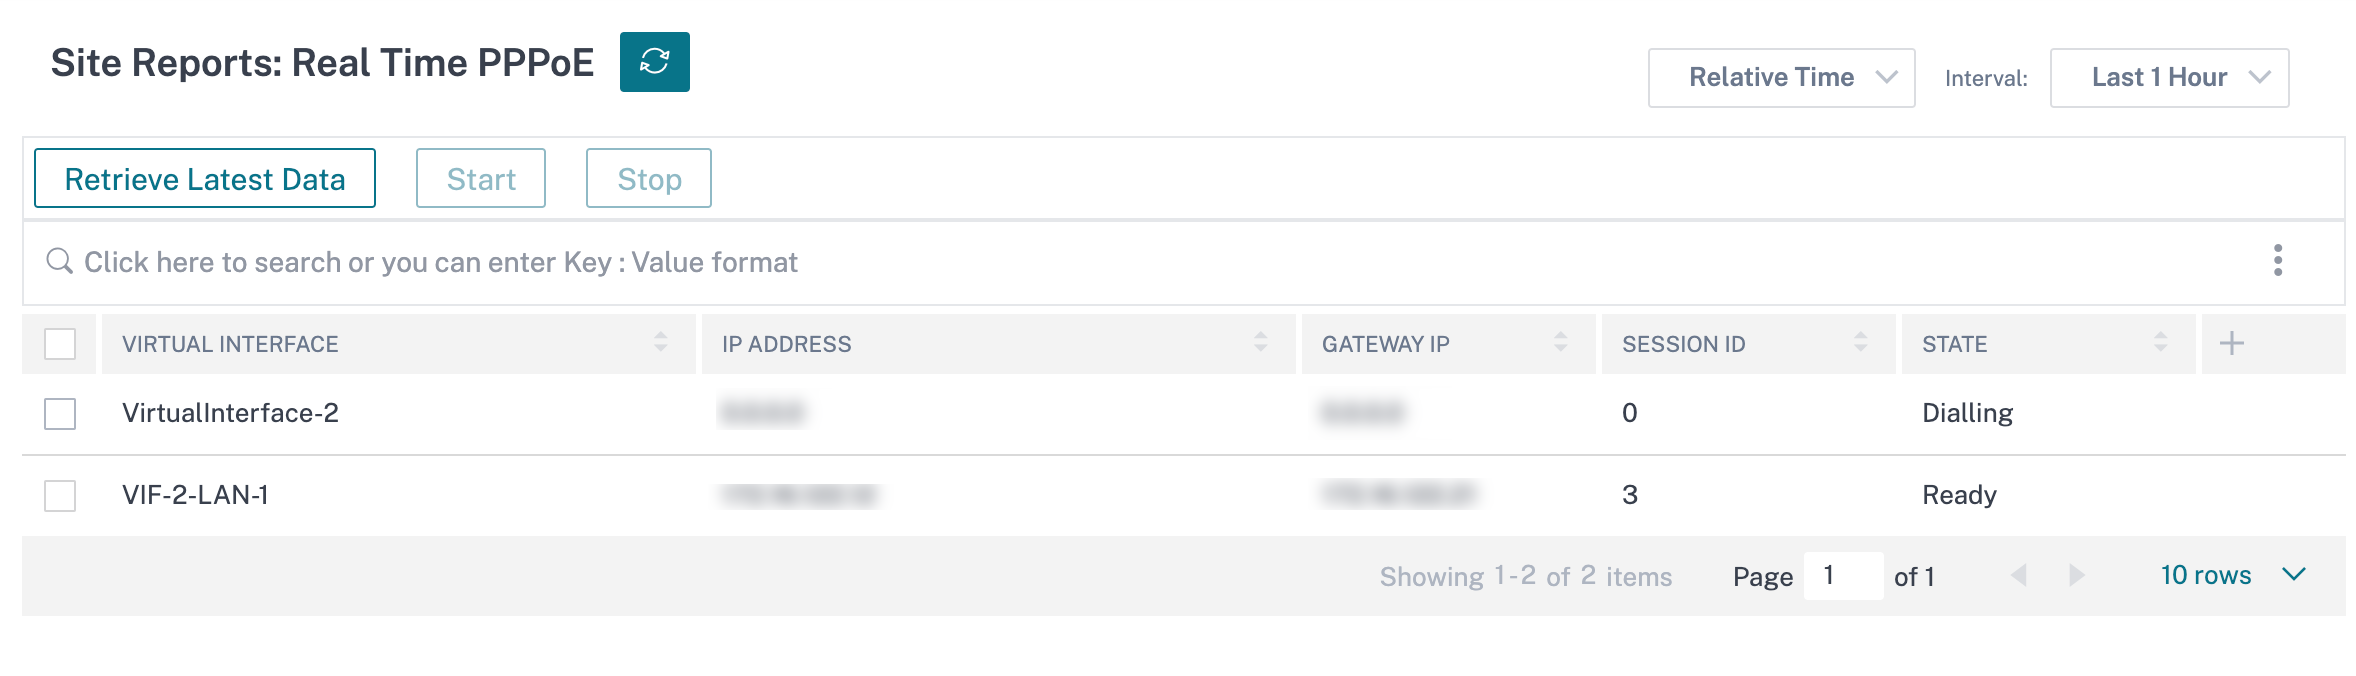
PPPoE
The PPPoE report provides status information of the configured virtual interface with the PPPoE static or dynamic client mode. It allows you to manually start or stop the sessions for troubleshooting purposes.
- Virtual interface: The virtual interface associated with PPPoE.
- IP Address: The IP address associated with the virtual interface. If the virtual interface is up and ready, displays the recently received values. If the virtual interface is stopped or is in failed state, displays the last received values.
- Gateway IP: The IP address associated with the Gateway. If the virtual interface is up and ready, displays the recently received values. If the virtual interface is stopped or is in failed state, displays the last received values.
- Session ID: The unique identifier associated with PPPoE session.
- State: The State column displays the status of the PPPoE session. The following table describes the states and descriptions.
| PPPoE session type | Description |
|---|---|
| Configured | A VNI is configured with PPPoE. This is an initial state. |
| Dialing | After a VNI is configured, the PPPoE session state moves to dialing state by starting the PPPoE discovery. Packet information is captured. |
| Session | VNI is moved from Discovery state to Session state, waiting to receive IP, if dynamic or waiting for acknowledgment from server for the advertised IP, if static. |
| Ready | IP packets are received and VNI and associated WAN link is ready for use. |
| Failed | PPP/PPPoE session is terminated. The reason for the failure can be due to invalid configuration or fatal error. The session attempts to reconnect after 30 seconds. |
| Stopped | PPP/PPPoE session is manually stopped. |
| Terminating | An intermediate state terminating due to a reason. This state automatically starts after certain duration (5 seconds for normal error or 30 secs for a fatal error). |
| Disabled | The SD-WAN service is disabled. |
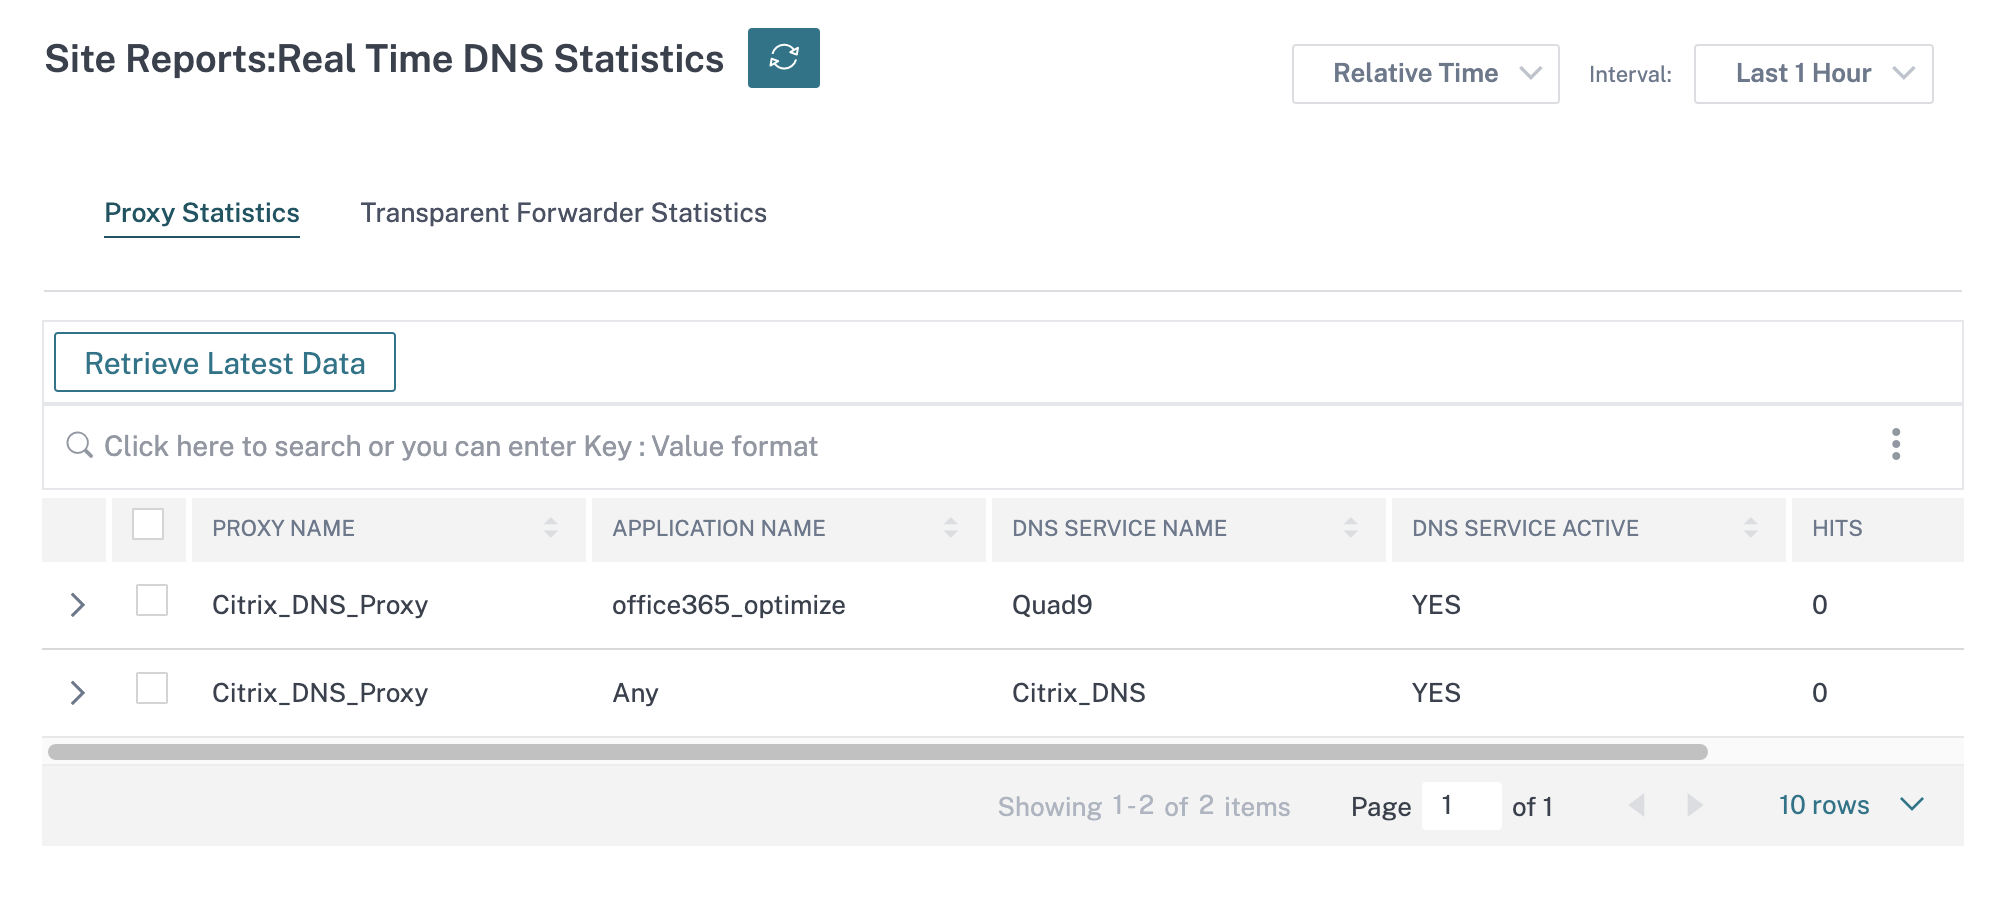
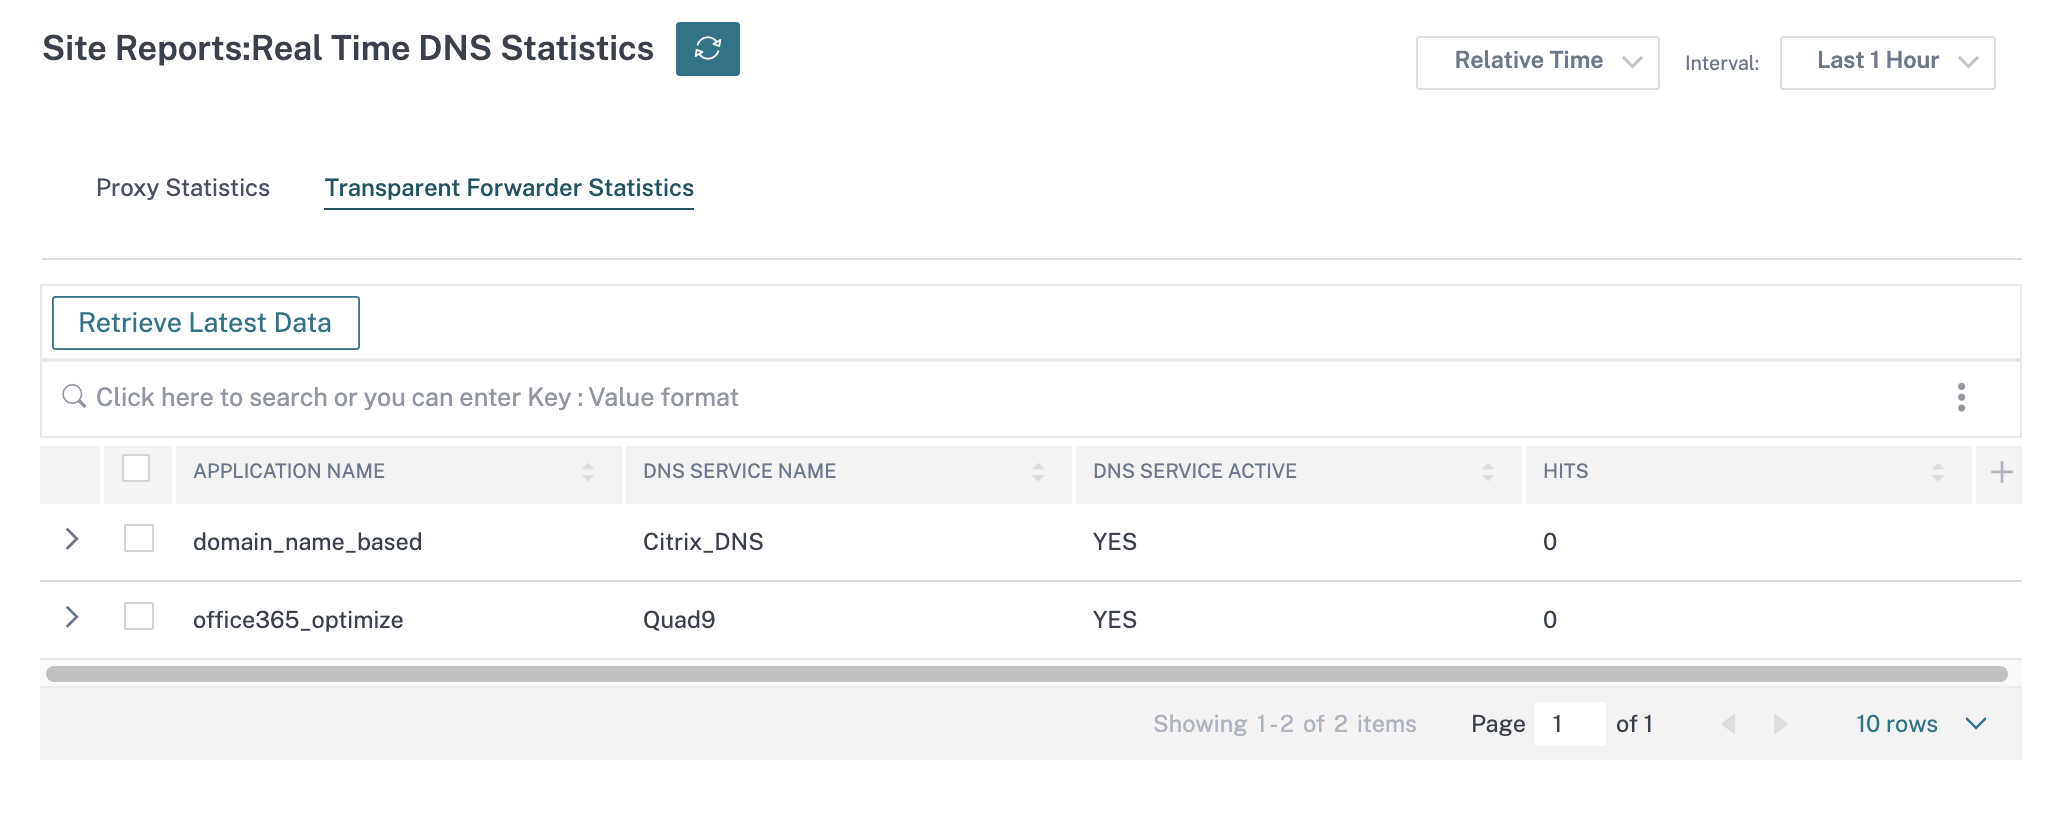
DNS statistics
The DNS Statistics provides the information on the application name, DNS service name, DNS service status, and the amount of hits to the DNS service. The information for DNS proxy and DNS transparent forwarder is displayed on two different tabs.
Proxy statistics
Transparent forwarder statistics
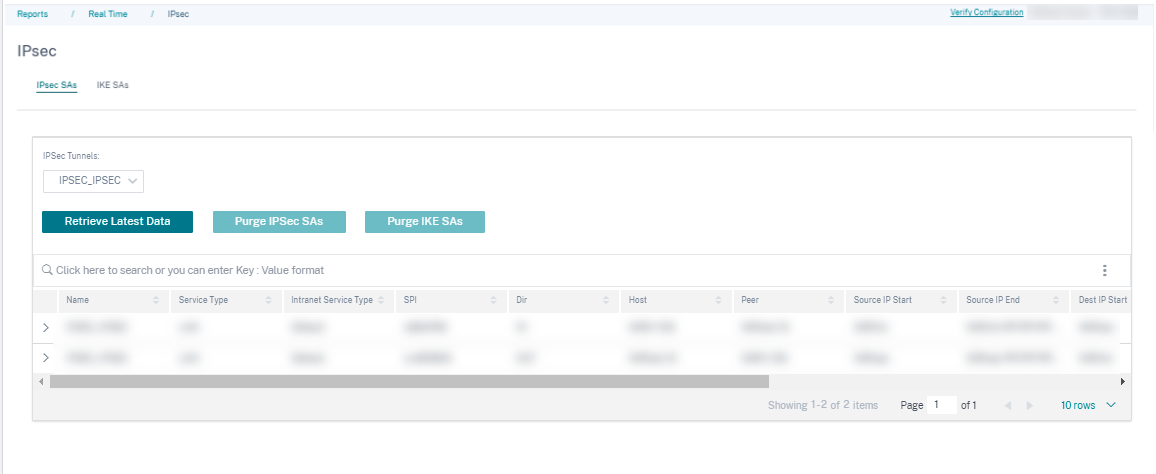
IPsec
The IPsec real-time report provides details about the IPsec tunnel settings on your network.
To view details of IPsec Security Associations (IPsec SAs), navigate to Reports > Real Time > IPsec > IPsec SAs. Click Retrieve latest data to get the current data.
To view details of Internet Key Exchange Security Associations (IKE SAs), navigate to Reports > Real Time > IPsec > IKE SAs. Click Retrieve latest data to get the current data.
You can also purge the IPsec group data and statistical data by selecting Purge IPsec Group and Purge IKE Stats respectively.
Appliance reports (Preview)
Appliance reports deliver the network traffic and system usage reports. Using this data you can troubleshoot network issues or analyze the behavior of your Citrix SD-WAN devices. You can see the following tabs under Appliance Reports page:
- Interface
- Network
- CPU Usage
- Disk Usage
- Memory Usage
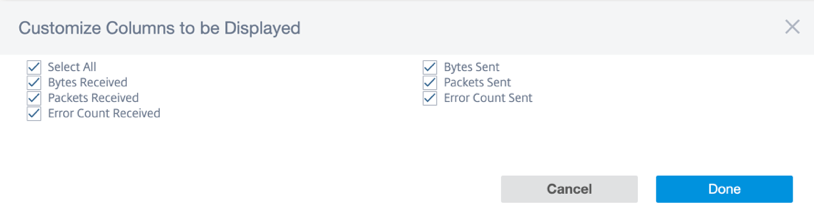
Click each tab to view or monitor the appliance graph by hour, day, weekly, and monthly. You can toggle between Absolute and Relative time as required. The table columns are customizable. Click Customize column right top corner of the table and select/deselect the options that you want to display or hide in the table.
Interface
The Interface page shows the management interface errors/traffic. All the network is divided into different interface, such as Management Interface, Interface 1/2/3.
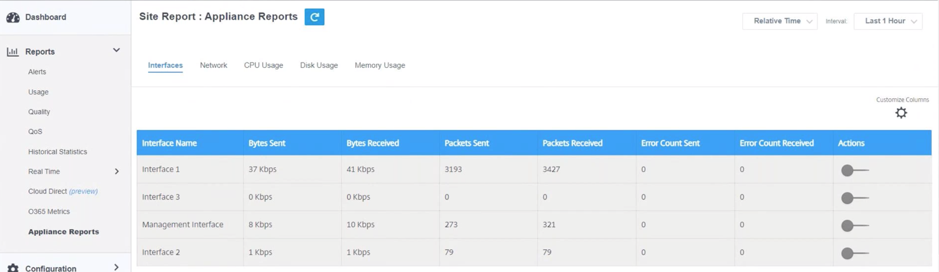
- Interface Name – Displays the interface name.
- Bytes Sent – Average number of bytes sent for the selected duration in Kbps.
- Bytes Received – Average number of bytes received for the selected duration in Kbps.
- Packets Sent – Average number of packets sent for the selected duration.
- Packets Received – Average number of packets received for the selected duration.
- Error Count Sent – Number of errors count sent for the selected duration.
- Error Count Received – Number of errors count received for the selected duration.
- Actions – You can switch on the action button to view the network graph.
Network
The Network page shows the number of TCP connections for each configured site.
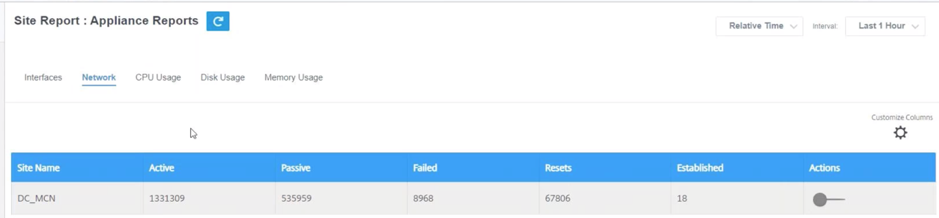
- Site Name – Displays the site name.
- Active – Average number of active TCP connection counts for the selected duration.
- Passive – Average number of passive TCP connection counts for the selected duration.
- Failed – Average number of failed TCP connection counts for the selected duration.
- Resets – Average number of reset TCP connection counts for the selected duration.
- Established – Average number of established TCP connection counts for the selected duration.
- Actions – You can switch on the action button to view the network graph.
CPU usage
The CPU Usage page shows the CPU utilization of the SD-WAN device as a percentage. The CPU graph shows the average CPU consumption for the regular intervals over the selected time.
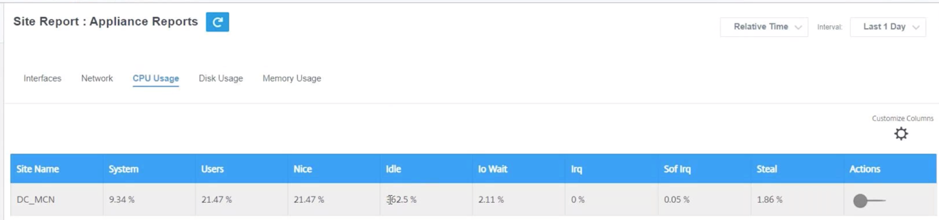
- Site Name – Displays the site name.
- System – Percentage of total time the CPU spent processing system-space programs.
- Users – Percentage of total time the CPU spent processing user-space programs.
- Nice – Nice is when the CPU is running a user task having below-normal priority.
- Idle – Percentage of total time the CPU was in Idle mode.
- Io Wait – Percentage of total time the CPU spent waiting for I/O operations.
- Irq – The interrupt requests (IRQs) value that the kernel serves.
- Steal - When running in a virtualized environment, the hypervisor might steal cycles that are meant for your CPUs and give them to another, for various reasons. This time is known as steal.
- Actions – You can switch on the action button to view the network graph.
Disk usage
The Disk Usage page shows the amount of hard disk space used by the operating system and data partition in an I/O per second (IOPS) value.
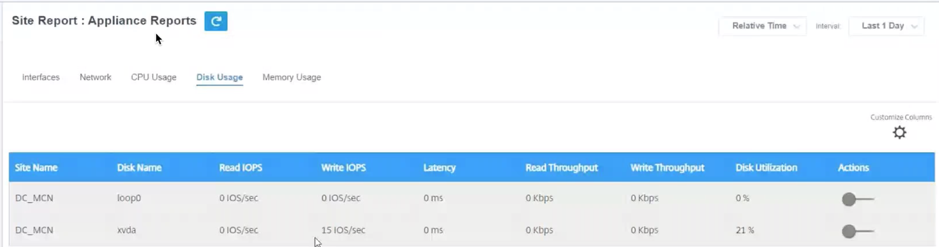
- Site Name – Displays the site name.
- Disk Name – Displays the hard disk name.
- Read IOPS – Displays the average number of read IOPS per second over the selected time frame.
- Write IOPS – Displays the average number of write IOPS per second over the selected time frame.
- Latency – Displays the latency value of the successful read and write requests from the selected volume workload over the selected time frame. It is recommended that below 10 ms latency value is best for I/O performance.
- Read Throughput – Displays the average disk throughput value of the disk read operation over the selected time in Kbps.
- Write Throughput – Displays the average disk throughput value of the disk write operation over the selected time in Kbps.
- Disk Utilization – Displays the average disk utilization value in percentage over the selected time frame.
- Actions – You can switch on the action button to view the network graph.
Memory usage
The Memory Usage page shows the report of the amount of memory used.
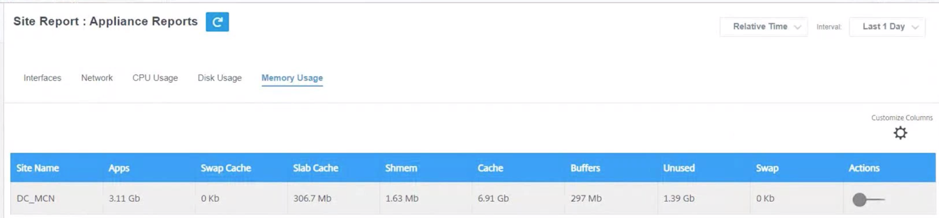
- Site Name – Displays the site name.
- Apps – Displays the used application value in Gb.
- Swap Cache – Displays the swap cache number in Mb. Swap cache is a list of page table entries with one entry per physical page.
- Slab Cache – Displays the number of pre-allocated slabs of memory. In Mb
- Shmem – Displays the total used shared memory value in Mb.
- Cache – Displays the number of cache memories used in Gb.
- Buffers – Displays the number of the physical memory that is used by the buffer cache.
- Unused – Displays the number of unused memories for cache.
- Swap – Displays the number of swap spaces. The swap space is used if you need some space extension for your physical memory.
- Actions – You can switch on the action button to view the network graph.
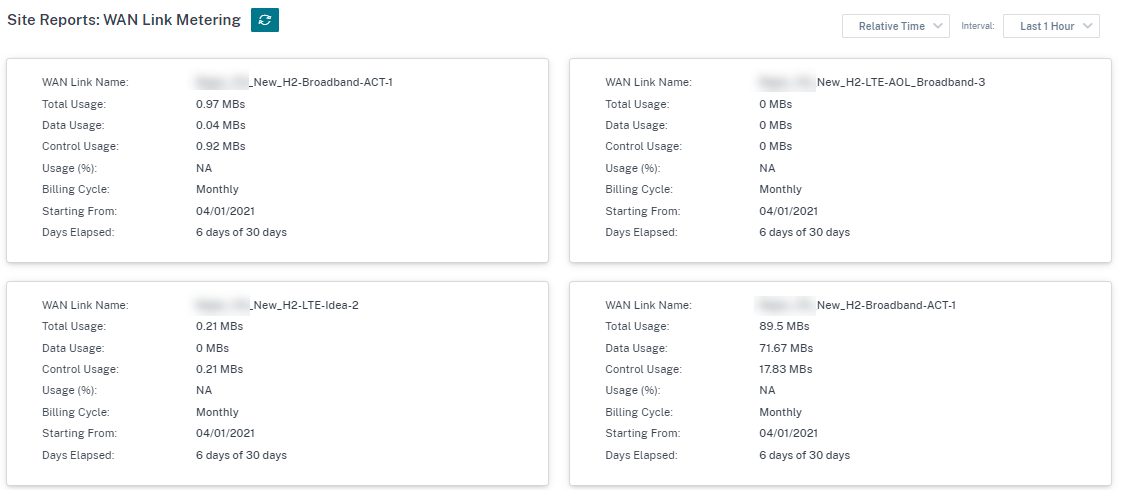
WAN Link Metering
WAN link metering reports provide details about the metered WAN link usage. You can view the reports to get insights into the data consumption of the metered WAN links. To view WAN link metering reports, navigate to Reports > WAN Link Metering.