Troubleshooting Tips
While most installations complete smoothly, some installations require knowledge of the appliance’s internal structure or the use of little-known features before you can perform more monitoring and troubleshooting. These troubleshooting tips provide information and techniques that allow a more in-depth analysis of the appliance.
Understanding internal addresses
Some reports show addresses on the private subnets within the SD-WAN 4100/5100, so it’s good to know what these addresses mean. These subnets connect the virtual machines together, without connecting to external ports.
All these addresses are on the local link subnet 169.254.0.0/16, described in RFC3927. This address space is segmented into three partly overlapping subnets: system management, private traffic, and accelerator management subnets.
Virtual machines in the SD-WAN 4100 and 5100. The system management subnet is not shown in this diagram. The traffic shaper manages traffic from all accelerators and is controlled via the accelerator GUI.

System management subnet
| Function | Address |
|---|---|
| Management Service | 169.254.0.10/16 |
| NetScaler Instance | 169.254.0.11/16 |
| XenServer | 169.254.0.1/16 |
Private traffic subnet
| Function | Address |
|---|---|
| apA IP, accelerators 1–8 | 169.254.10.21/24 - 169.254.10.28/24 |
| apA Signaling IP, accelerators 1–8 | 169.254.10.121/24 - 169.254.10.128/24 |
| NetScaler Instance | 169.254.10.11/24 |
Accelerator management subnet
| Function | Address |
|---|---|
| Accelerator unified management IP (controls all accelerators) | 169.254.0.20/24 |
| Primary Port IP, accelerators 1–8 | 169.254.0.21/24 - 169.254.0.28/24 |
Checking and correcting accelerator instance status
Sometimes an error message may indicate an issue with one of the virtual machines in the appliance. To check their status, go to the System Configuration page and select an Instance view of either the SD-WAN or NetScaler subsystems. For example, the SD-WAN page.
- A fully active instance shows a green circle for VM State, Instance State, and Licensed.
- Your appliance may have more instances present than are licensed; ignore the unlicensed instances.
- If the VM State or Instance State of the remaining instances is not green, use the “Rediscover” action to attempt to bring these instances back into operation.
You can also get detailed information for each instance:
- Every instance should have a Status of “Inventory from SD-WAN Instance completed.
- Every instance should be running the same version of the software.
- Every instance should have the netmask (255.255.255.0) and gateway (169.254.0.20).
- Instances that show an uptime shorter than other instances have rebooted since the last whole-system reboot.
Logging into the NetScaler instance
Sometimes it is useful to log into the NetScaler instance to check its status or do configuration. You can log into the NetScaler instance from the NetScaler Instances page of the view, as shown in the following. Click the IP Address link.
You can also log into the NetScaler instance directly from your browser if you know its IP address on the management port (port 0/1).
Once logged in, you can see the NetScaler GUI, which identifies itself as NetScaler VPX at the top of the page.
This is the standard NetScaler user interface. Using monitoring features is safe. Configuration changes should be made with caution, as the SD-WAN 4100/5100 makes undocumented assumptions about how the NetScaler instance is configured.
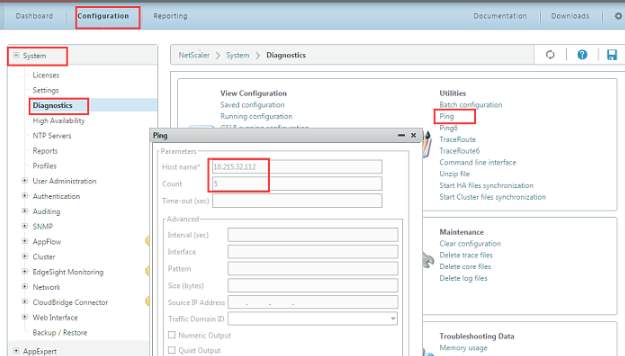
Using ping and traceroute
The ping and traceroute utilities are not available on the accelerator instances, as they are on other SD-WAN products. Instead, you can use the equivalent features on the NetScaler instance, using the Diagnostics page as shown in the following illustration.
These features work over your external network and on the appliance’s internal subnets.
Using the system dashboard
Unlike the SD-WAN Dashboard, the System Dashboard page is devoted largely to hardware monitoring.
- The System Health tables show a status summary, with a Details link for expanded information in graphical form.
- The Events tables show a status summary, with a Show Events link to see the related log entries.
- If several ports are marked as Down, which is only an error if a cable is supposed to be present. Most appliances have several unused ports.
- Fail To Wire lists FTW Disabled for all ports. This means that the network bypassing feature is not enabled on this appliance. Examination of the FTW Events showed that there were no actual events, indicating that the feature is probably disabled.
For each warning or error, more details are available through the Details links or Show Events buttons.
Logging in to different instances via SSH
You can log into some of the virtual machines from the management port (port 0/1) using an ssh utility (such as PuTTY on Windows), logging in either as root or nsroot and using the administrative password. This gives you a shell prompt.
The most common use for logging on via SSH is to restore the IP address of an instance, typically the management service, that has become unreachable due to misconfigured network parameters. Otherwise, SSH is not recommended, as configuration changes can render the appliance unstable or unusable.
If neither of the two instances below are accessible over the network, you can log into the XenServer instance using the RS-232 port, which will give you a shell prompt.
Once logged into one of these virtual machines, you can use SSH from the shell prompt to reach the NetScaler instance or the accelerator at the appropriate 169.254.x.x address.
The usual UNIX/Linux commands are available, including the text editor.
| Instance | Login | Password | Actual Username |
|---|---|---|---|
| Management Service | nsroot | Admin password | root |
| Management Service | root | Admin password | root |
| XenServer | nsroot | Admin password | nsroot |
| XenServer | root | Admin password | root |
Monitoring individual accelerator instances
Logging into the accelerator GUI IP allows you to manage all the accelerator instances as a unit. Changes are automatically propagated to all the accelerator instances.
On rare occasions, you may wish to troubleshoot individual accelerator instances.
The login for the instances is admin. The password is the same admin password as is used on the other instances.
This is recommended for monitoring, not for making permanent changes, since any parameter you set in an instance may be overwritten later by the synchronization process. To do this, use the following URLs:
| Accelerator Instance | URL |
|---|---|
| 1 | https://<accelerator_ip>:4001 |
| 2 | https://<accelerator_ip>:4002 |
| 8 | https://<accelerator_ip>:4008 |
Using individual elements of the update bundle
The update bundles distributed by Citrix are in a simple .tgz format (a tar archive compressed with gzip). It is sometimes useful to extract individual components from the archive, rather than going back to the Citrix Web site and downloading them individually. This is most commonly useful with the management service (build-svm*.tgz) or the accelerator release (orbital*.bin).
The update bundle is managed by tar/gzip or by archiving utilities like 7-zip.
In this article
- Understanding internal addresses
- System management subnet
- Private traffic subnet
- Accelerator management subnet
- Checking and correcting accelerator instance status
- Logging into the NetScaler instance
- Using ping and traceroute
- Using the system dashboard
- Logging in to different instances via SSH
- Monitoring individual accelerator instances
- Using individual elements of the update bundle