This content has been machine translated dynamically.
Dieser Inhalt ist eine maschinelle Übersetzung, die dynamisch erstellt wurde. (Haftungsausschluss)
Cet article a été traduit automatiquement de manière dynamique. (Clause de non responsabilité)
Este artículo lo ha traducido una máquina de forma dinámica. (Aviso legal)
此内容已经过机器动态翻译。 放弃
このコンテンツは動的に機械翻訳されています。免責事項
이 콘텐츠는 동적으로 기계 번역되었습니다. 책임 부인
Este texto foi traduzido automaticamente. (Aviso legal)
Questo contenuto è stato tradotto dinamicamente con traduzione automatica.(Esclusione di responsabilità))
This article has been machine translated.
Dieser Artikel wurde maschinell übersetzt. (Haftungsausschluss)
Ce article a été traduit automatiquement. (Clause de non responsabilité)
Este artículo ha sido traducido automáticamente. (Aviso legal)
この記事は機械翻訳されています.免責事項
이 기사는 기계 번역되었습니다.책임 부인
Este artigo foi traduzido automaticamente.(Aviso legal)
这篇文章已经过机器翻译.放弃
Questo articolo è stato tradotto automaticamente.(Esclusione di responsabilità))
Translation failed!
Verify video caching
Graphs and data on the Monitoring page, Dashboard page, and Usage page help you evaluate the benefits provided by your video caching configuration. The data-reduction ratio resulting from video caching (similar to the overall compression ratio) is displayed on the Dashboard, on the video caching monitoring page, and on the Usage graph page. Also, hovering over the Data Reduction ratio on the Dashboard page displays the caching benefit percentage along with compression benefit percentage on the supported platforms.
The purpose of caching is not just to save bandwidth, but also to increase performance, decrease load on the video servers, and lessen the impact of network congestion.
The estimated WAN bandwidth savings resulting from video caching are displayed as follows:
-
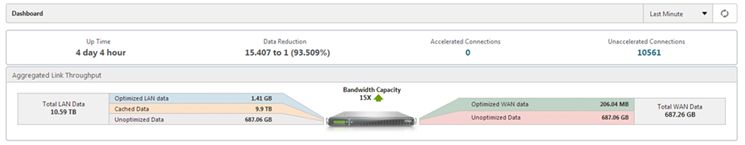
On the Dashboard page, you can view the caching benefit, as a percentage, by hovering the cursor over the Data Reduction field on the Dashboard. You can also view the bytes served from the cache (Cached Data) under Aggregated Link Throughput.
-
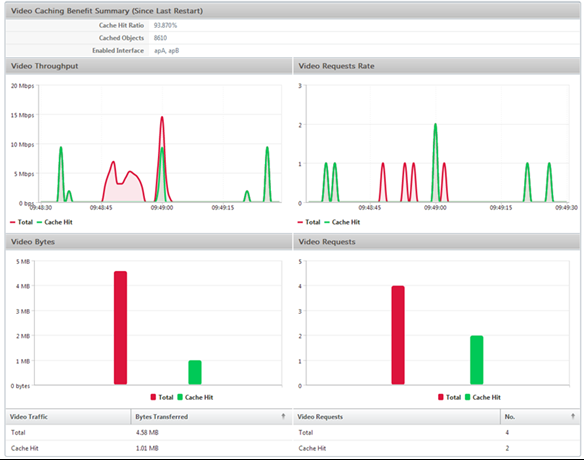
On the Monitoring > Video Caching page, you can view the number of objects cached, and the Cache Hit Ratio (as a percentage). The bar and the time graphs display the number of requests and bytes served from cache over 1 minute, 1 hour, 1 day, 1 week, and 1 month. This data is also displayed in a tabular format below the graph.
-
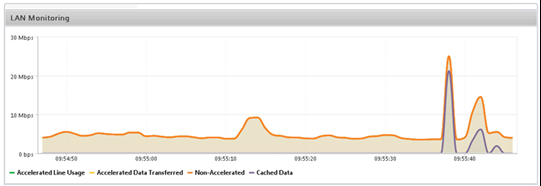
On the Monitoring > Optimization > Usage Graph page, you can view the cached data in the LAN Monitoring graph.
-
On the Monitoring > Video Caching > HTTP State List page, you can monitor the improved cache behavior. This page reports the state of HTTP connections with respect to video caching.
-
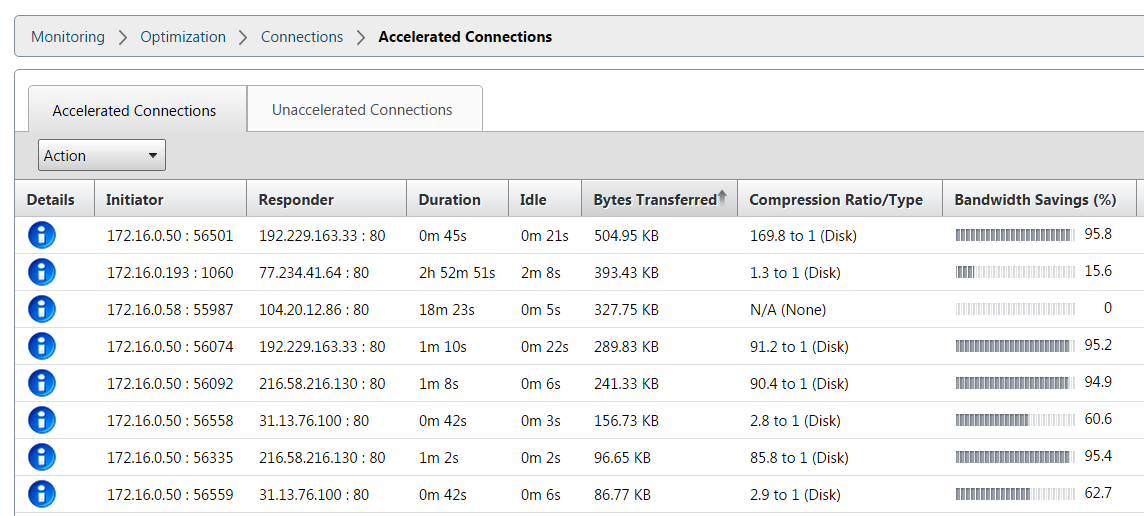
On the Monitoring > Optimization > Connections page, you can view the cached connections on the Accelerated Connections tab. Both cache hits and cache misses are displayed here. The cache connections are displayed here even if they are not accelerated. That is, the cached connections are displayed here even if a partner Citrix SD-WAN WANOP appliance is not involved in the connection. Bandwidth Savings (%) column shows a bar graph of how much WAN bandwidth was saved by the transaction, whether through caching or compression. While the aim of caching and compression is to increased speed and usability and not reduced bandwidth usage, speed and usability increases are often related to bandwidth reduction. That is, a 90% bandwidth savings implies a 10x increase in speed.
Share
Share
In this article
This Preview product documentation is Cloud Software Group Confidential.
You agree to hold this documentation confidential pursuant to the terms of your Cloud Software Group Beta/Tech Preview Agreement.
The development, release and timing of any features or functionality described in the Preview documentation remains at our sole discretion and are subject to change without notice or consultation.
The documentation is for informational purposes only and is not a commitment, promise or legal obligation to deliver any material, code or functionality and should not be relied upon in making Cloud Software Group product purchase decisions.
If you do not agree, select I DO NOT AGREE to exit.