This content has been machine translated dynamically.
Dieser Inhalt ist eine maschinelle Übersetzung, die dynamisch erstellt wurde. (Haftungsausschluss)
Cet article a été traduit automatiquement de manière dynamique. (Clause de non responsabilité)
Este artículo lo ha traducido una máquina de forma dinámica. (Aviso legal)
此内容已经过机器动态翻译。 放弃
このコンテンツは動的に機械翻訳されています。免責事項
이 콘텐츠는 동적으로 기계 번역되었습니다. 책임 부인
Este texto foi traduzido automaticamente. (Aviso legal)
Questo contenuto è stato tradotto dinamicamente con traduzione automatica.(Esclusione di responsabilità))
This article has been machine translated.
Dieser Artikel wurde maschinell übersetzt. (Haftungsausschluss)
Ce article a été traduit automatiquement. (Clause de non responsabilité)
Este artículo ha sido traducido automáticamente. (Aviso legal)
この記事は機械翻訳されています.免責事項
이 기사는 기계 번역되었습니다.책임 부인
Este artigo foi traduzido automaticamente.(Aviso legal)
这篇文章已经过机器翻译.放弃
Questo articolo è stato tradotto automaticamente.(Esclusione di responsabilità))
Translation failed!
Monitor in Quick Deploy
From the Monitor dashboard, you can view desktop usage, sessions, and machines in your Citrix DaaS (formerly Citrix Virtual Apps and Desktops service) deployment. You can also control sessions, power-manage machines, end running applications, and end running processes.
To access the Monitor dashboard:
- Sign in to Citrix Cloud, if you haven’t already. In the upper left menu, select My Services > DaaS.
- From the Manage > Quick Deploy dashboard, select the Monitor tab.
Monitor desktop usage
Displays on this page refresh every five minutes.
-
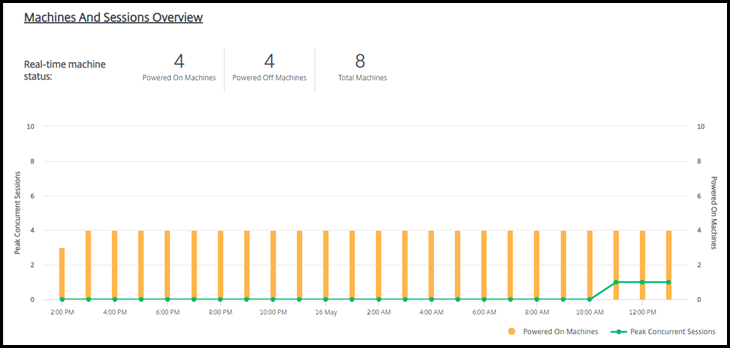
Machine and Sessions Overview: You can tailor the display to show information about all catalogs (default) or a selected catalog. You can also tailor the time period: the last day, week, month, or three months.
Counts at the top of the display indicate the total number of machines, plus the number of machines that are powered-on and powered-off. Hover over a value to display how many are single-session and multi-session.
The graph below the counts shows the number of powered-on machines and peak concurrent sessions at regular points during the time period you selected. Hover on a point the graph to display the counts at that point.
-
Top 10s: To tailor a top 10 display, select a time period: the past week (default), month, or three months. You can also tailor the display to show only information about activity involving single-session machines, multi-session machines, or applications.
- Top 10 Active Users: Lists the users who started desktops most frequently during the time period. Hovering on a line displays the total launches.
- Top 10 Active Catalogs: Lists the catalogs with the longest duration during the selected time period. Duration is the sum of all user sessions from that catalog.
Desktop usage report
To download a report containing information about machine launches during the last month, select Launch Activity. A message indicates that the request is being processed. The report downloads automatically to the default download location on the local machine.
Filter and search to monitor machines and sessions
When you’re monitoring session and machine information, all machines or sessions are displayed by default. You can:
- Filter the display by machines, sessions, connections, or applications.
- Refine the display of sessions or machines by choosing the criteria you want, building a filter by using expressions.
- Save the filters that you build, for reuse.
Control a user’s applications
You can display and manage applications and processes for a user that has a running session or an assigned desktop.
- From the Monitor dashboard in Citrix DaaS, select Search and enter the user name (or the beginning characters of the user name), machine, or endpoint. From the search results, select the item you’re looking for. (To collapse the search box without searching, select Search again.)
-
Select a session.
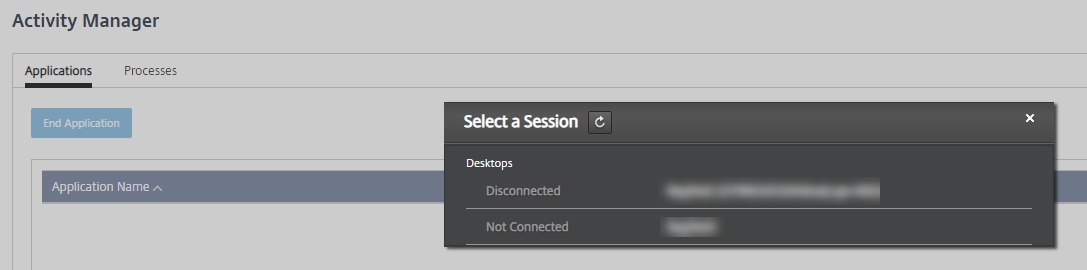
The Activity Manager lists the applications and processes for the user’s session.
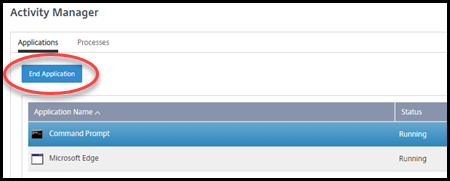
-
To end an application, on the Applications tab in Activity Manager, select in the application’s row to select that application, and then select End Application.
- To end a process, on the Processes tab in Activity Manager, select in the process’s row to select that process, and then select End Process.
- To display session details, select Details in the upper right. To return to the applications and processes display, select Activity Manager in the upper right.
- To control the session, select Session Control > Log Off or Session Control > Disconnect.
Shadow users
Use the shadow feature to view or work directly on a user’s virtual machine or session. You can shadow Windows and Linux VDAs. The user must be connected to the machine that you want to shadow. To verify that connection, check the machine name listed in the User title bar.
Shadowing launches in a new browser tab. Ensure that your browser allows pop-ups from the Citrix Cloud URL.
Shadowing is supported only for users on domain-joined machines. To shadow a non-domain-joined machine, you must set up a bastion machine. For details, see Bastion access.
Shadowing must be initiated from a machine on the same virtual network as the domain-joined machines, and also meet any port requirements.
Enable shadowing
- From Manage > Quick Deploy > Monitor, go to the User Details view.
- Select the user session, and then select Shadow in the Activity Manager view or the Session Details panel.
Shadow Linux VDAs
Shadowing is available for Linux VDAs Version 7.16 or and later running the RHEL7.3 or Ubuntu Version 16.04 Linux distributions.
Monitor uses the FQDN to connect to the target Linux VDA. Ensure that the Monitor client can resolve the FQDN of the Linux VDA.
- The VDA must have the
python-websockifyandx11vnc packages installed. -
noVNCconnection to the VDA uses the WebSocket protocol. By default,ws://WebSocket protocol is used. For security reasons, Citrix recommends that you use the securewss://protocol. Install SSL certificates on each Monitor client and Linux VDA.
Follow the instructions in Session Shadowing to configure your Linux VDA for shadowing.
- After you enable shadowing, the shadowing connection initializes and a confirmation prompt appears on the user device.
- Instruct the user to select Yes to start the machine or session sharing.
- The administrator can view only the shadowed session.
Shadow Windows VDAs
Windows VDA sessions are shadowed using Windows Remote Assistance. Enable the Use Windows Remote Assistance feature when installing the VDA.
- After you enable shadowing, the shadowing connection initializes and a dialog box prompts you to open or save the
.msrc incidentfile. - Open the incident file with the Remote Assistance Viewer, if it’s not already selected by default. A confirmation prompt appears on the user device.
- Instruct the user to select Yes to start the machine or session sharing.
- For more control, ask the user to share keyboard and mouse control.
Monitor and control sessions
Session displays are updated every minute.
In addition to viewing sessions, you can disconnect one or more sessions or log off users from sessions.
-
From Manage > Quick Deploy > Monitor, select Filters.
-
Select the Sessions view.
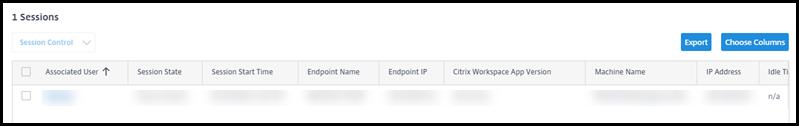
-
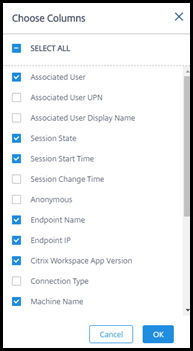
To tailor the display, select Choose Columns and select the check boxes of items you want to appear. When you’re done, select OK. The sessions display refreshes automatically.
- Select the check box to the left of each session you want to control.
- To log off or disconnect the session, elect either Session Control > Log Off or Session Control > Disconnect.
Remember that the power management schedule for the catalog can also control disconnecting sessions and logging off users from disconnected sessions.
As an alternative to the above procedure you can also Search for a user, select the session you want to control, and then display session details. The log off and disconnect options are available there, too.
Session information report
To download session information, select Export on the sessions display. A message indicates that the request is being processed. The report downloads automatically to the default download location on the local machine.
Monitor and power control machines
Machine displays are updated every minute.
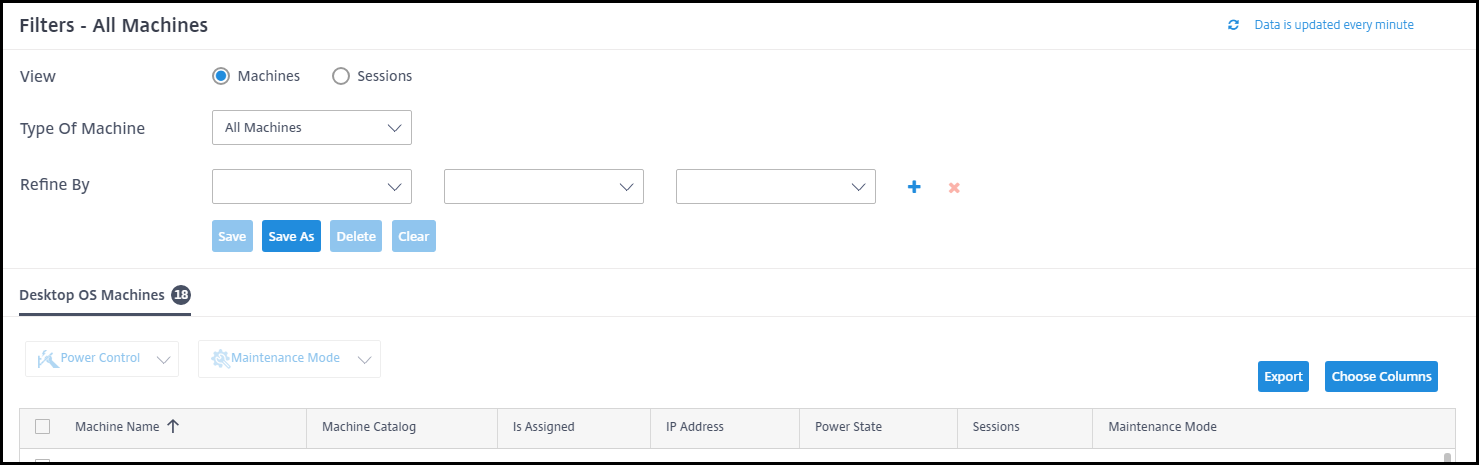
- From Manage > Quick Deploy > Monitor, select Filters.
-
Select the Machines view.
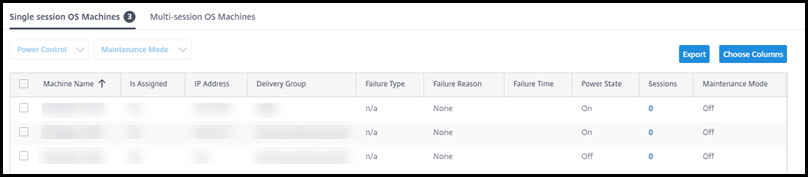
By default, the display lists single-session OS machines. Alternatively, you can display multi-session machines.
-
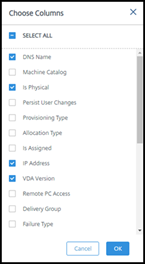
To tailor the display, select Choose Columns and select the check boxes of items you want to appear. When you’re done, select OK. The machines display refreshes automatically.
- To power-control machines or place them in or out of maintenance mode, select the check box to the left of each machine you want to control.
-
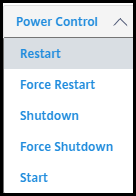
To power-control the selected machines, select Power Control and select an action.
- To place the selected machines in or out of maintenance mode, select Maintenance Mode > ON or Maintenance Mode > OFF.
When you use the search feature to find and select a machine, you see machine details, utilization, historical utilization (from the last seven days), and average IOPS.
Machine information report
To download session information, select Export on the machines display. A message indicates that the request is being processed. The report downloads automatically to the default download location on the local machine.
Checking app and desktop health
Probing automates the process of checking the health of published apps and desktops. The health check results are available through the Monitor dashboard. For details, see:
Share
Share
This Preview product documentation is Citrix Confidential.
You agree to hold this documentation confidential pursuant to the terms of your Citrix Beta/Tech Preview Agreement.
The development, release and timing of any features or functionality described in the Preview documentation remains at our sole discretion and are subject to change without notice or consultation.
The documentation is for informational purposes only and is not a commitment, promise or legal obligation to deliver any material, code or functionality and should not be relied upon in making Citrix product purchase decisions.
If you do not agree, select I DO NOT AGREE to exit.