Bandwidth Metering in SDX
NetScaler SDX bandwidth metering provides you with an accurate, reliable, and easy-to-use metering scheme that lets you efficiently allocate processing capacity and monetize bandwidth usage. A metering scheme is required to optimally allocate the bandwidth among various resources, keeping in mind that all the users at all the times get the allocated bandwidth.
The bandwidth allocation can be done in the following two modes:
- Dedicated bandwidth with a fixed rate of throughput
- Dedicated bandwidth with minimum assured throughput and bandwidth bursting ability
Dedicated bandwidth with a fixed rate of throughput
In the bandwidth allocation method, each VPX instance is assigned a dedicated bandwidth. The instance is allowed to use the bandwidth up to the limit set. In dedicated mode the minimum and maximum bandwidth allocated are the same. If during a period, the VPX instance requires more bandwidth than allocated, then in the dedicated mode the instance cannot increase its throughput. This issue can be a downside if a VPX instance serves critical requests.
Also, if an SDX appliance has a few VPX instances and some of them are not utilizing their allocated bandwidth, you cannot share their unused bandwidth in dedicated mode. To overcome all these challenges, a dedicated bandwidth with minimum assured rate with the ability to dynamically increase the bandwidth is useful.
Dedicated bandwidth with minimum assured throughput and bandwidth bursting ability
In this bandwidth allocation method, a VPX is allocated a minimum assured bandwidth with the flexibility to increase its bandwidth up to a preset limit. The extra bandwidth that a VPX can use is called burst capacity.
The benefit of burst capacity is seen when you have some instances that have extra capacity and some VPX with unused capacity. The extra capacity of these VPX instances can be allocated to other VPX instances that have fully utilized their allocated bandwidth and require more for some time. Various service providers are also interested in providing various add-on services to their customers that require dedicated capacity. At the same time they do not want to over provision bandwidth. Burstable bandwidth helps in such scenarios where the customers are assured of a specific bandwidth with the option to increase the bandwidth during high demand periods.
Selecting the bandwidth allocation mode
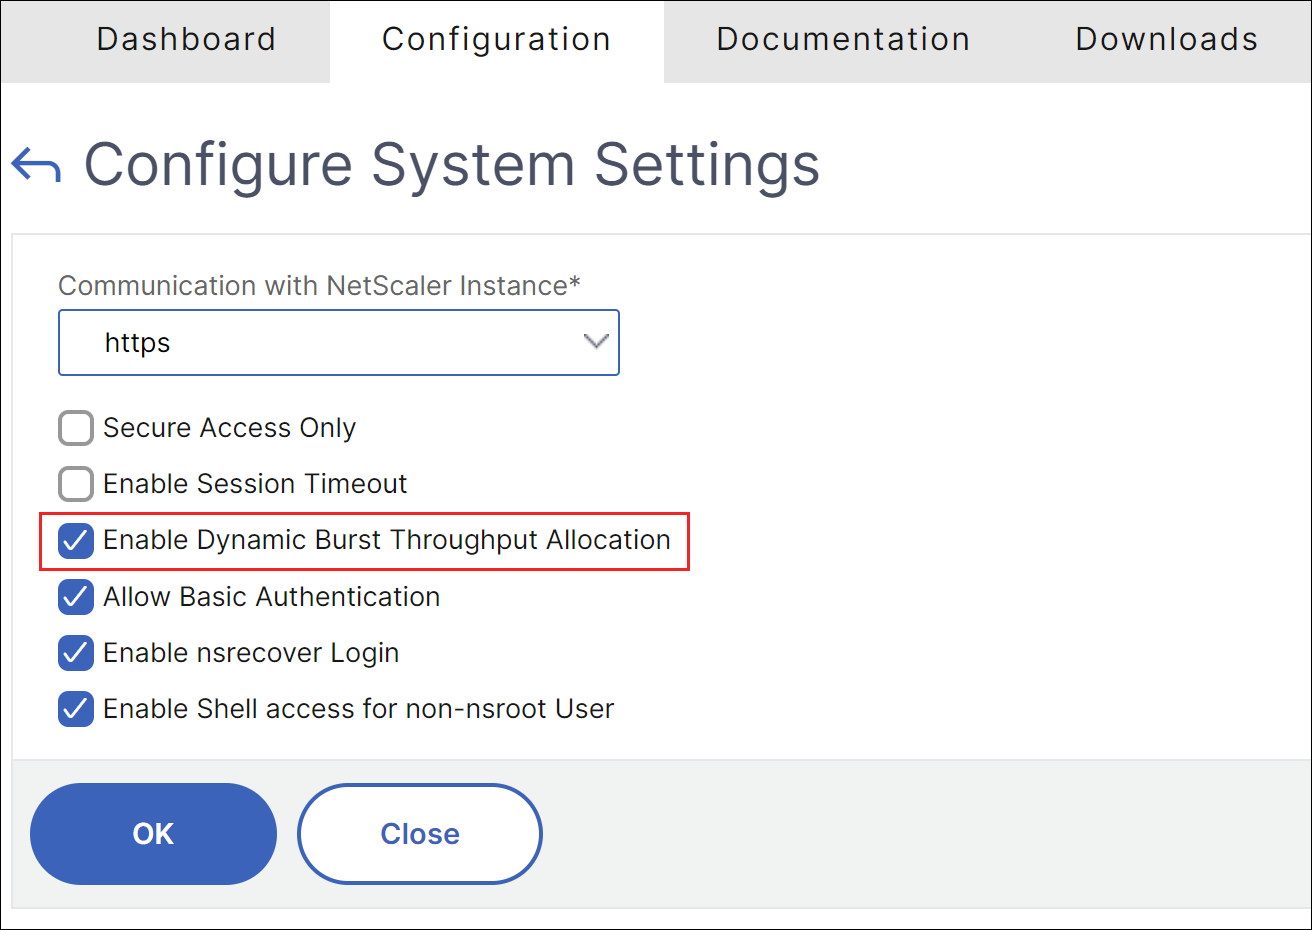
Before you choose burstable throughput, you need to enable dynamic burst throughput allocation. To enable this option, follow these steps.
- From the SDX Management Console, navigate to Configuration > System.
- From the System Settings group, select Change System Settings.
- Click the Enable Dynamic Burst Throughput Allocation check box to enable dynamic throughput.
When you provision a VPX, you can select from bandwidth burst or dynamic throughput.
-
In the SDX Management Service, click Configuration > NetScaler > Instances > Add.
-
The Provision NetScaler page opens. Under License Allocation, choose Burstable from Allocation Mode.
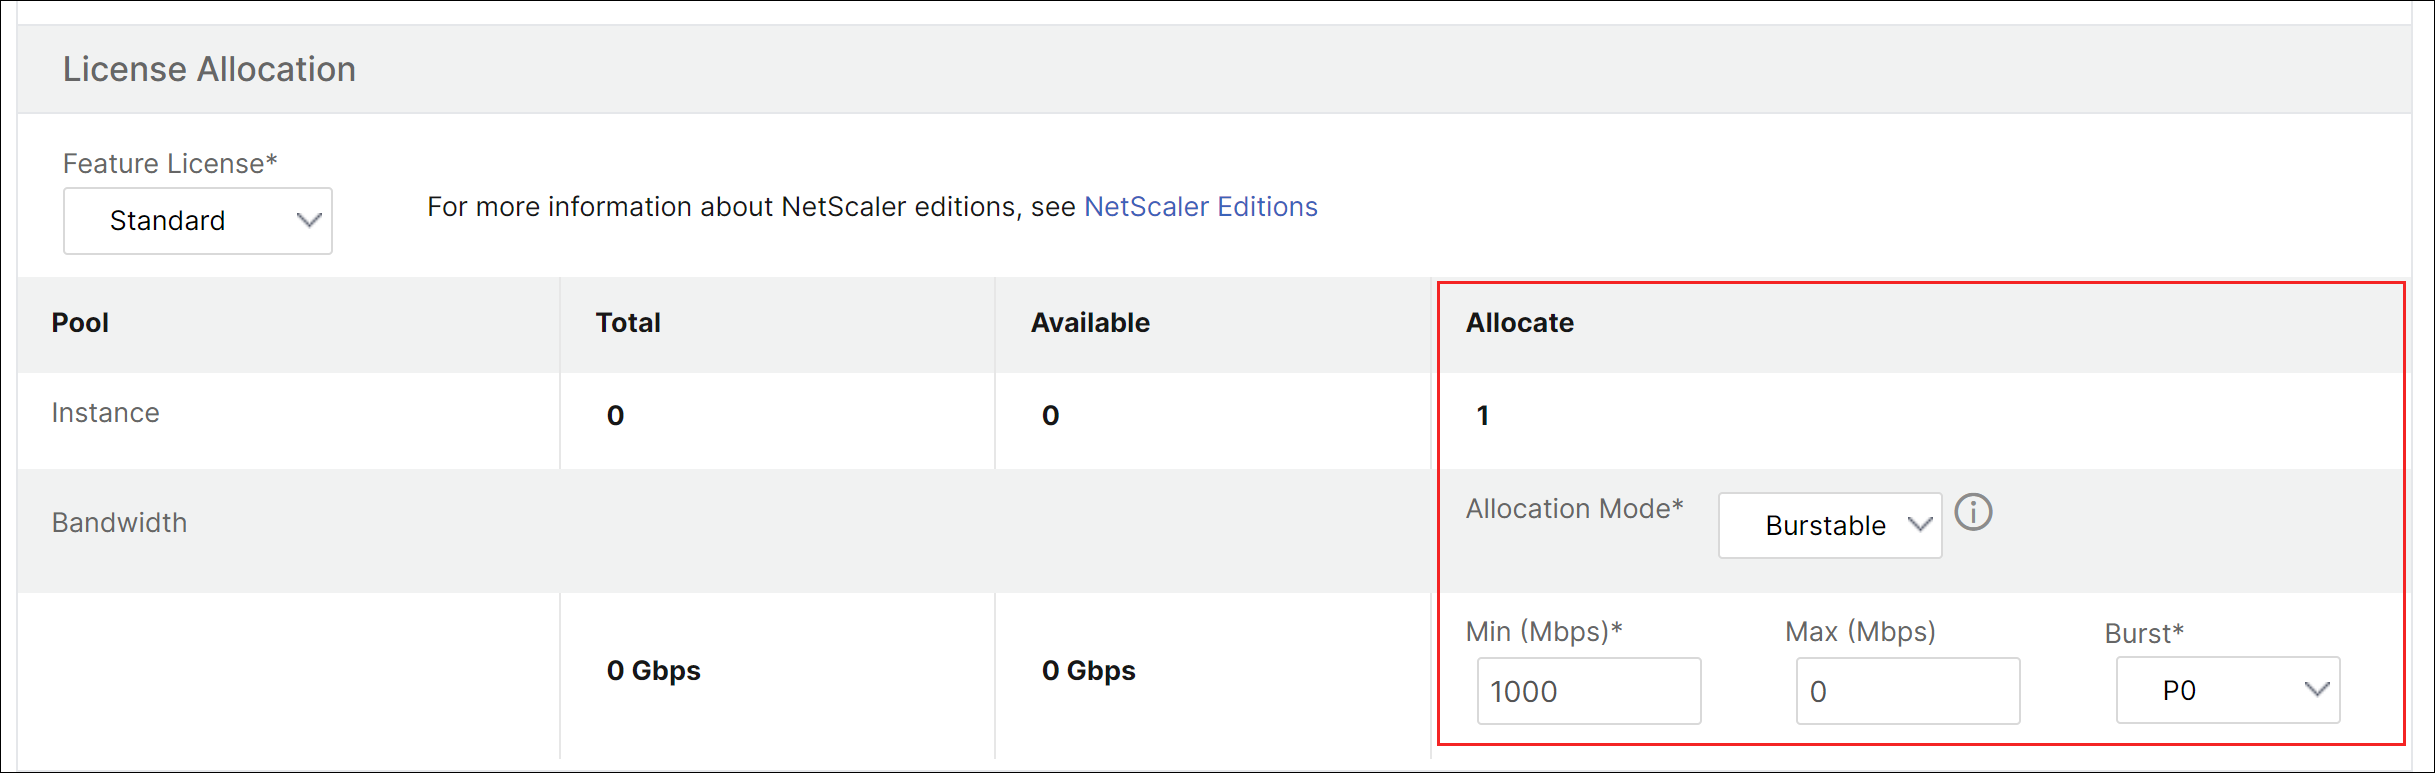
For more information about how to provision a NetScaler instance, see Provisioning NetScaler instances.
If you want to use fixed rate of throughput, select Fixed. By default, fixed mode is set for bandwidth allocation. It is not necessary that all the VPX instances work in the same mode. Each VPX instance can be configured in different mode.
Note: If you are migrating SDX from 10.5.e and earlier versions, by default all the VPX instances are in the fixed allocation mode.
Determining the maximum burst bandwidth for a VPX instance
The extent to which each VPX is allowed to burst is computed through an algorithm. When you provision a VPX with burstable bandwidth, then each such VPX has to be given a priority. The allocation of burstable bandwidth depends on this burst priority. The priority varies from P0 to P4 with P0 being the highest priority and P4 being the lowest.
Let us take a case where there are 2 VPX, namely VPX1 and VPX2. The minimum bandwidth allocated to VPX1 and VPX2 is 4 Gbps and 2 Gbps respectively with a burstable bandwidth of 2 Gbps and 1 Gbps each. The following table depicts the parameters:
| VPX Name | Parameter | Value | |
|---|---|---|---|
| VPX1 | Minimum assured bandwidth | 4Gbps | |
| - | - | Maximum Burstable bandwidth | 2Gbps |
| - | - | Priority | P0 |
| VPX2 | Minimum assured bandwidth | 2Gbps | |
| - | - | Maximum Burstable bandwidth | 1Gbps |
| - | - | Priority | P1 |
In this case, let us assume that the total licensed bandwidth is 8 Gbps. If both the VPX instances are bursting to their maximum burstable limits, that is:
- VPX1 is using its maximum burstable bandwidth, that is 2 Gbps then it is using a total of 4 + 2 = 6 Gbps
- VPX2 is using its maximum burstable bandwidth, that is 1 Gbps then it is using a total of 2 + 1 = 3 Gbps
In this case the maximum bandwidth that is used is more than the licensed capacity of 8 Gbps. So to bring down the usage to a bandwidth within the licensed capacity, one of the VPX would have to give up its burstable bandwidth. In this case since VPX2 has lower priority than VPX1, so it gives up its 1 Gbps burstable bandwidth. VPX1 would continue to burst as it has higher priority than VPX2. In all such scenarios, it is made sure that the minimum guaranteed bandwidth is always honored.
Checking the throughput and data consumption statistics
For each VPX, you can check the throughput and data consumption statistics in the graphs. To access the graphs, follow these steps:
- From the SDX Management Service, go to Configuration > NetScaler > Instances page.
- Select a VPX instance and then click the Action drop list.
- From the list select either Throughput Statistics or Data Usage Statistics.
The graphs provide you to check the data consumption and throughput statistics for various periods of time, like:
- Last 1 hour
- Last 1 day
- Last 1 week
- Last 1 month, and
- Previous month
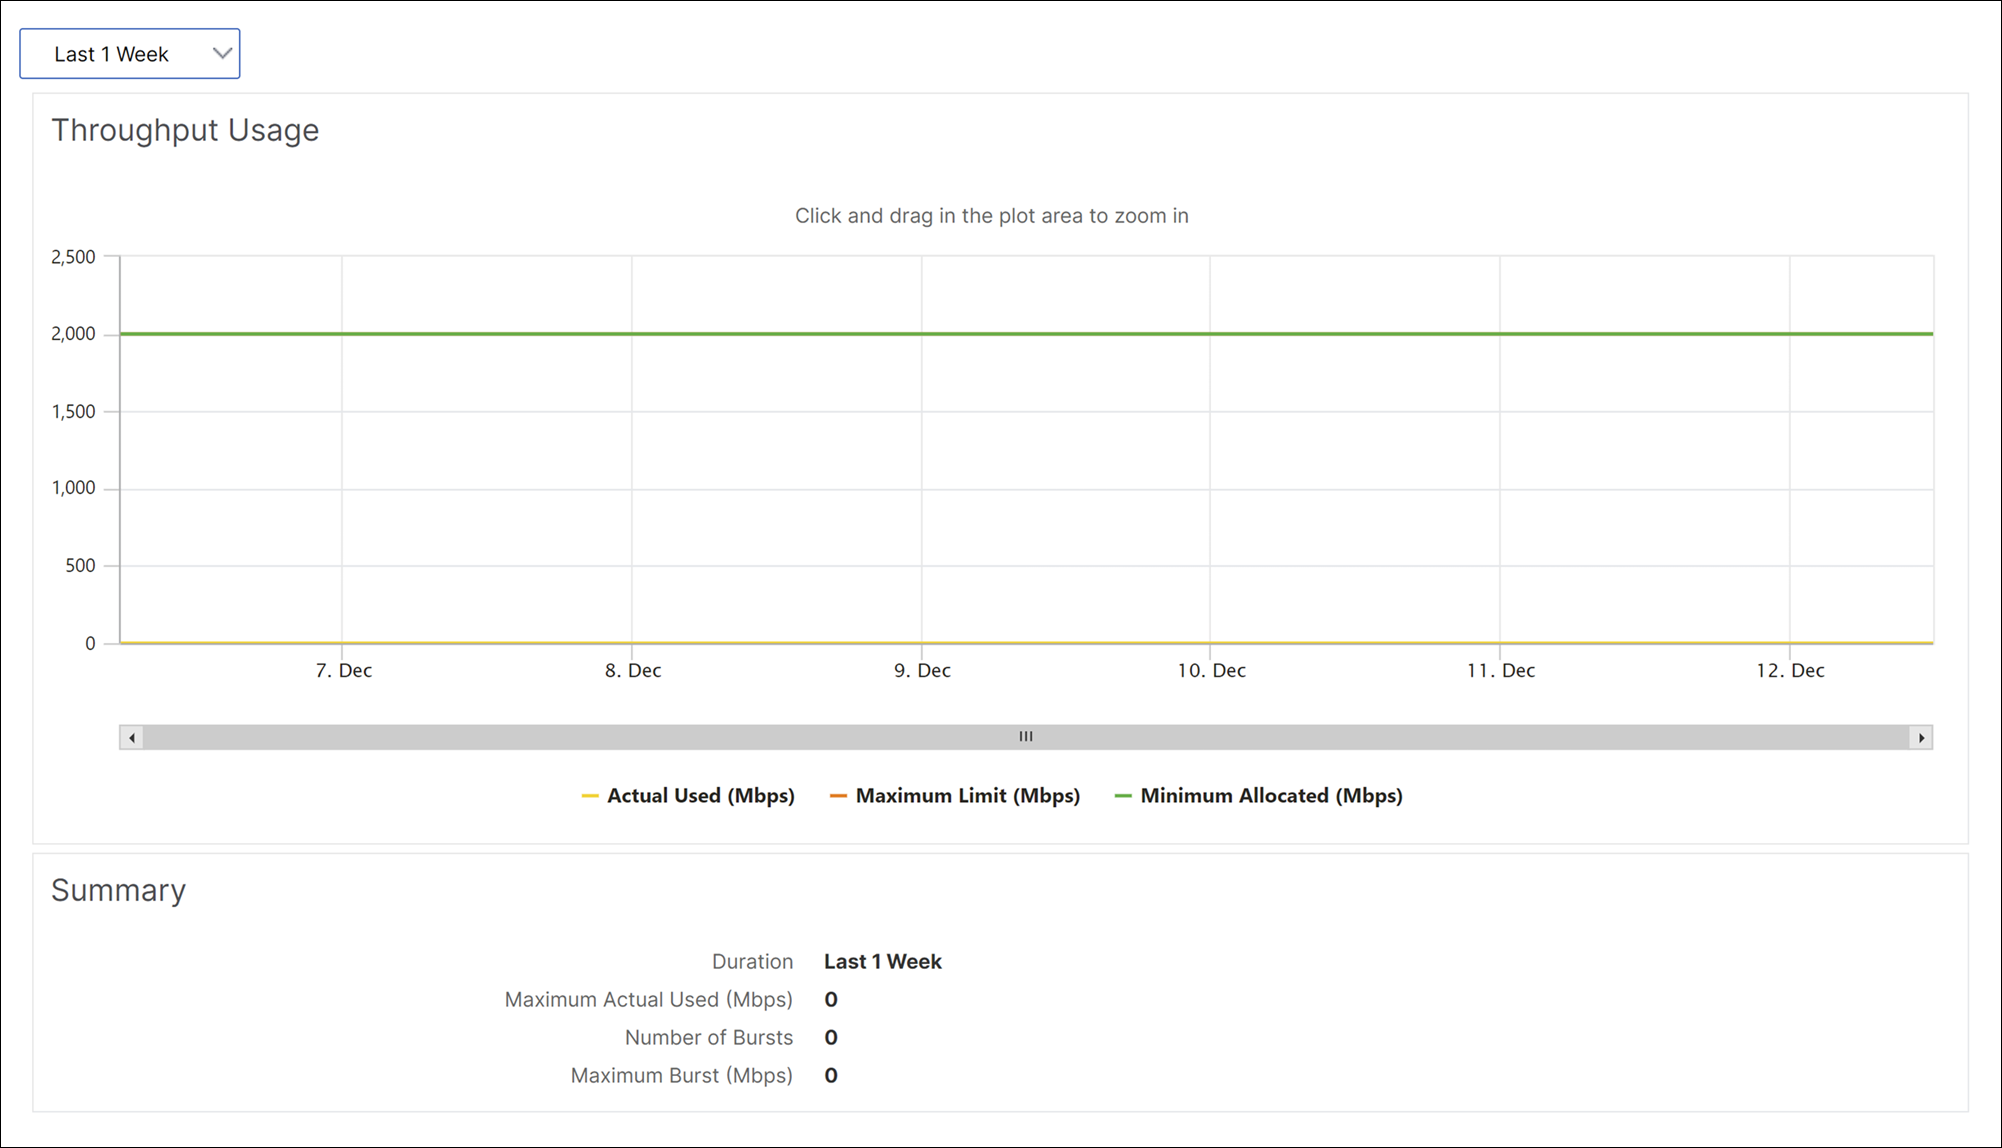
You can also select a specific time period in the graph by adjusting the slider at the bottom of the graph. Move your mouse over the lines in the graph to check the data consumption or throughput data for a specific time.
The following illustration shows a sample graph of throughput data for 1 week: