This content has been machine translated dynamically.
Dieser Inhalt ist eine maschinelle Übersetzung, die dynamisch erstellt wurde. (Haftungsausschluss)
Cet article a été traduit automatiquement de manière dynamique. (Clause de non responsabilité)
Este artículo lo ha traducido una máquina de forma dinámica. (Aviso legal)
此内容已经过机器动态翻译。 放弃
このコンテンツは動的に機械翻訳されています。免責事項
이 콘텐츠는 동적으로 기계 번역되었습니다. 책임 부인
Este texto foi traduzido automaticamente. (Aviso legal)
Questo contenuto è stato tradotto dinamicamente con traduzione automatica.(Esclusione di responsabilità))
This article has been machine translated.
Dieser Artikel wurde maschinell übersetzt. (Haftungsausschluss)
Ce article a été traduit automatiquement. (Clause de non responsabilité)
Este artículo ha sido traducido automáticamente. (Aviso legal)
この記事は機械翻訳されています.免責事項
이 기사는 기계 번역되었습니다.책임 부인
Este artigo foi traduzido automaticamente.(Aviso legal)
这篇文章已经过机器翻译.放弃
Questo articolo è stato tradotto automaticamente.(Esclusione di responsabilità))
Translation failed!
Troubleshoot applications
Real-time application monitoring
You can troubleshoot applications and sessions by using the idle time metric to identify instances that are idle beyond a specific time limit.
Typical use cases for application-based troubleshooting are in the healthcare sector, where employees share application licenses. There, you must end idle sessions and application instances to purge the XenApp and XenDesktop® environment, to reconfigure poorly performing servers, or to maintain and upgrade applications.
The Application Instances filter page lists all application instances on VDAs of Server and Desktop OS. The associated idle time measurements are displayed for application instances on VDAs of Server OS that have been idle for at least 10 minutes.
Note: The Application Instances metrics are available on Sites of all license editions.
Use this information to identify the application instances that are idle beyond a specific time period and log off or disconnect them as appropriate. To do this, select Filters > Application Instances and select a pre-saved filter or choose All Application Instances and create your own filter.
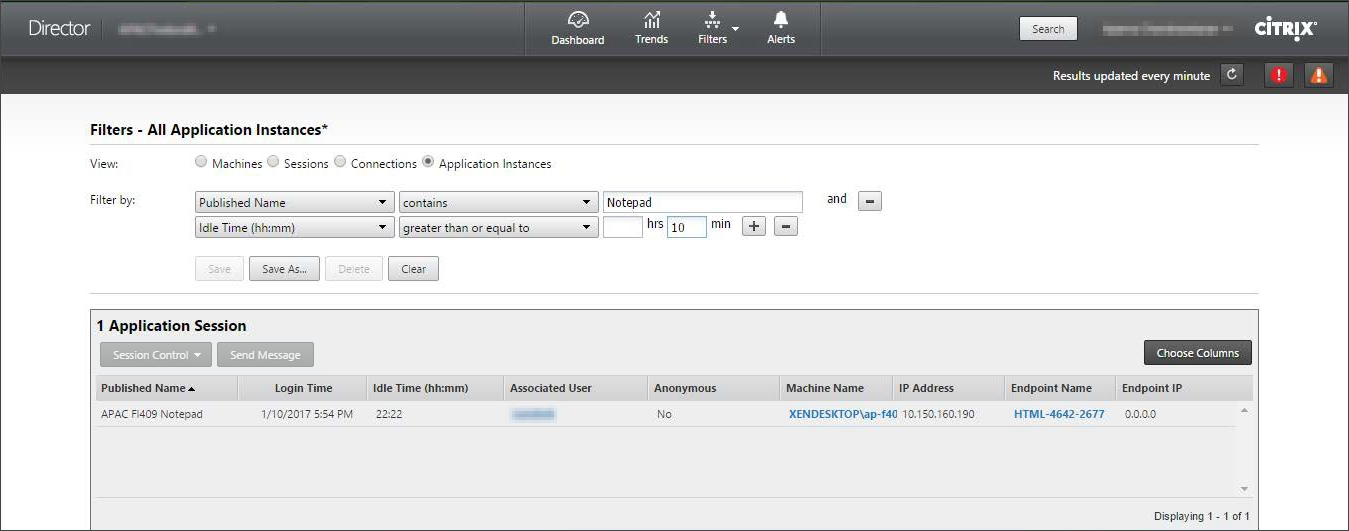
An example of a filter would be as follows. As Filter by criteria, choose Published Name (of the application) and Idle Time. Then, set Idle Time to greater than or equal to a specific time limit and save the filter for reuse. From the filtered list, select the application instances. Select option to send messages or from the Session Control drop-down, choose Logoff or Disconnect to end the instances.
Note: Logging off or disconnecting an application instance logs off or disconnects the current session, thereby ending all application instances that belong to the same session.
You can identify idle sessions from the Sessions filter page using the session state and the session idle time metric. Sort by the Idle Time column or define a filter to identify sessions that are idle beyond a specific time limit. Idle time is listed for sessions on VDAs of Server OS that have been idle for at least 10 minutes.
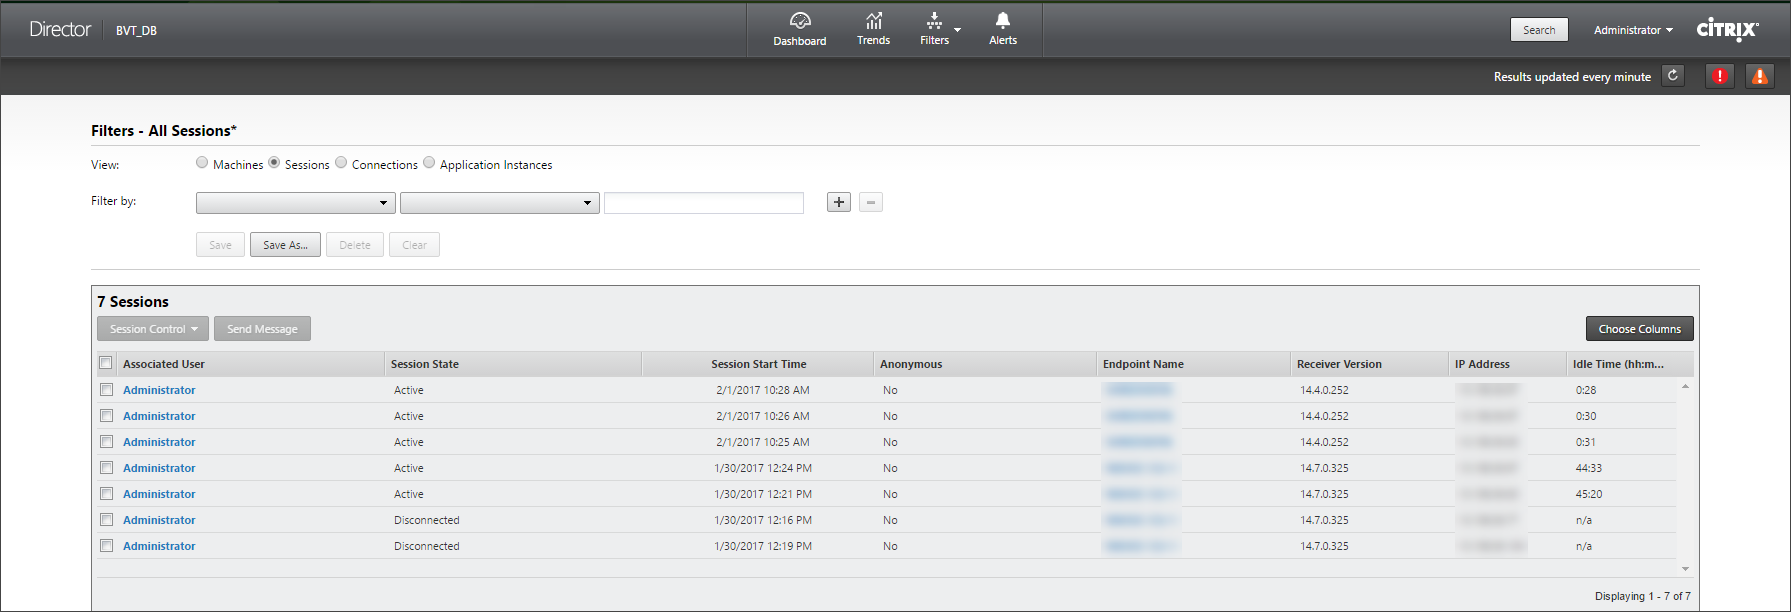
The Idle time is displayed as N/A when the session or application instance
- has not been idle for more than 10 minutes,
- is launched on a VDA of Desktop OS, or
- is launched on a VDA running Version 7.12 or earlier.
Historical application failure monitoring
The Trends -> Application Failures tab displays failures associated with the published applications on the VDAs.
Application failure trends are available for the last 2 hours, 24 hours, 7 days, and month for Platinum and Enterprise licensed Sites. They are available for the last 2 hours, 24 hours, and 7 days for other license types. The application failures that are logged to the Event Viewer with source “Application Errors” are monitored. Click Export to generate reports in CSV, Excel or PDF formats
The grooming retention settings for application failure monitoring, GroomApplicationErrorsRetentionDays and GroomApplicationFaultsRetentionDays are set to one day by default for both Platinum and non-Platinum licensed Sites. You can change this setting using the PowerShell command:
*Set-MonitorConfiguration -\<setting name\> \<value\>*
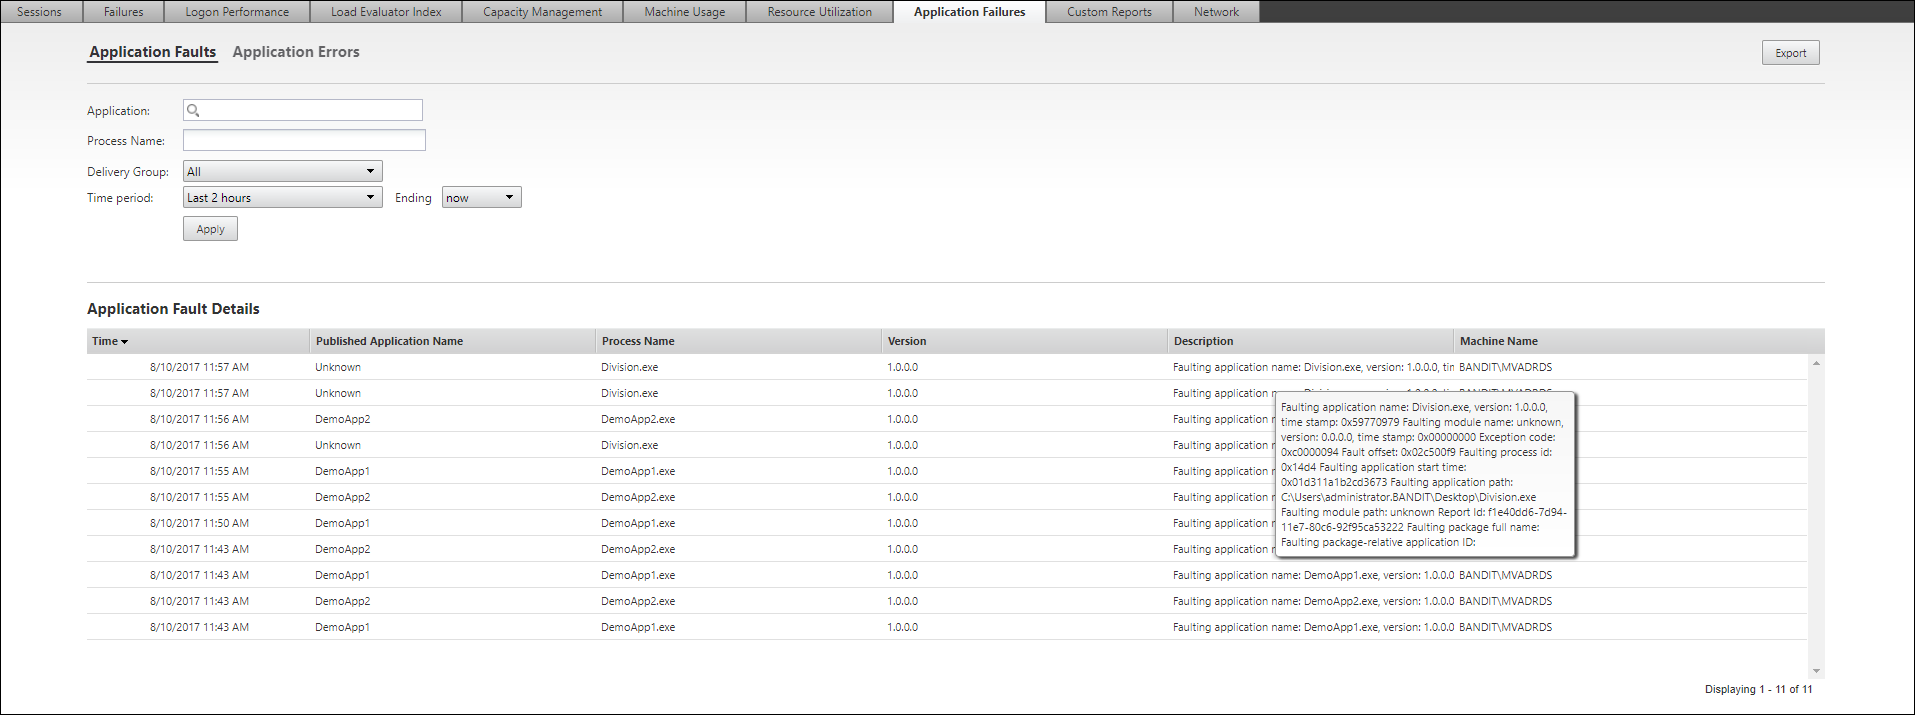
The failures are displayed as Application Faults or Application Errors based on their severity. The Application Faults tab displays failures associated with loss of functionality or data. Application Errors indicate problems that are not immediately relevant; they signify conditions that might cause future problems.
You can filter the failures based on Published Application Name, Process Nameor Delivery Group and Time Period. The table displays the fault or error code and a brief description of the failure. The detailed failure description is displayed as a tooltip.
Note: The Published Application name is displayed as “Unknown” when the corresponding application name cannot be derived. This typically occurs when a launched application fails in a desktop session or when it fails due to an unhandled exception caused by a dependent executable.
By default, only faults of applications hosted on Server OS VDAs are monitored. You can modify the monitoring settings through the Monitoring Group Policies: Enable monitoring of application failures, Enable monitoring of application failures on Desktop OS VDAs, and List of applications excluded from failure monitoring. For more information, see Policies for application failure monitoring in Monitoring policy settings.
Share
Share
This Preview product documentation is Citrix Confidential.
You agree to hold this documentation confidential pursuant to the terms of your Citrix Beta/Tech Preview Agreement.
The development, release and timing of any features or functionality described in the Preview documentation remains at our sole discretion and are subject to change without notice or consultation.
The documentation is for informational purposes only and is not a commitment, promise or legal obligation to deliver any material, code or functionality and should not be relied upon in making Citrix product purchase decisions.
If you do not agree, select I DO NOT AGREE to exit.