-
Configuration guide for Citrix Virtual Apps and Desktops workloads
-
Citrix SD-WAN Orchestrator on-premises configuration on Citrix SD-WAN appliance
-
-
This content has been machine translated dynamically.
Dieser Inhalt ist eine maschinelle Übersetzung, die dynamisch erstellt wurde. (Haftungsausschluss)
Cet article a été traduit automatiquement de manière dynamique. (Clause de non responsabilité)
Este artículo lo ha traducido una máquina de forma dinámica. (Aviso legal)
此内容已经过机器动态翻译。 放弃
このコンテンツは動的に機械翻訳されています。免責事項
이 콘텐츠는 동적으로 기계 번역되었습니다. 책임 부인
Este texto foi traduzido automaticamente. (Aviso legal)
Questo contenuto è stato tradotto dinamicamente con traduzione automatica.(Esclusione di responsabilità))
This article has been machine translated.
Dieser Artikel wurde maschinell übersetzt. (Haftungsausschluss)
Ce article a été traduit automatiquement. (Clause de non responsabilité)
Este artículo ha sido traducido automáticamente. (Aviso legal)
この記事は機械翻訳されています.免責事項
이 기사는 기계 번역되었습니다.책임 부인
Este artigo foi traduzido automaticamente.(Aviso legal)
这篇文章已经过机器翻译.放弃
Questo articolo è stato tradotto automaticamente.(Esclusione di responsabilità))
Translation failed!
Monitoring Virtual WAN
Viewing Basic Information for an Appliance
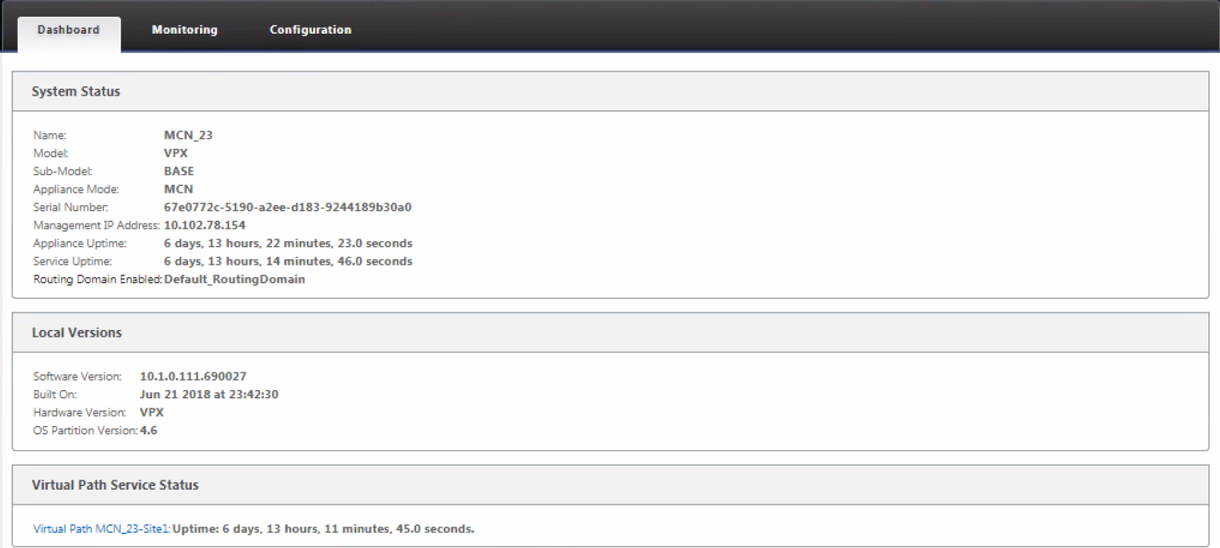
Use a browser to connect to the Management Web Interface of the appliance you want to monitor, and click the Dashboard tab to display basic information for that appliance.
The Dashboard page displays the following basic information for the local appliance:
System Status:
-
Name – This is the name you assigned to the appliance when you added it to the system.
-
Model – This is the Virtual WAN appliance model number.
-
Appliance Mode – This indicates whether this appliance has been configured as the primary or secondary MCN, or as a client appliance.
-
Management IP Address – This is the Management IP Address for the appliance.
-
Appliance Uptime – This specifies the duration for which the appliance has been running since the last reboot.
-
Service Uptime – This specifies the duration for which the Virtual WAN Service has been running since the last restart.
Virtual Path Service Status:
Virtual Path [site name] – This displays the status of all the Virtual Paths associated with this appliance. If the Virtual WAN Service is enabled, this section is included on the page. If the Virtual WAN Service is disabled, an Alert icon (goldenrod delta) and Alert message to that effect displays in place of this section.
Local Version Information:
- Software version – This is the version of the CloudBridge Virtual Path software package currently activated on the appliance.
- Build on – This is the build date for the product version currently running on the local appliance.
- Hardware version – This is the hardware model number and version of the appliance.
- OS Partition Version – This is the version of the OS partition currently active on the appliance.
The below figure shows a sample Dashboard page.
Share
Share
This Preview product documentation is Cloud Software Group Confidential.
You agree to hold this documentation confidential pursuant to the terms of your Cloud Software Group Beta/Tech Preview Agreement.
The development, release and timing of any features or functionality described in the Preview documentation remains at our sole discretion and are subject to change without notice or consultation.
The documentation is for informational purposes only and is not a commitment, promise or legal obligation to deliver any material, code or functionality and should not be relied upon in making Cloud Software Group product purchase decisions.
If you do not agree, select I DO NOT AGREE to exit.