-
Configuration guide for Citrix Virtual Apps and Desktops workloads
-
Citrix SD-WAN Orchestrator on-premises configuration on Citrix SD-WAN appliance
-
-
This content has been machine translated dynamically.
Dieser Inhalt ist eine maschinelle Übersetzung, die dynamisch erstellt wurde. (Haftungsausschluss)
Cet article a été traduit automatiquement de manière dynamique. (Clause de non responsabilité)
Este artículo lo ha traducido una máquina de forma dinámica. (Aviso legal)
此内容已经过机器动态翻译。 放弃
このコンテンツは動的に機械翻訳されています。免責事項
이 콘텐츠는 동적으로 기계 번역되었습니다. 책임 부인
Este texto foi traduzido automaticamente. (Aviso legal)
Questo contenuto è stato tradotto dinamicamente con traduzione automatica.(Esclusione di responsabilità))
This article has been machine translated.
Dieser Artikel wurde maschinell übersetzt. (Haftungsausschluss)
Ce article a été traduit automatiquement. (Clause de non responsabilité)
Este artículo ha sido traducido automáticamente. (Aviso legal)
この記事は機械翻訳されています.免責事項
이 기사는 기계 번역되었습니다.책임 부인
Este artigo foi traduzido automaticamente.(Aviso legal)
这篇文章已经过机器翻译.放弃
Questo articolo è stato tradotto automaticamente.(Esclusione di responsabilità))
Translation failed!
Viewing Reports
This section provides basic instructions for generating and viewing Virtual WAN reports about the local appliance using the Management Web Interface. An appliance can maintain up to 30 archives and purge the oldest archives which are more than 30 entries.
Note
Reports generated on the Management Web Interface apply to the local appliance, only. To generate and view reports for the Virtual WAN, use the Virtual WAN Center Web Interface.
To generate and view Virtual WAN reports, do the following:
-
Log on to the Management Web Interface for the MCN, and select the Monitoring tab.
This opens the Monitoring navigation tree in the left pane.
-
Select a report type from the navigation tree.
The report types are listed as branches in the navigation tree, just below the Flows branch.
The available report types are as follows:
-
Performance Reports
-
QoS Reports
-
Usage Reports
-
Availability Reports
-
Appliance Reports
-
-
Select the report options.
In addition to the various types of reports, for each report type there are numerous options and filters for refining report results.
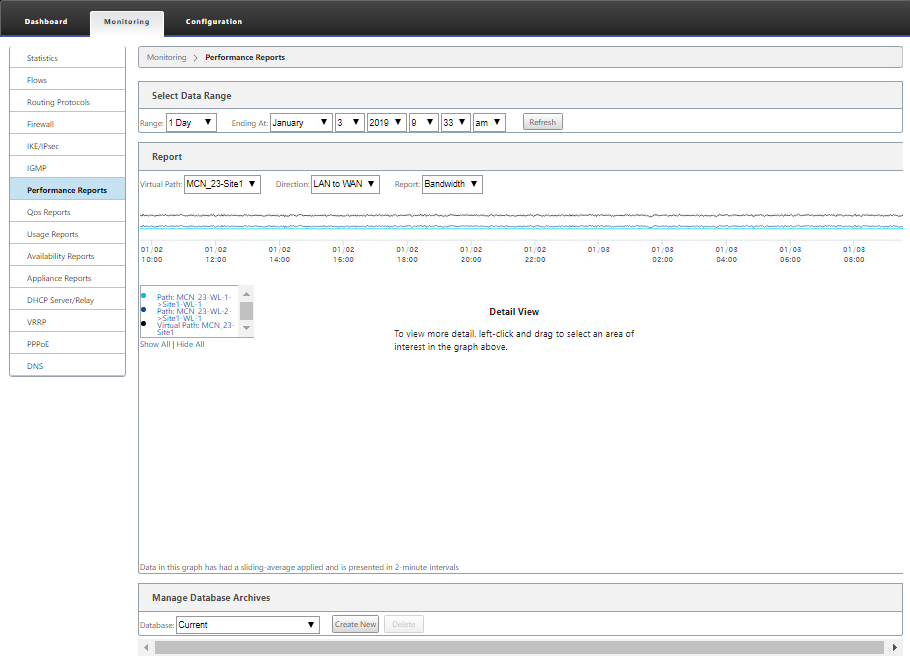
Performance reports
Citrix SD-WAN can show performance statistics at the site, virtual path, or Direction (LAN to WAN and WAN to LAN) level. With Citrix SD-WAN, you can collect metrics that show the efficiency of each link in milliseconds. To view more detail, left-click and select a specific area of path or time frame in the graph line.
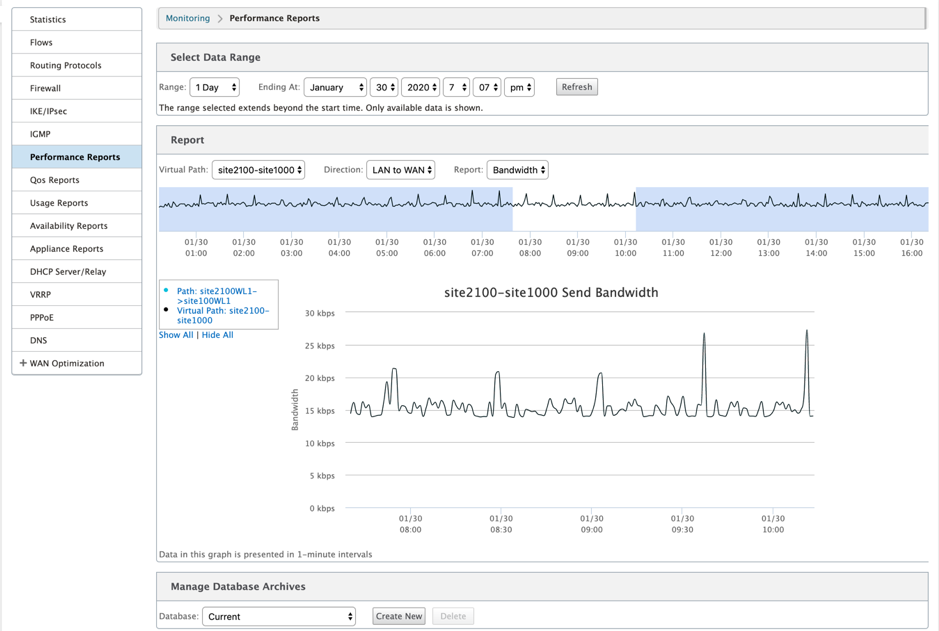
You can select the data range as needed with the following fields to view the performance report:
- Virtual Path: Select the Virtual Path from the drop-down list.
- Direction: Select the Direction as required (LAN to WAN or WAN to LAN).
-
Report: Select the following network parameters to view the report:
- Bandwidth
- Latency
- Jitter
- Loss
- Quality
QoS reports
You can monitor the application QoS report such as the number of packets or bytes uploaded, downloaded, or dropped at each Site, WAN Link, Virtual Path, and Path level.
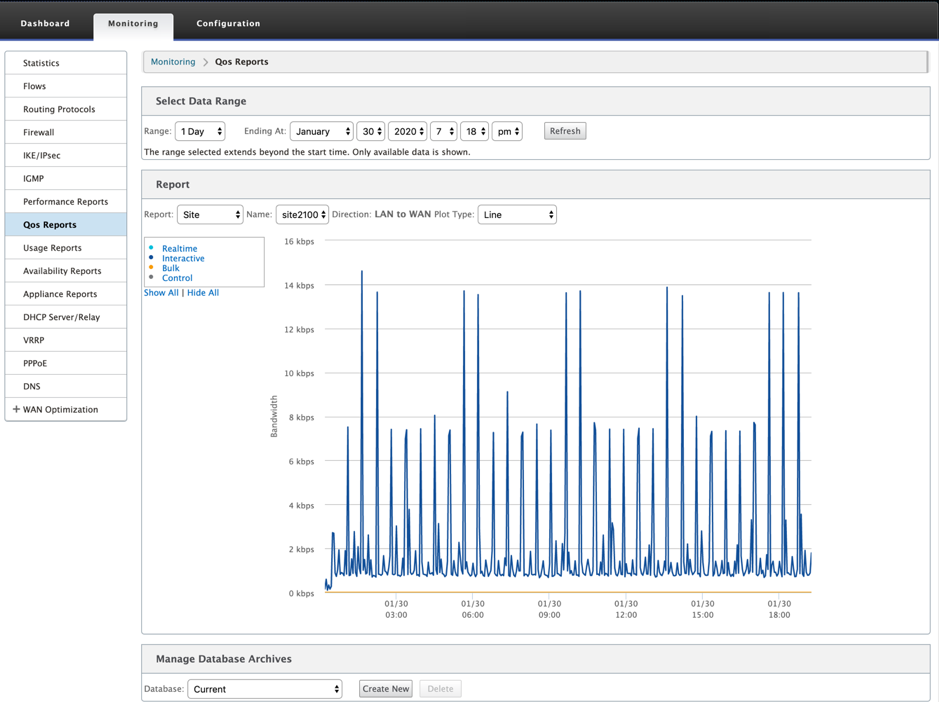
You can view the following metrics:
- Real-time: Bandwidth consumed by applications that belong to the real-time class type in the Citrix SD-WAN configuration. The performance of such applications depends on a great extent upon network latency. A delayed packet is worse than a lost packet (for example, VoIP, Skype for Business).
- Interactive: Bandwidth consumed by applications that belong to the interactive class type in the Citrix SD-WAN configuration. The performance of such applications depends on a great extent upon network latency, and packet loss (for example, XenDesktop, XenApp).
- Bulk: Bandwidth consumed by applications that belong to the bulk class type in the Citrix SD-WAN configuration. These applications involve little human intervention and are mostly handled by the systems themselves (for example, FTP, backup operations).
- Control: Bandwidth used to transfer control packets that contain routing, scheduling, and link statistics information.
Usage reports
The Usage reports deliver the Virtual paths usage information.
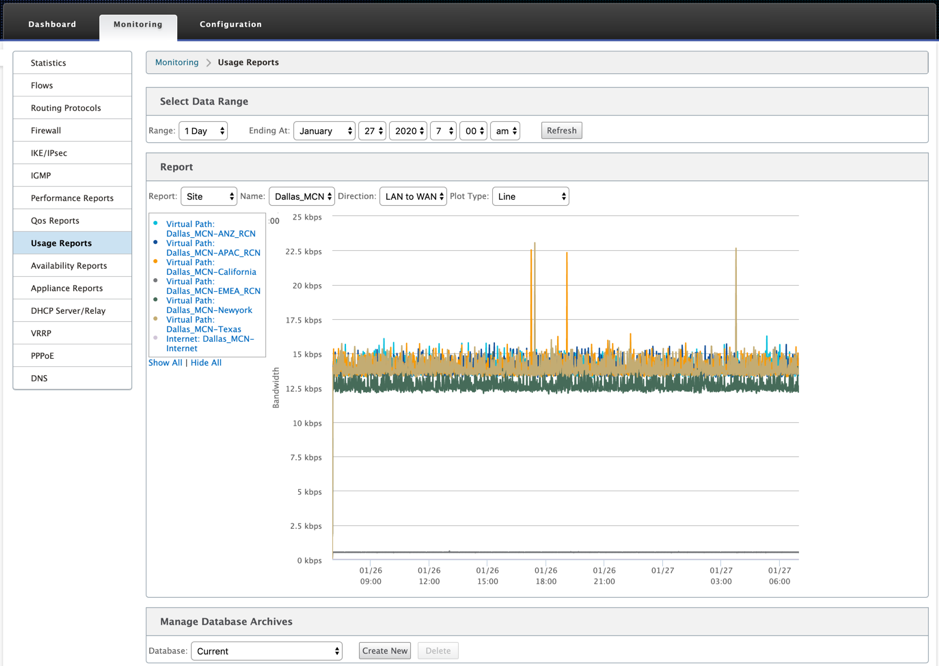
- Report: Select Site or WAN Link from the drop-down list to view the report.
- Name: Select the name of the site or WAN link from the drop-down list.
- Direction: Select the direction as required (LAN to WAN or WAN to LAN).
- Plot Type: Select the Plot type from the drop-down list (Line or Area).
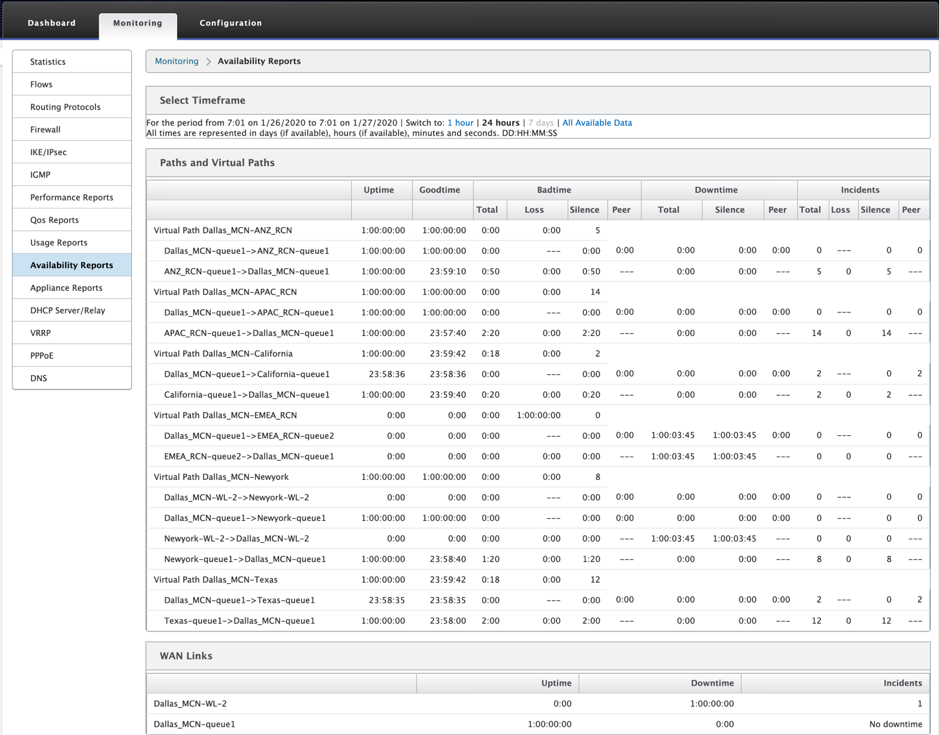
Availability reports
In this report, you can view the availability data of WAN Links, Paths, and Virtual Paths. You can also switch to or choose a specific time frame, such as 1 hour, 24 hours, and 7 days to see the available data. The Paths and Virtual Paths data are represented in a DD:HH:MM:SS format.
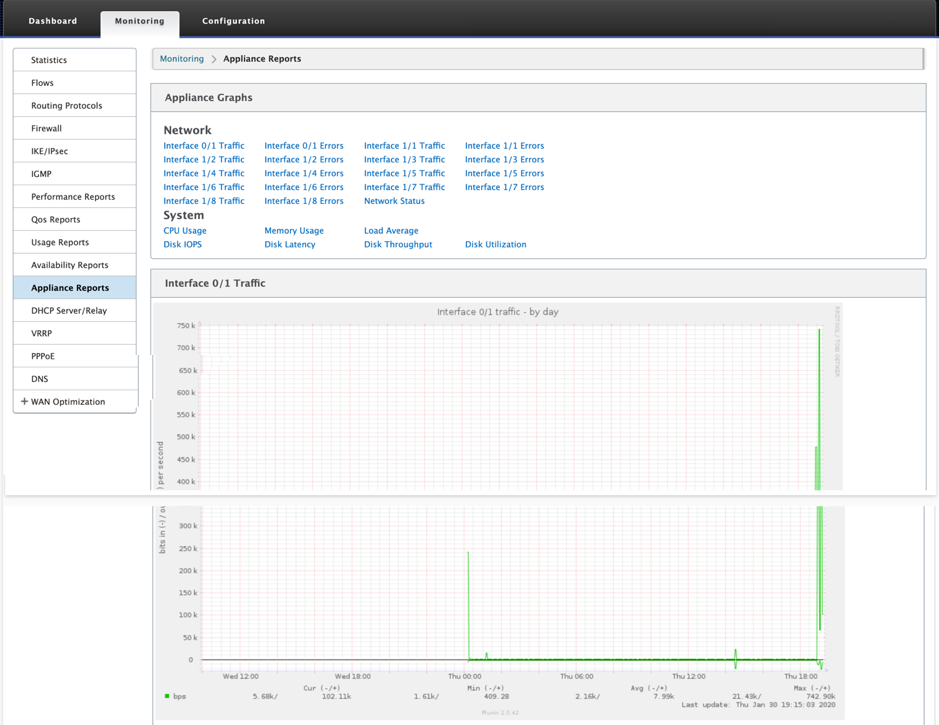
Appliance reports
Appliance report delivers Network traffic and System usage reports. Click each link to view or monitor the appliance graph by day, weekly, monthly, and yearly.
Share
Share
This Preview product documentation is Cloud Software Group Confidential.
You agree to hold this documentation confidential pursuant to the terms of your Cloud Software Group Beta/Tech Preview Agreement.
The development, release and timing of any features or functionality described in the Preview documentation remains at our sole discretion and are subject to change without notice or consultation.
The documentation is for informational purposes only and is not a commitment, promise or legal obligation to deliver any material, code or functionality and should not be relied upon in making Cloud Software Group product purchase decisions.
If you do not agree, select I DO NOT AGREE to exit.