This content has been machine translated dynamically.
Dieser Inhalt ist eine maschinelle Übersetzung, die dynamisch erstellt wurde. (Haftungsausschluss)
Cet article a été traduit automatiquement de manière dynamique. (Clause de non responsabilité)
Este artículo lo ha traducido una máquina de forma dinámica. (Aviso legal)
此内容已经过机器动态翻译。 放弃
このコンテンツは動的に機械翻訳されています。免責事項
이 콘텐츠는 동적으로 기계 번역되었습니다. 책임 부인
Este texto foi traduzido automaticamente. (Aviso legal)
Questo contenuto è stato tradotto dinamicamente con traduzione automatica.(Esclusione di responsabilità))
This article has been machine translated.
Dieser Artikel wurde maschinell übersetzt. (Haftungsausschluss)
Ce article a été traduit automatiquement. (Clause de non responsabilité)
Este artículo ha sido traducido automáticamente. (Aviso legal)
この記事は機械翻訳されています.免責事項
이 기사는 기계 번역되었습니다.책임 부인
Este artigo foi traduzido automaticamente.(Aviso legal)
这篇文章已经过机器翻译.放弃
Questo articolo è stato tradotto automaticamente.(Esclusione di responsabilità))
Translation failed!
Viewing Flow Information
This section provides basic instructions for viewing Virtual WAN flow information.
To view flow information, do the following:
-
Log into the Management Web Interface for the MCN, and select the Monitoring tab. It opens the Monitoring navigation tree in the left pane.
-
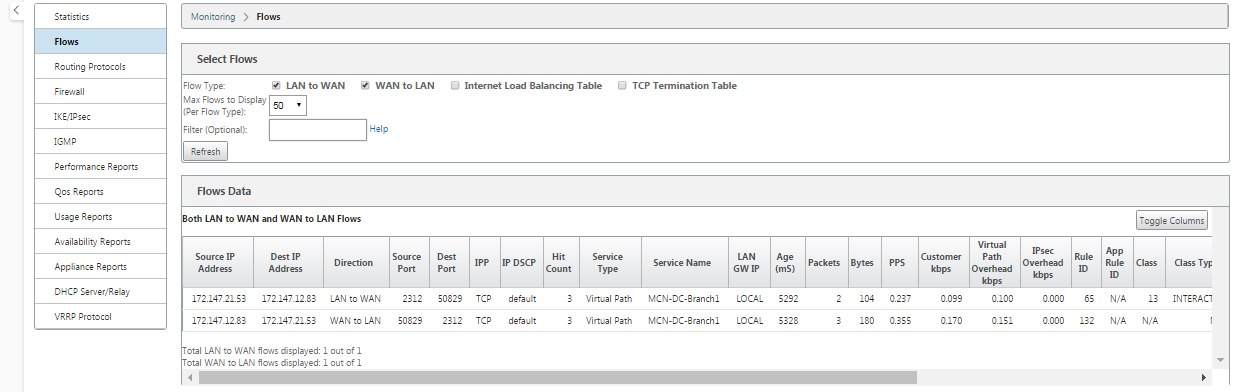
Select the Flows branch in the navigation tree. It displays the Flows page with LAN to WAN preselected in the Flow Type field.
-
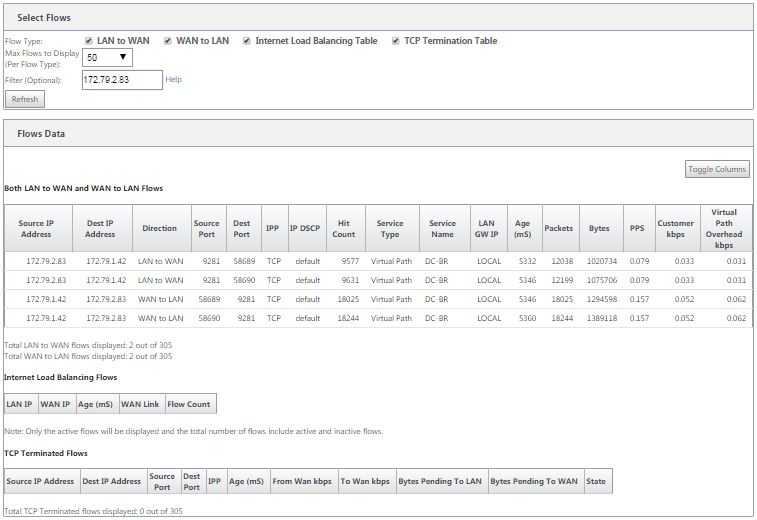
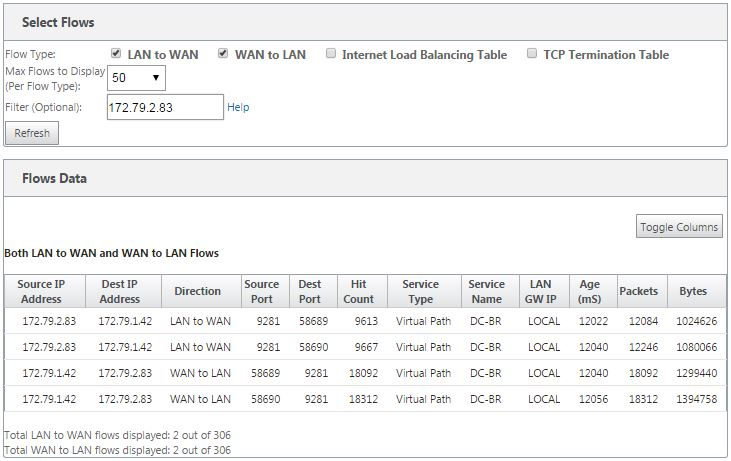
Select the Flow Type. The Flow Type field is located in the Select Flows section at the top of the Flows page. Next to the Flow Type field is a row of check box options for selecting the flow information you want to view. You can check one or more boxes to filter the information to be displayed.
-
Select the Max Flows to Display from the drop-down menu next to that field.
-
It determines the number of entries to display in the Flows table. The options are: 50, 100, 1000.
-
(Optional) Enter search text in the Filter field. It filters the table results so that only entries containing the search text display in the table.
Tip
To see detailed instructions for using filters to refine Flow table results, click Help to the right of the Filter field. To close the help display, click Refresh in the bottom left corner of the Select Flows section.
-
Click Refresh to display the filter results. The figure shows a sample Flows page filtered display with all flow types selected.
-
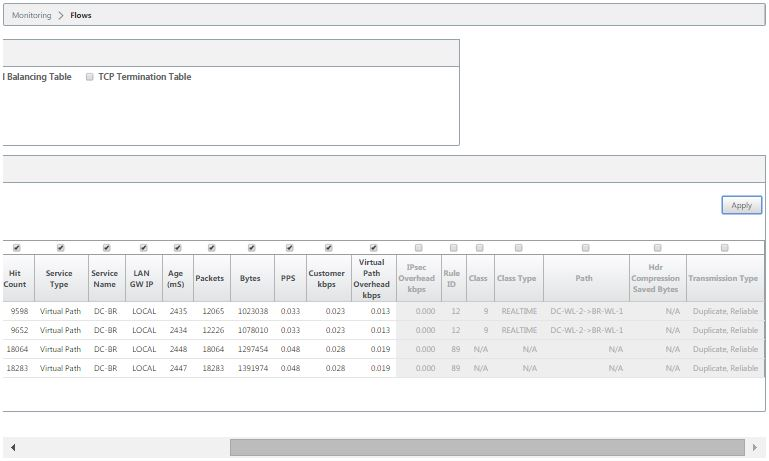
(Optional) Select the columns to include in the table. Do the following:
-
Click Toggle Columns. The Toggle Columns button is just above the top right corner of the Flows table. It reveals any deselected columns, and opens a check box above each column for selecting or deselecting that column. Deselected columns display grayed out, as shown in the figure.
Note
By default, all the columns are selected, which can cause the table to be truncated in the display, obscuring the Toggle Columns button. If so, a horizontal scroll bar displays beneath the table. Slide the scroll bar to the right to view the truncated section of the table and reveal the Toggle Columns button. If the scroll bar is not available, try resizing the width of your browser window until the scroll bar is revealed.
-
Click a check box to select or deselect a column.
-
Click Apply (above the top right corner of the table). It dismisses the selection options, and refreshes the table to include only the selected columns.
DPI Applications in SD-WAN Center
In earlier releases, around 4,000 applications and configured with 800 services (550 Virtual Paths, 256 Intranet Services) can be identified. Storing this data would impact overall system performance (CPU cycles and disk space needed to store the data). It also has an impact, if reporting on data per Usage or Path is supported.
While the data path provides information on every application gathered in a minute, the per minute stats reporting determines the top 100 applications and report on the aggregate of all other applications as “other.” If there is high diversity of trackable applications in their network, it might affect clarity of data, particularly if we want to track/graph the usage of an application over time and the application falls out of the top 100 limit.
Share
Share
In this article
This Preview product documentation is Cloud Software Group Confidential.
You agree to hold this documentation confidential pursuant to the terms of your Cloud Software Group Beta/Tech Preview Agreement.
The development, release and timing of any features or functionality described in the Preview documentation remains at our sole discretion and are subject to change without notice or consultation.
The documentation is for informational purposes only and is not a commitment, promise or legal obligation to deliver any material, code or functionality and should not be relied upon in making Cloud Software Group product purchase decisions.
If you do not agree, select I DO NOT AGREE to exit.