Diagnostics
Citrix SD-WAN Diagnostics utilities provide the following options to test and investigate connectivity issues:
- Ping
- Traceroute
- Packet Capture
- Path Bandwidth
- System Info
- Diagnostics Data
- Events
- Alarms
- Diagnostics Tool
- Site Diagnostics
The diagnostic options in the Citrix SD-WAN Dashboard control data collection.
Ping
To use the Ping option, navigate to Configuration > Diagnostics and select Ping. You can use Ping to check host reachability and network connectivity.
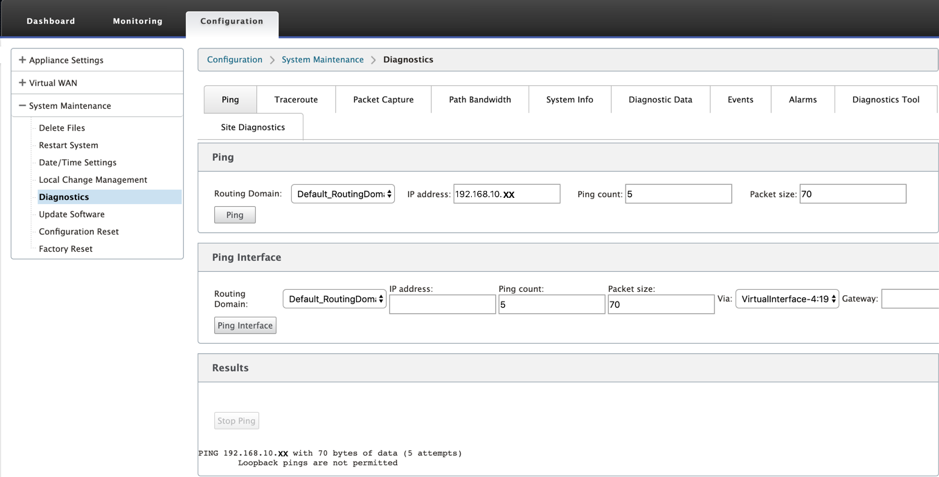
Select the routing domain. Provide a valid IP address, number of ping counts (number of times to send the ping request), and packet size (number of data bytes). Click Stop Ping to stop an ongoing ping search.
You can ping through a specific interface. Select the routing domain and specify the IP address with ping count, packet size, and select the virtual interface from the drop-down list.
Traceroute
To use Traceroute option, navigate to Configuration > expand System Maintenance > Diagnostics and select Traceroute.
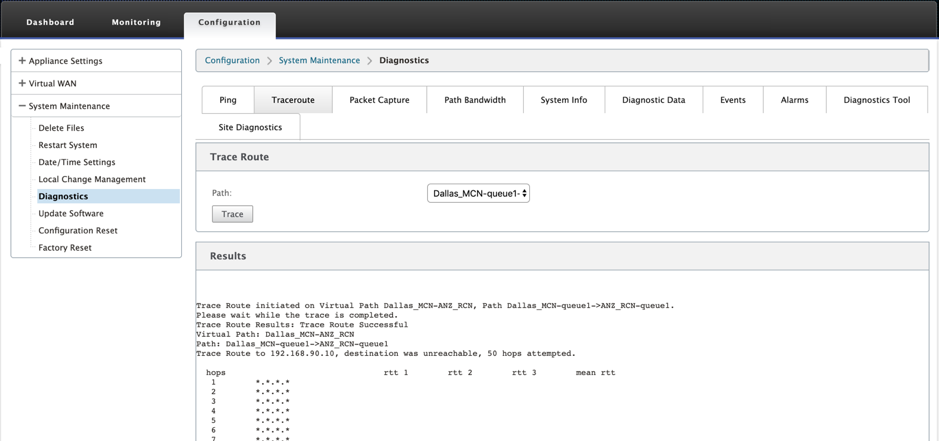
Traceroute helps to discover and show the path or route to a remote server. Use the Traceroute option as a debugging tool to detect the points of failure in a network.
Select a path from the drop-down list and click Trace. You can view the details under Results section.
Packet capture
You can use the Packet Capture option to intercept the real-time data packet that is traversing over the selected active interface present in the selected site. Packet capture helps you to analyze and troubleshoot the network issues.
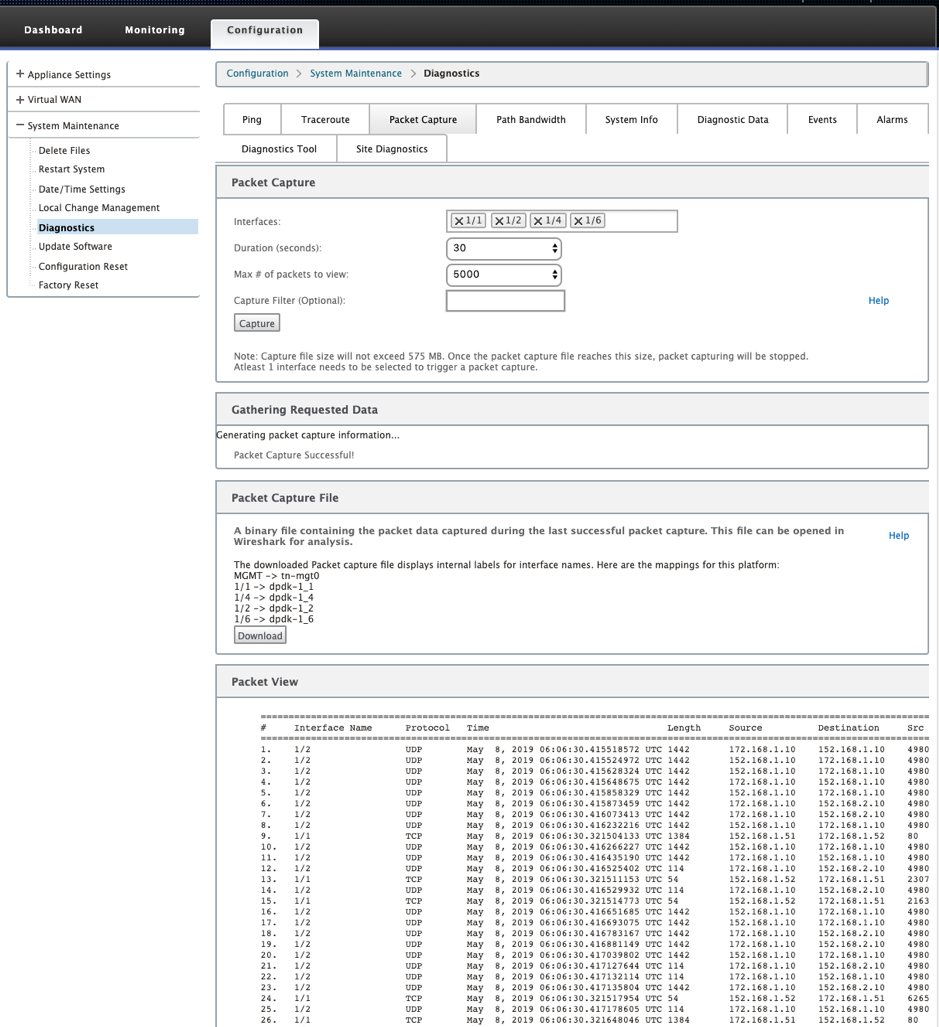
Provide the following inputs for packet capture operation:
-
Interfaces - Active interfaces are available for packet capture for the SD-WAN appliance. Select an interface or add interfaces from the drop-down list. At least one interface needs to be selected to trigger a packet capture.
Note:
The ability to run packet capture across all the interfaces at once helps to speed up the troubleshooting task.
- Duration(seconds) – Duration (in seconds) for how long the data have to be captured.
- Max # of packets to view - Maximum limit of packets to view in the packet capture result.
- Capture Filter (Optional) - The optional Capture Filter field accepts a filter string that is used to determine which packets are captured. Packets are compared to the filter string and if the comparison result is true, then the packet is captured. If the filter is empty, then all packets are captured. For more information, see Capture Filters.
Following are some examples of this capture filter:
- Ether proto\ARP - Captures only ARP packets
- Ether proto\IP - Captures only IPv4 packets
- VLAN 100 - Captures only packets with a VLAN of 100
- Host 10.40.10.20 - Captures only IPv4 packets to or from the host with the address 10.40.10.20
- Net 10.40.10.0 Mask 255.255.255.0 - Captures only IPv4 packets in the 10.40.10.0/24 subnet
- IP proto \ TCP - Captures only IPv4/TCP packets
- Port 80 - Captures only IP packets to or from port 80
- Port range 20–30 - Captures only IP packets to or from ports 20 through 30
Note
The maximum capture file size limit is up to 575 MB. Once the packet capture file reaches this size, packet capturing is stopped.
Click Capture to view the packet capture result. You can also download a binary file containing the packet data captured during the last successful packet capture.
Gathering requested data
You can see the status of generating packet capture information (whether packet capture is successful or no packet capture) in this table.
Packet capture file
Packets are captured as a binary data during the last successful packet capture. You can download the binary file to analyze the packet information offline. The interfaces name is different in the downloaded file as compared to the GUI interface. To view the internal interface mapping, click the Help option.
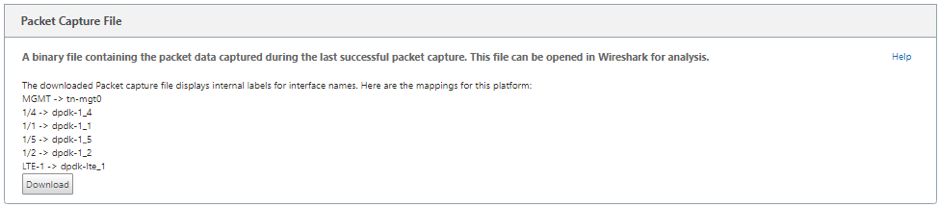
You need Wireshark software 2.4.13 version or higher to open and read the binary file.
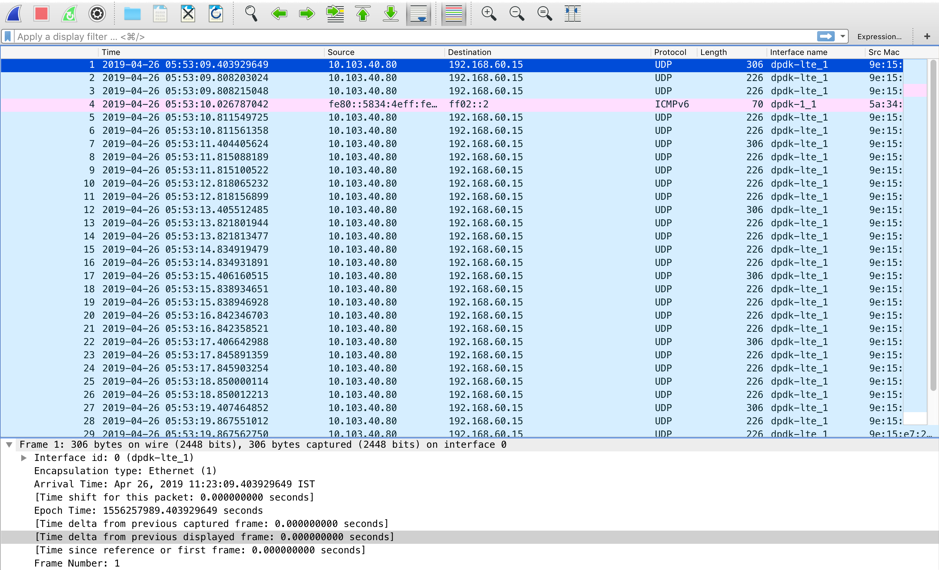
Packet view
If the packet capture file size is more, it takes more time to complete the rendering process for the packet view. In this case, it is recommended to download the file and use Wireshark for analysis instead of relying on the Packet View result.
Path bandwidth
To use the Path Bandwidth feature, navigate to Configuration > expand System Maintenance > Diagnostics and select Path Bandwidth.
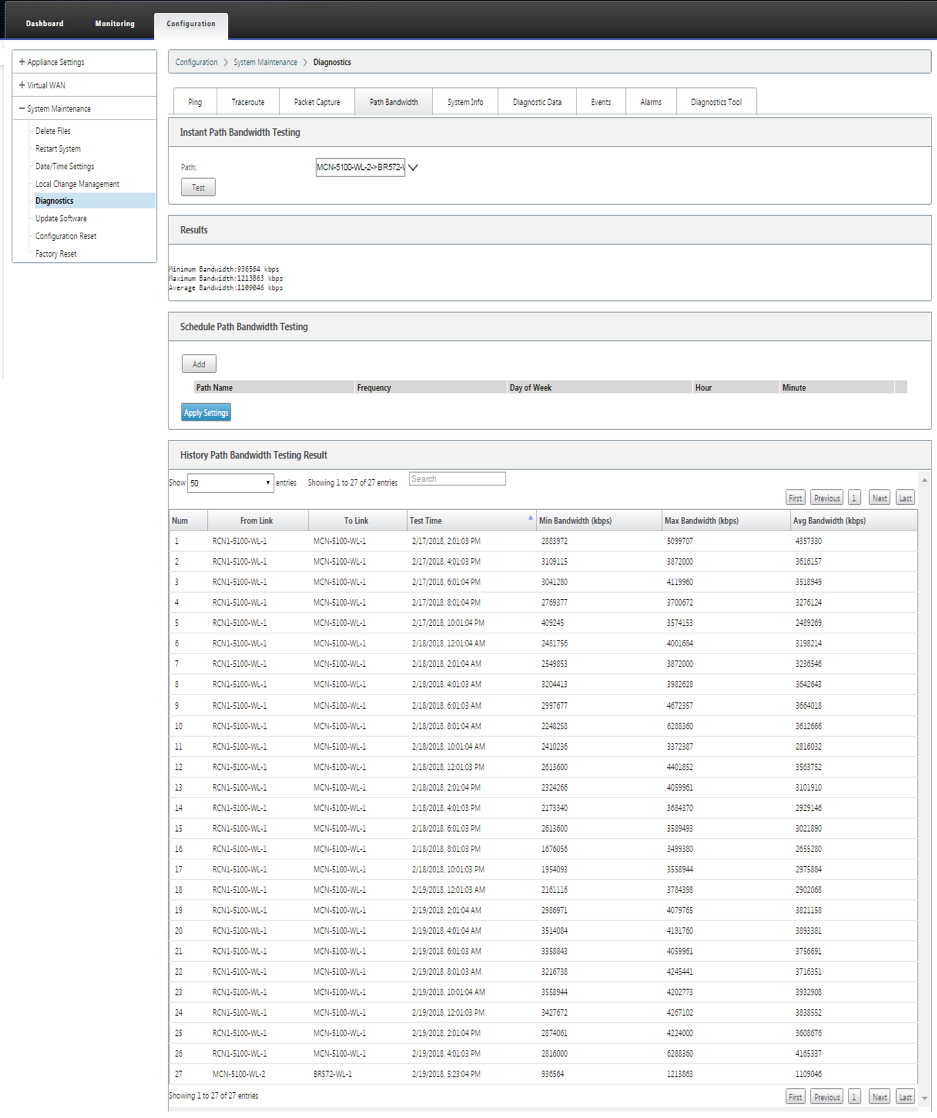
Active bandwidth testing enables you the ability to issue an instant path bandwidth test through public internet WAN link, or to schedule public internet WAN link bandwidth testing to be completed at specific times on a recurring basis.
The Path Bandwidth feature is useful for demonstrating how much bandwidth is available between two locations during new and existing installations. The values from the Path Bandwidth indicate maximum possible bandwidth. For an accurate allowed bandwidth, navigate to Configuration > System Maintenance > Diagnostics > Site Diagnostics > Bandwidth Test. For more information, see Active Bandwidth Testing.
System info
The System Info page provides the system information, ethernet ports detail, and license status.
To view the System Info, navigate to Configuration > expand System Maintenance > Diagnostics and select System Info.
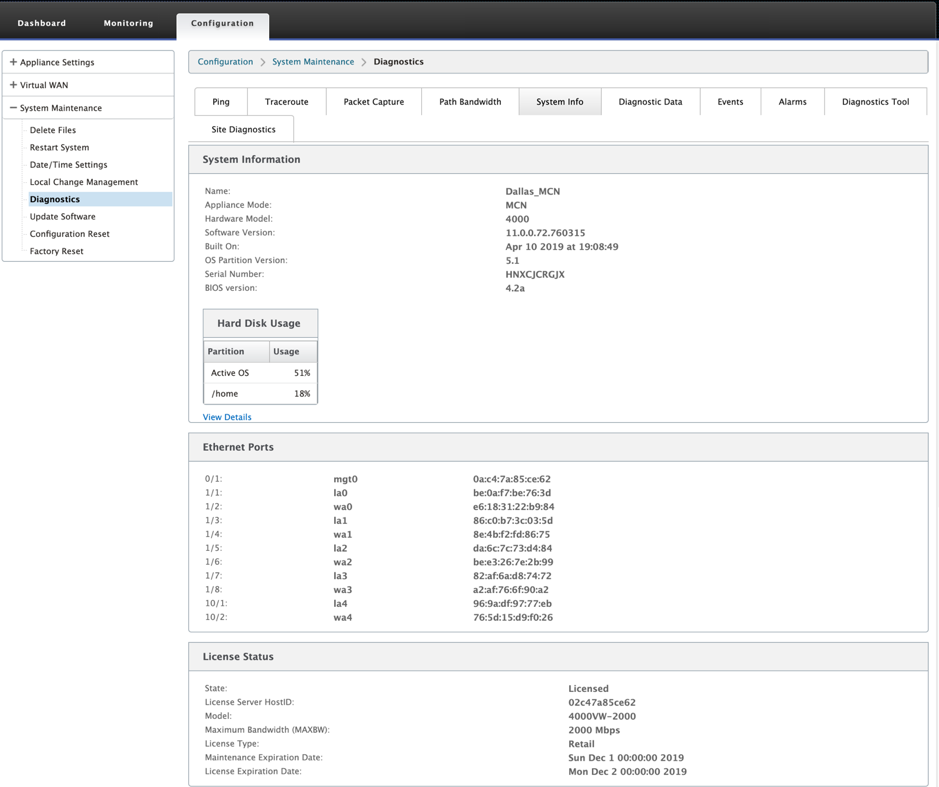
The System Info lists all the parameters that are not set to their defaults. This information is read-only. It is used by Support when some kind of misconfiguration is suspected. When you report a problem, you might be asked to check one or more values on this page.
Diagnostic data
Diagnostic Data allows you to generate a diagnostic data package for analysis by the Citrix Support team. You can download the Diagnostics Log Files package and share it with the Citrix Support team.
To view the Diagnostic Data, navigate to Configuration > expand System Maintenance > Diagnostics and select Diagnostic Data.
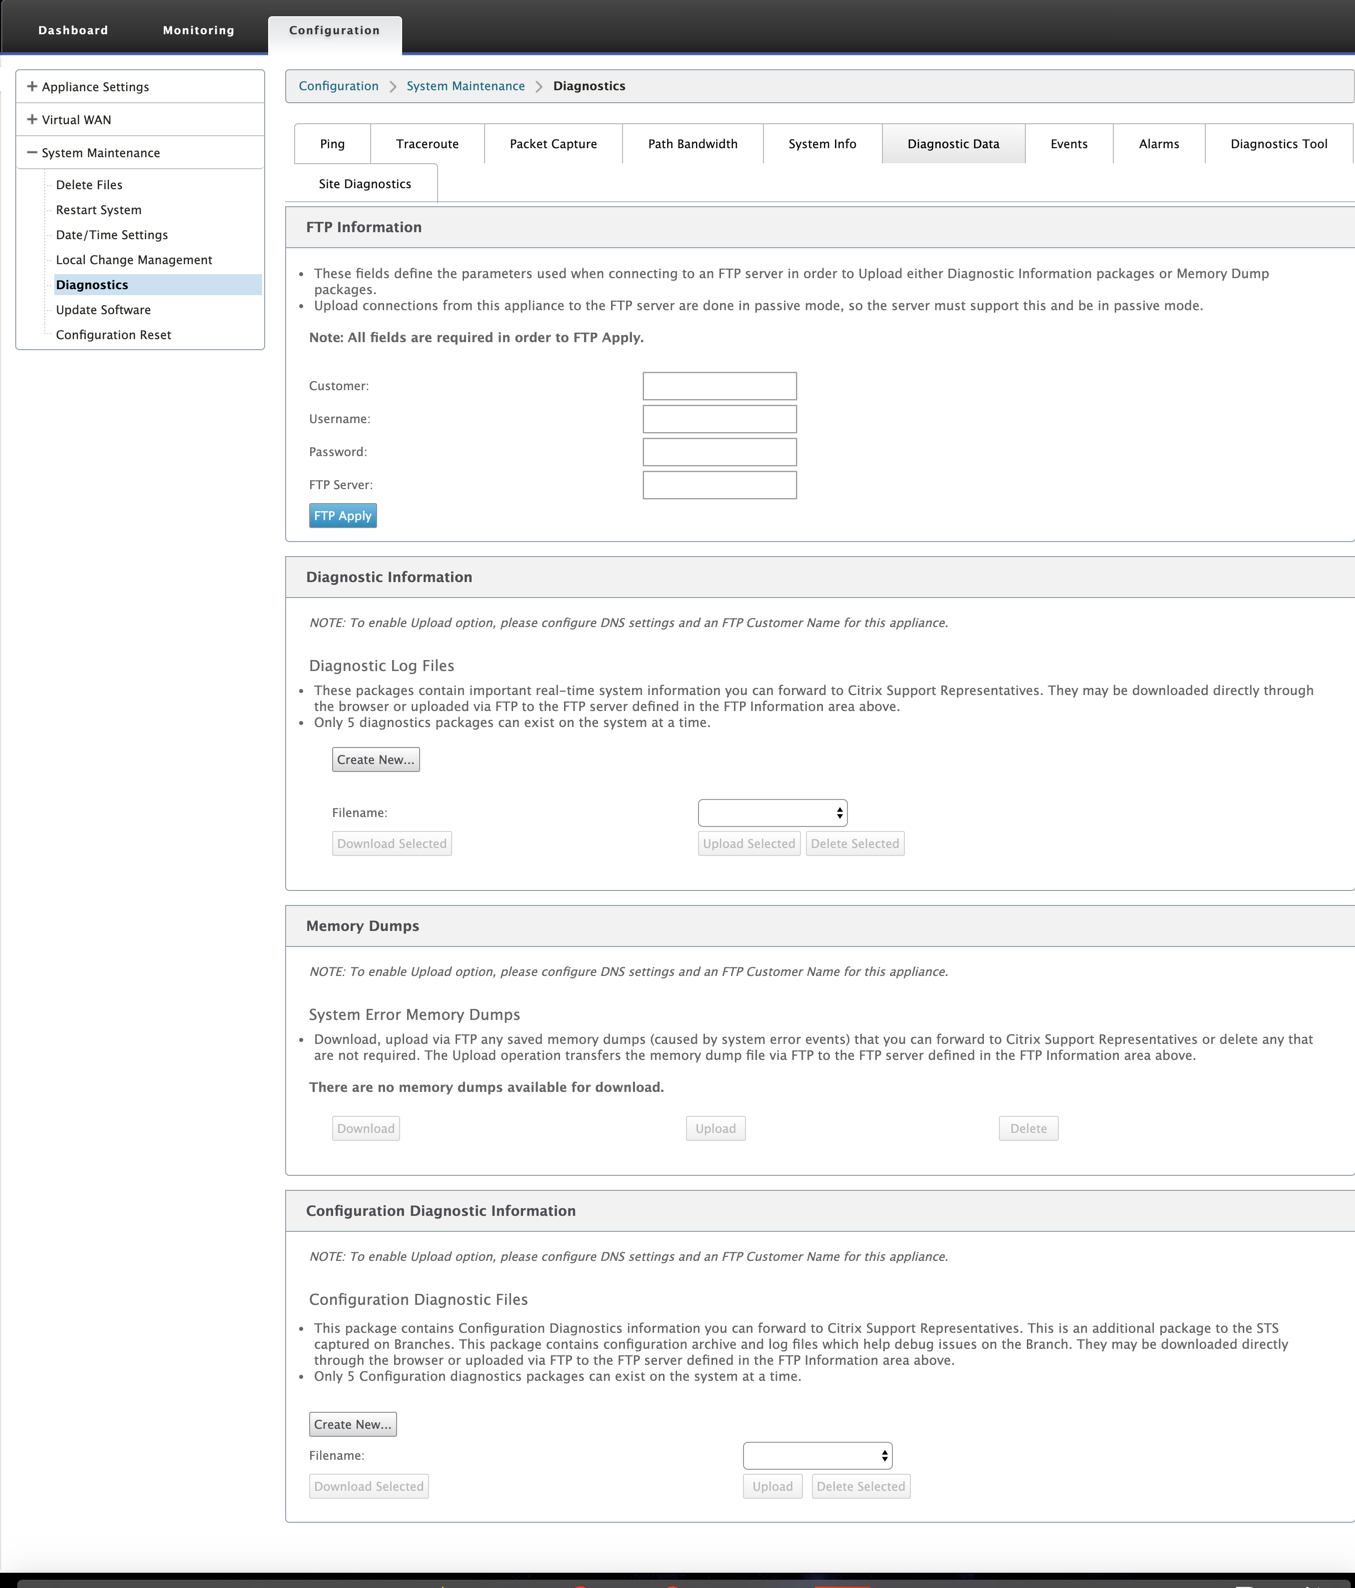
The Diagnostics Data includes:
- FTP Information – Provide the FTP parameters detail and click FTP Apply. The FTP information required to connect an FTP server to upload diagnostic information package.
-
Diagnostics Information – The diagnostics log file package contains real-time system information that can be downloaded through the browser or uploaded via FTP to the FTP server.
Note:
Only five diagnostics packages can exist on the system at a time.
-
Configuration Diagnostic Information - In the Citrix SD-WAN 11.0 release, the Network configuration file will not be available in the Diagnostic information collected for branch. For any support case, provide the diagnostic information of branch and Configuration diagnostic information from the control node the branch is connected to.
To collect configuration diagnostic information from the Control Node GUI, navigate to Configuration > System Maintenance > Diagnostics > Diagnostic Data > under Configuration Diagnostic Information, click Create New.
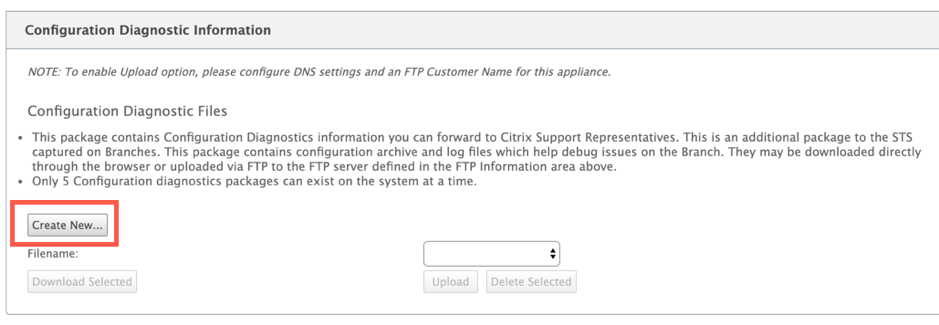
On completion of the Configuration Diagnostic Information creation, click Download Selected file and provide this file to Citrix Support OR use the FTP apply operation available in the same page to FTP this file.
-
Memory Dumps – You can download or upload the system error memory dumps file and share with the Citrix Support team. You can also delete the files if not required.
NOTE:
By default the Upload option is in disabled mode. To enable it, configure DNS settings and an FTP Customer Name for this appliance.
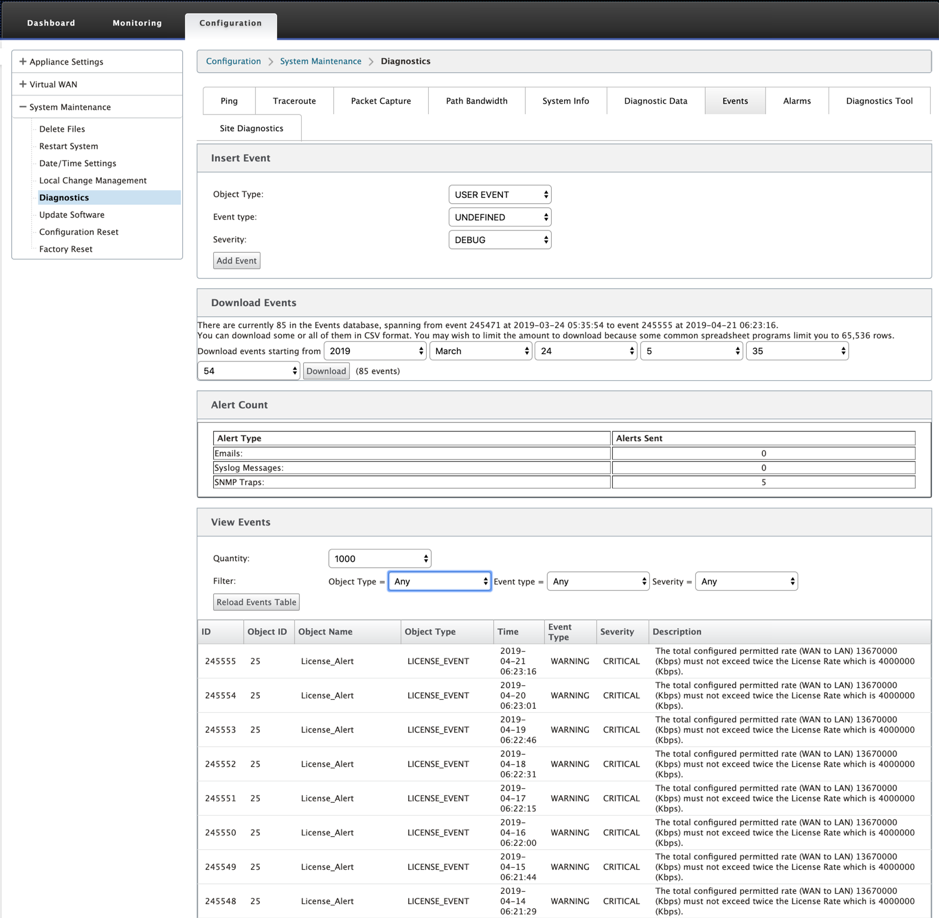
Events
Use the Events feature to add, monitor, and manage the events generated. It helps to identify events in real-time, that helps you address issues immediately and keep the Citrix SD-WAN appliance running effectively. You can download events in CSV format.
To add an event, select object type, event type, and severity from the drop-down list and click Add Event.
To view Events, navigate to Configuration > expand System Maintenance > Diagnostics and select Events.
You can configure Citrix SD-WAN to send event notifications for different event types as Emails, SNMP Traps, or Syslog Messages.
Once the email, SNMP, and syslog notification settings are configured, you can select the severity for different event types and select the mode (email, SNMP, syslog) to send event notifications.
Notifications are generated for events equal to or above the specified severity level for the event type.
You can view the events detail under View Events table. The event details include the following information.
- ID – Event ID.
- Object ID - The ID of the object generating the event.
- Object Name - The name of the object generating the event.
- Object Type – The type of the object generating the event.
- Time – The time the event was generated.
- Event Type – The state of the object at the time of the event.
- Severity – The severity level of the event.
- Description – A text description of the event.
Alarms
You can view and clear the triggered alarm. To view Alarms, navigate to Configuration > expand System Maintenance > Diagnostics and select Alarms.
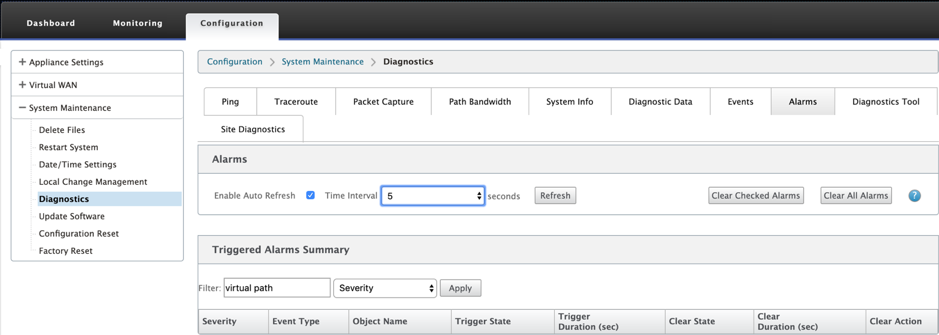
Select the alarms that you want to clear and click Clear Checked Alarms or click Clear All Alarms to clear all the alarms.
You can view the following summary of all the triggered alarms:
- Severity – The severity is displayed in the alerts sent when the alarm is triggered or cleared and in the triggered alarm summary.
- Event Type – The SD-WAN appliance can trigger alarms for particular subsystems or objects in the network. These alarms are called event types.
- Object Name – The name of the object generating the event.
- Trigger State – The event state that triggers an alarm for an Event Type.
- Trigger Duration (sec) – The duration in seconds determines how quickly the appliance triggers an alarm.
- Clear State – The event state that clears an alarm for an Event Type after the alarm is triggered.
- Clear Duration (sec) – The duration in seconds determines how long to wait before clearing an alarm.
- Clear Action – The action that is taken while clearing alarms.
Diagnostics tool
The Diagnostic tool is used to generate test traffic which allows you to troubleshoot network issues that might results in:
- Frequent change in path state from Good to Bad.
- Poor application performance.
- Higher packet loss
Most often, these problems arise due to rate limiting configured on firewall and router, incorrect bandwidth settings, low link speed, priority queue set by network provider and so on. The diagnostic tool allows you to identify the root cause of such issues and troubleshoot it.
The diagnostic tool removes the dependency on third-party tools such as iPerf which has to be manually installed on the Data Center and Branch hosts. It provides more control over the type of diagnostic traffic sent, the direction in which the diagnostic traffic flows, and the path on which the diagnostic traffic flows.
The diagnostic tool allows to generate the following two types of traffic:
- Control: Generates traffic with no QOS/scheduling applied to the packets. As a result, the packets are sent over the path selected in the UI, even if the path is not the best at the time. This traffic is used to test specific paths and helps to identify ISP-related issues. You can also use this to determine the bandwidth of the selected path.
- Data: Simulates the traffic generated from the host with SD-WAN traffic processing. Since QoS/scheduling is applied to the packets, the packets are sent over the best path available then. Traffic is sent over multiple paths if load balancing is enabled. This traffic is used to troubleshoot QoS/scheduler related issues.
Note
To run a diagnostic test on a path, you have to start the test on the appliances at both ends of the path. Start the diagnostic test as a server on one appliance and as a client on the other appliance.
To use diagnostics tool:
-
On both the appliances, click Configuration > System Maintenance > Diagnostics > Diagnostics Tool.
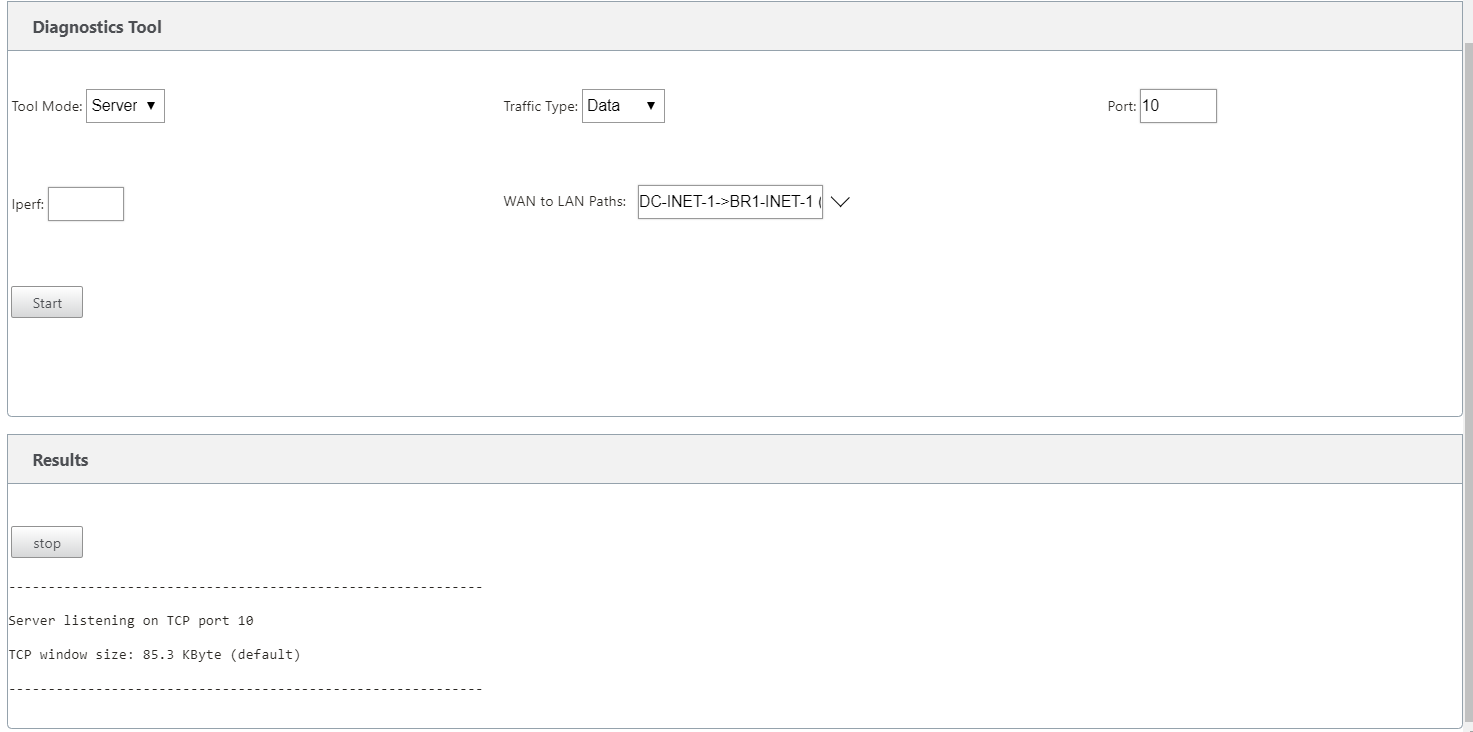
-
In the Tool Mode field, select Server on one appliance and select Client on the appliance residing on the remote end of the selected path.
-
In the Traffic Type field, select the type of diagnostic traffic, either Control or Data. Select the same traffic type on both the appliances.
-
In the Port field, specify the TCP / UDP port number on which the diagnostic traffic is sent. Specify the same port number on both the appliances.
-
In the Iperf field, specify IPERF command-line options, if any.
Note
You need not specify the following IPERF command-line options:
- -c: Client mode option is added by the diagnostic tool.
- -s: Server mode option is added by the diagnostic tool.
- -B: Binding IPERF to specific IP/interface is done by the diagnostic tool depending on the path selected.
- -p: Port number is provided in the diagnostics tool.
- -i: Output interval in seconds.
- -t: Total duration of the test in seconds.
-
Select the WAN to LAN paths on which you want to send the diagnostic traffic. Select the same path on both the appliances.
-
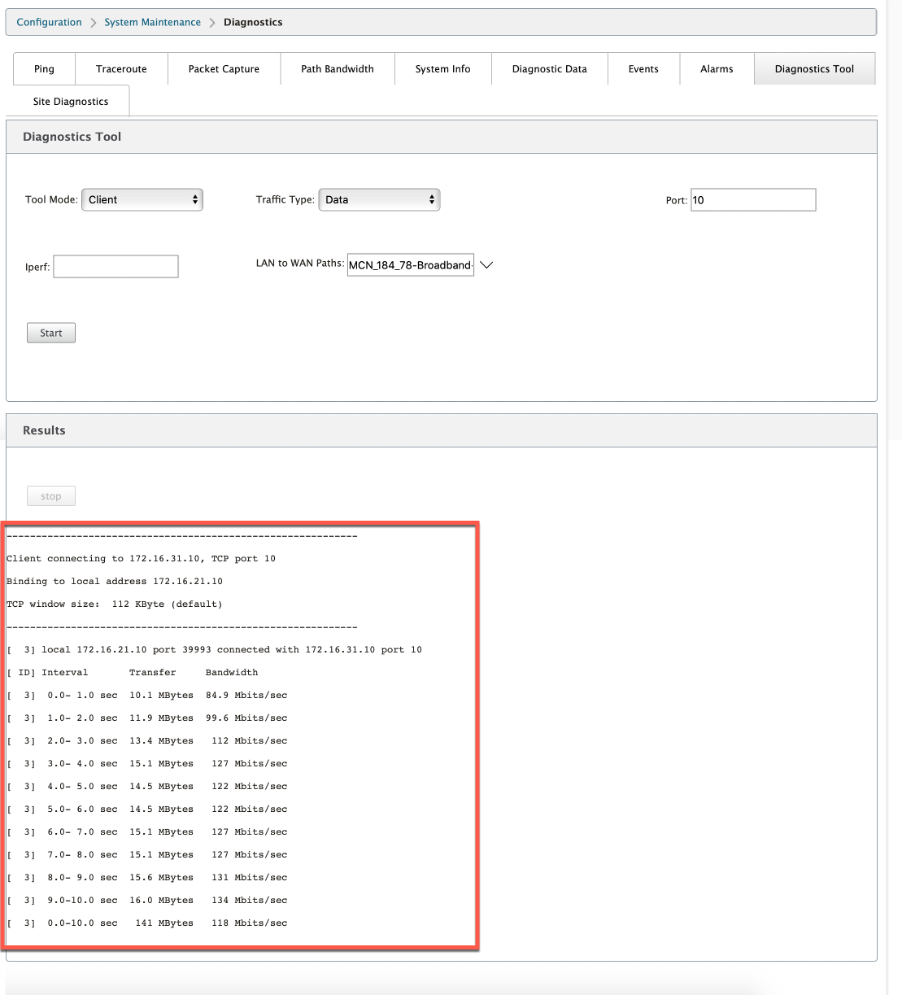
Click Start on both the appliances.
The result displays the mode (client or server) of the selected appliance and the TCP or UDP port on which the test is run. It periodically displays the data transferred and bandwidth utilized for the interval specified until the total duration of the test is reached.
Site diagnostics
You can test the bandwidth usage, ping, and perform traceroute for the WAN links configured at different sites in the Citrix SD-WAN network. It provides information which helps in troubleshooting issues in the existing configuration.
To use Site Diagnostics, navigate to Configuration > expand System Maintenance > Diagnostics and select Diagnostics Tool.
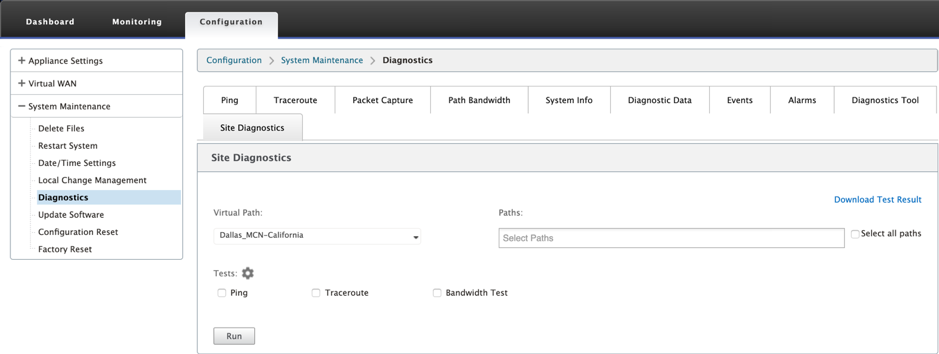
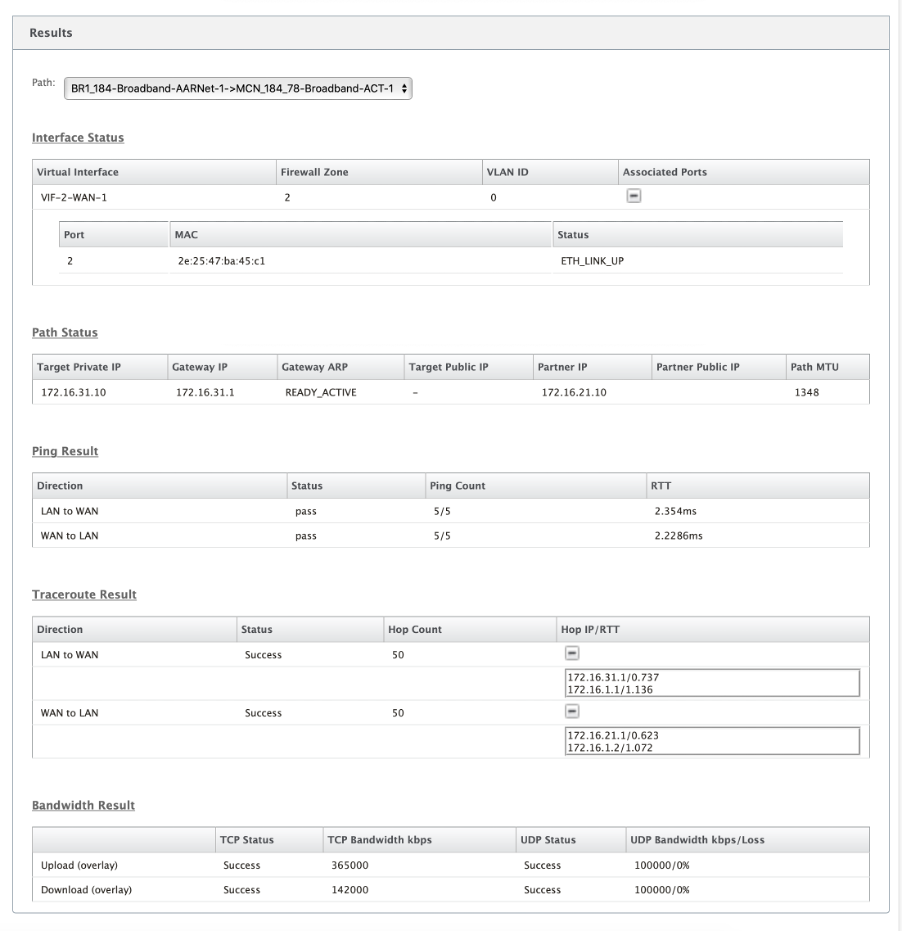
The results section displays the following:
- Interface Status: Provides the name of the interface, number of firewall zones associated with the interface, VLAN ID, and its associated ports.
- Path Status: Provides the details of target private IP, Gateway IP, Target Public IP, Partner IP, Partner Public IP addresses. It also displays the status of Gateway ARP and path MTU.
- Ping Result: Provides the direction, status, count (including the number of attempts and failures), and RTT of the ping.
- Traceroute Result: Provides the direction, status, number of hops, and IP address or RTT of the hops.
- Bandwidth Result: Provides the status of TCP and UDP along with the bandwidth used (in kbps) for the overlay and underlay network. Compared to UDP, the bandwidth used by TCP is more, because UDP is bandwidth based and therefore uses only the configured bandwidth. TCP is a ramp up protocol; based on underlying network configuration, usage might report higher bandwidth compared to configured bandwidth.