-
-
-
-
-
-
Detecting Network Connectivity Problems
-
Building a Browser Extension Inventory Report (Chrome/Edge/Firefox)
-
Internet Explorer - Distinguish Standalone and Edge IE Mode Starts
-
-
This content has been machine translated dynamically.
Dieser Inhalt ist eine maschinelle Übersetzung, die dynamisch erstellt wurde. (Haftungsausschluss)
Cet article a été traduit automatiquement de manière dynamique. (Clause de non responsabilité)
Este artículo lo ha traducido una máquina de forma dinámica. (Aviso legal)
此内容已经过机器动态翻译。 放弃
このコンテンツは動的に機械翻訳されています。免責事項
이 콘텐츠는 동적으로 기계 번역되었습니다. 책임 부인
Este texto foi traduzido automaticamente. (Aviso legal)
Questo contenuto è stato tradotto dinamicamente con traduzione automatica.(Esclusione di responsabilità))
This article has been machine translated.
Dieser Artikel wurde maschinell übersetzt. (Haftungsausschluss)
Ce article a été traduit automatiquement. (Clause de non responsabilité)
Este artículo ha sido traducido automáticamente. (Aviso legal)
この記事は機械翻訳されています.免責事項
이 기사는 기계 번역되었습니다.책임 부인
Este artigo foi traduzido automaticamente.(Aviso legal)
这篇文章已经过机器翻译.放弃
Questo articolo è stato tradotto automaticamente.(Esclusione di responsabilità))
Translation failed!
Detecting Network Connectivity Problems
Network connectivity issues severely impact application functionality and performance, yet are often difficult to diagnose. This practice guide demonstrates how uberAgent helps.
Network issues come in two flavors: permanent and intermittent. The following sections explain both in detail.
Permanent Network Connectivity Issues
Permanent issues are often caused by configuration errors. Examples:
- A server service was migrated to a new machine but the application configuration is still pointing to the old machine.
- Firewall rules are missing so application connectivity is blocked.
Intermittent Network Connectivity Issues
Intermittent issues only occur from time to time and may cause seemingly random application slowness or occasional application errors. Examples:
- Bad WiFi signal reception
- Packet loss
- Saturated internet connection
Diagnosing Network Connectivity Issues
uberAgent monitors all network traffic and enriches it with metadata like the originating application, the user account, the machine type, Active Directory OU, Citrix site, and much more. Network traffic is categorized as successful or failed connection, regular transmission or retransmit, and so on.
When suspecting network problems the dashboard to consult is Application Network Issues, located in the Applications menu.
Network Availability Indicator
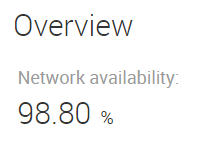
The first thing to check is the Network availability metric:

It is the ratio of successful connections and transmissions to the total number of connection and transmission attempts and should be at 100%.
Network Issues Over Time
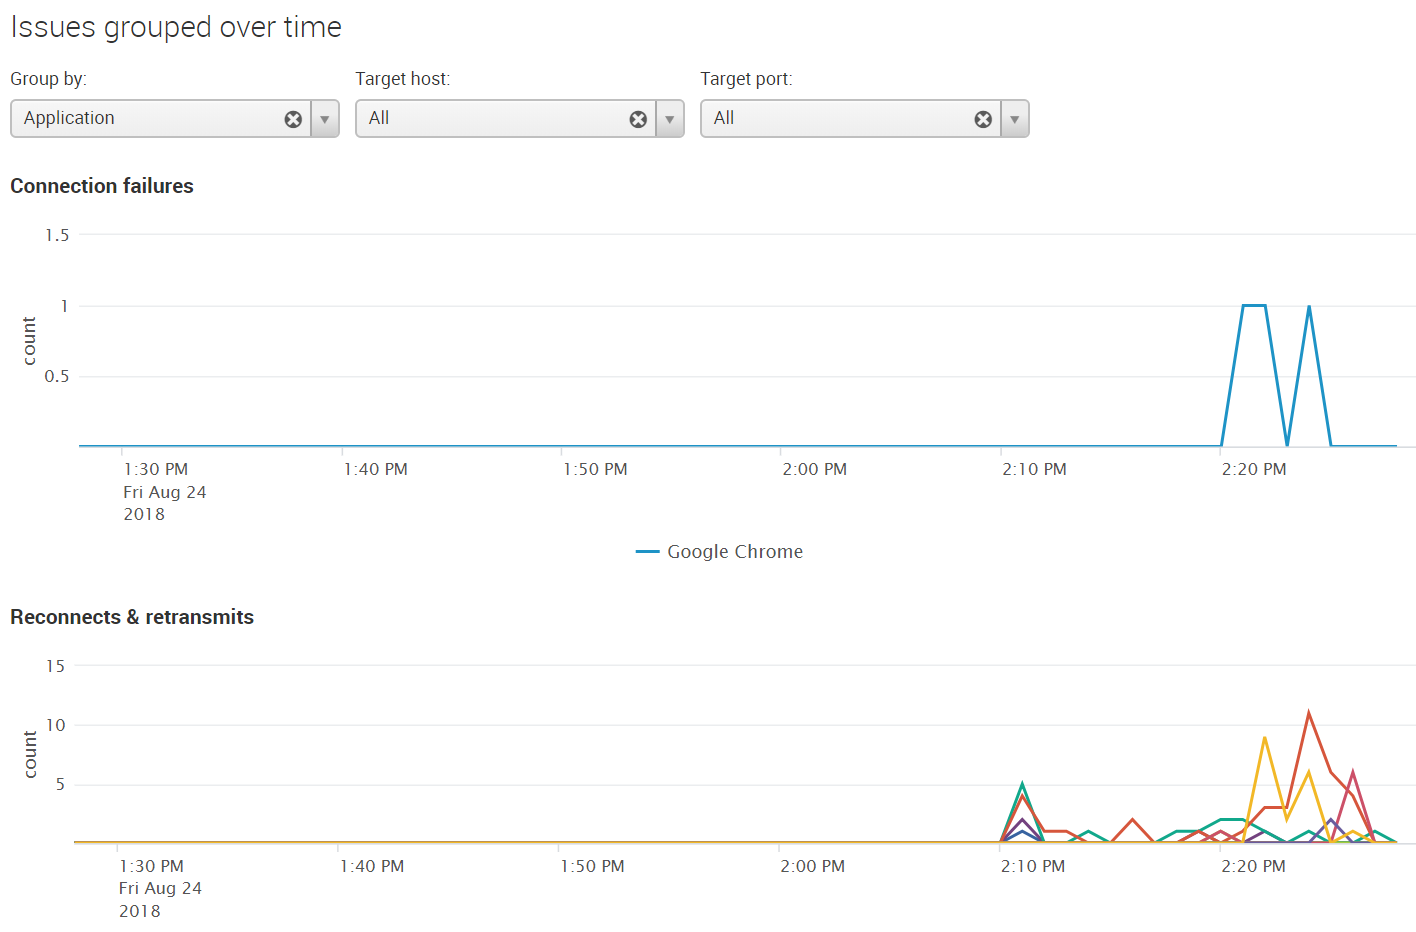
The next thing to check are the timecharts in the section Issues grouped over time:

The two graphs show connection failures and reconnects & retransmits over the selected time range. By default both graphs group errors per application, but you can switch to errors per process, per source or target host, per target port or even per user.
Network Issues per Application
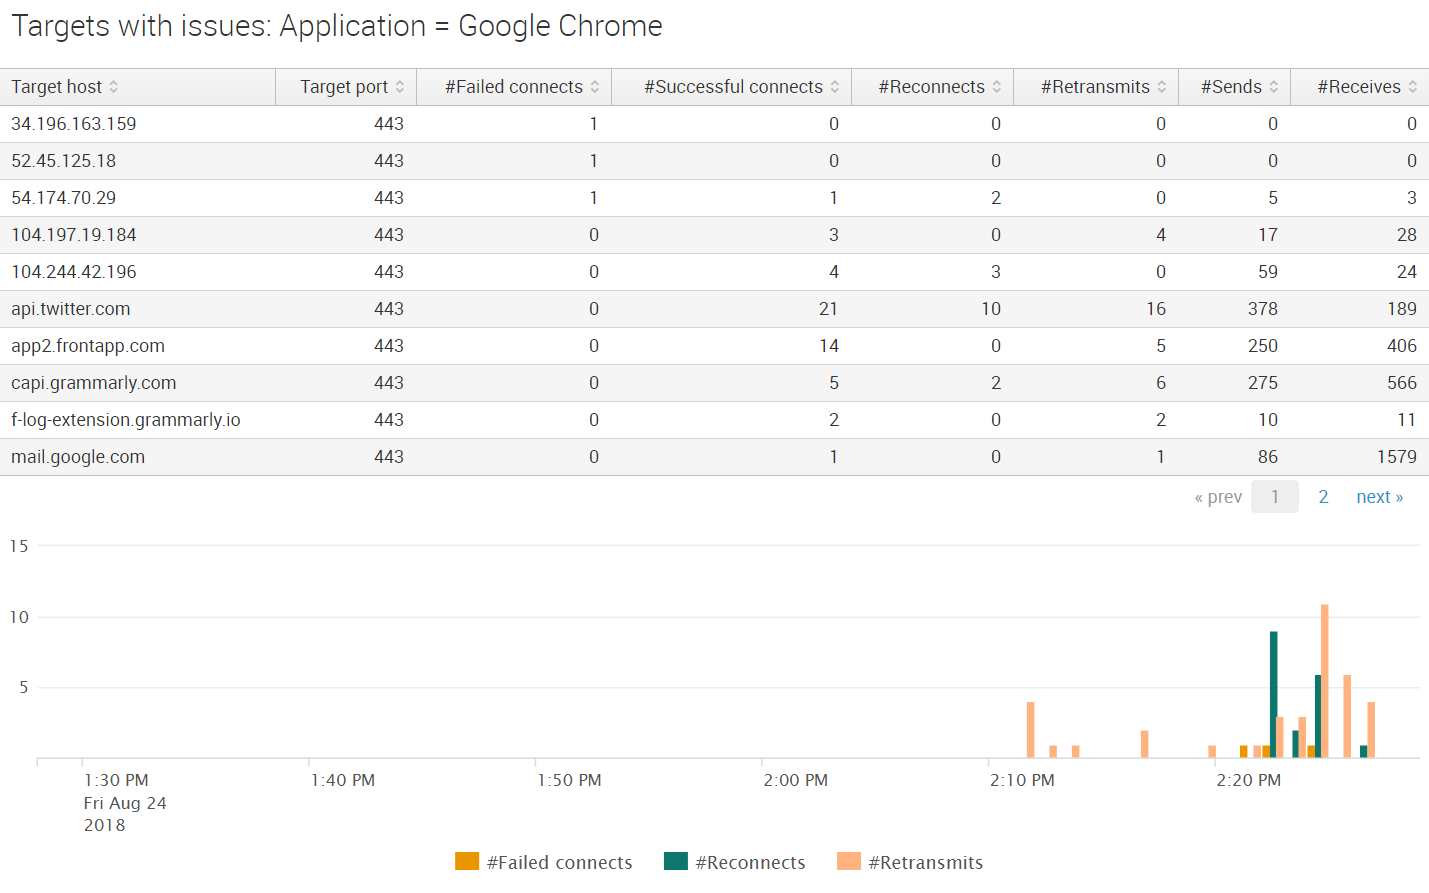
To further analyze the errors for a specific application (or host, user, etc.) click on the respective row of the table Issues grouped (top 100). This performs an in-page drilldown, bringing up an additional table and chart with details on the selected item:

In the screenshot above we can see that reconnection and retransmission errors started at around 2:10 PM for the selected application (Google Chrome). The errors are not limited to specific target hosts. This indicates intermittent problems, most likely related to unstable internet connectivity.
Share
Share
This Preview product documentation is Citrix Confidential.
You agree to hold this documentation confidential pursuant to the terms of your Citrix Beta/Tech Preview Agreement.
The development, release and timing of any features or functionality described in the Preview documentation remains at our sole discretion and are subject to change without notice or consultation.
The documentation is for informational purposes only and is not a commitment, promise or legal obligation to deliver any material, code or functionality and should not be relied upon in making Citrix product purchase decisions.
If you do not agree, select I DO NOT AGREE to exit.