Reporting
Application QoE
Application QoE is a measure of Quality of Experience of applications in the SD-WAN network. It measures the quality of applications that flow through the virtual paths between two SD-WAN appliances. The Application QoE score is a value between 0 and 10. The score range that it falls in determines the quality of an application.
| Quality | Range |
|---|---|
| Good | 8–10 |
| Fair | 4–8 |
| Poor | 0–4 |
Application QoE score can be used to measure quality of applications and identify problematic trends.
You can define the quality thresholds for real-time and interactive appliances using QoE profiles, and map these profiles to applications or applications objects.
Note
To monitor Application QoE, it is essential to enable Deep Packet Inspection. For more information, see Application classification.
Real-time application QoE
The Application QoE calculation for real-time applications uses a Citrix innovative technique, which is derived from MOS score.
The default threshold values are:
- Latency threshold: 160 ms
- Jitter Threshold: 30 ms
- Packet loss threshold: 2%
A flow of a real-time application that meets the thresholds for latency, loss, and jitter is considered to be of good quality.
QoE for Real-time applications is determined from the percentage of flows that meet the threshold divided by the total number of flow samples.
QoE for Real-time = (No of flow samples that meet the threshold / Total no of flow samples) * 100
It is represented as QoE score ranging from 0 to 10.
You can create QoE profiles with custom threshold values and apply to applications or application objects.
Note
The QoE value can be zero if the network conditions are outside of the configured thresholds for real-time traffic.
Interactive application QoE
The Application QoE for interactive applications uses a Citrix innovative technique based on packet loss and burst rate thresholds.
Interactive applications are sensitive to packet loss and throughput. Therefore, we measure the packet loss percentage, and the burst rate of ingress and egress traffic in a flow.
The configurable thresholds are:
- Packet loss percentage.
- Percentage of expected egress burst rate in comparison to the ingress burst rate.
The default threshold values are:
- Packet loss threshold: 1%
- Burst rate: 60%
A flow is of good quality if the following conditions are met:
-
The percentage loss for a flow is less that the configured threshold.
-
The egress burst rate is at least the configured percentage of ingress burst rate.
Configuring application QoE
Map application or application objects to default or custom QoE profiles. You can create custom QoE profiles for real-time and interactive traffic and map up to 10 applications or application objects with QoE profiles.
To create custom QoE profiles through Citrix SD-WAN Orchestrator service, see Application QoE profiles.
HDX QoE
Network parameters such as latency, jitter, and packet drop affect the user experience of HDX users. Quality of Experience (QoE) is introduced to help the users understand and check their ICA quality of experience. QoE is a calculated index, which indicates the ICA traffic performance. The users can tune the rules and policy to improve the QoE.
The QoE is a numeric value between 0–100, the higher the value the better the user experience. QoE is enabled by default for all ICA / HDX applications.
The parameters used to calculate QoE, are measured between the two SD-WAN appliances located at the client and server side and not measured between the client or the server appliances themselves. Latency, jitter, and packet drop are measured at the flow level and it can be different from the statistics at the link level. The end host (client or server) application might never know that there is a packet loss on the WAN. If the retransmit succeeds, the flow level packet loss rate is lower than the link level loss. However, as a result, it might increase latency and jitter a bit.
Default configuration for HDX traffic enables SD-WAN to retransmit packets, thus improves the QoE index value that was lost due to packet loss in the network.
In the HDX dashboard on Citrix SD-WAN Orchestrator, you can view a graphical representation of the overall quality of HDX applications. The HDX applications are classified into the following three quality categories:
| Quality | QoE Range |
|---|---|
| Good | 80–100 |
| Fair | 50–80 |
| Poor | 0–50 |
A list of the bottom five sites with the least QoE is also displayed in the HDX dashboard.
A graphical representation of the QoE for different time intervals allows you to monitor the performance of HDX applications at each site.
For more information on how to configure HDX QoE using Citrix SD-WAN Orchestrator service, see HDX dashboard and reports.
Note
- Do not expect the WAN link latency, jitter, and packet drop would always match application latency, jitter, and packet drop. WAN Link loss correlates to the actual WAN packet loss, while application loss is after retransmit, which is lower than WAN link loss.
- WAN Link latency displayed in the GUI is BOWT (Best One Way Time). It is the best metrics of the link as a means to gauge the health of the link. The application QoE tracks and calculates the total and average latency of all the packets for that application. This often does not match the link BOWT.
- When an MSI session starts, during ICA handshake, the session might be temporarily counted as 4 SSI instead of 1 MSI. After the handshake is complete, it will converge to 1 MSI. If the conversion happens before the SQL table is updated, it might show up in ICA_Summary for that minute.
- On session reconnect, since initial protocol information is not exchanged, SD-WAN is not able to identify MSI, hence each connection is counted as SSI information.
- For UDP connections, after the connection is closed, it can take up to 5 minutes for the connection to show as closed and updated in ICA_Summary. For TCP connections, after the connection is closed, it can take up to 2 minutes to show as closed in ICA_Summary.
- QoE of TCP sessions and UDP sessions might not be the same on the same path due to the inherent different between TCP and UDP.
- If one user launches two virtual desktops, the number of users is countered as two.
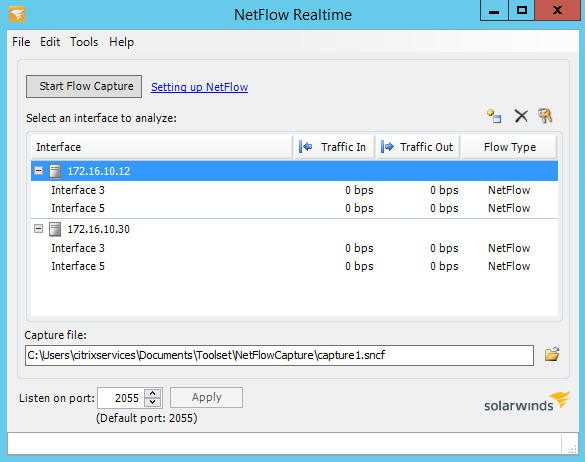
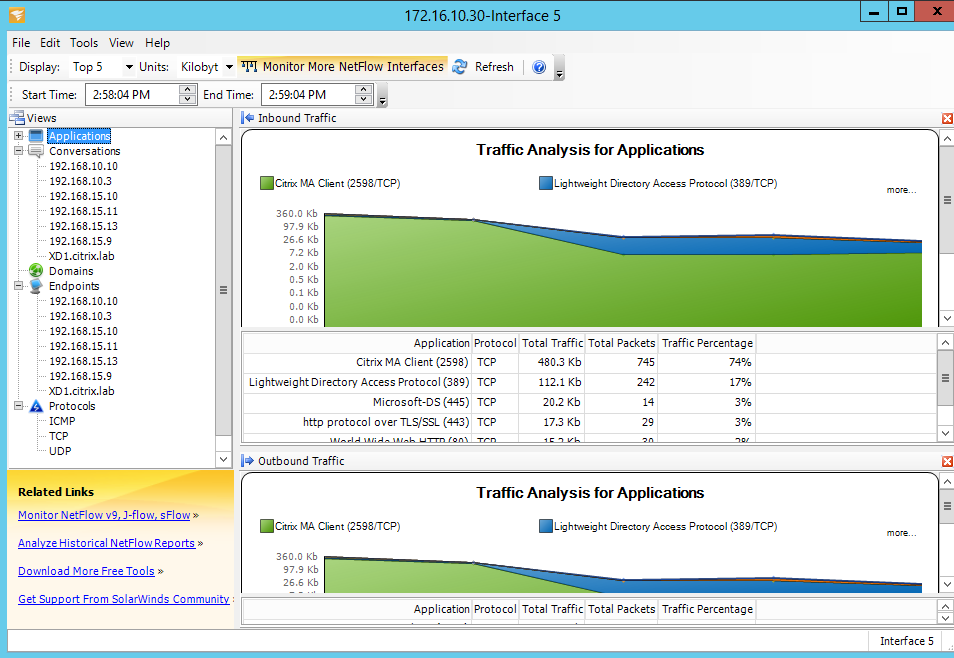
Multiple Net Flow Collectors
Net Flow Collectors collect IP network traffic as it enters or exits an SD-WAN interface. By analyzing the data provided by Net Flow, you can determine the source and destination of traffic, class of service, and the causes for traffic congestion. Citrix SD-WAN devices can be configured to send basic Net Flow version 5 statistical data to the configured Net Flow collector. Citrix SD-WAN provides Net Flow support for traffic flows that are obscured by the transport reliable protocol. Devices on the WAN edge of the solution lose capability to collect Net Flow records since only the SD-WAN encapsulated UDP packets are displayed. Net Flow is supported on the Citrix SD-WAN Standard Edition appliances.
For information on how to configure Net Flow Hosts using Citrix SD-WAN Orchestrator service, see Netflow host settings.
NetFlow Export
Net Flow data is exported from the SD-WAN device management port. On your Net Flow collector tool, the SD-WAN devices are listed as the configured management IP address, if SNMP is not configured. The interfaces are listed as one for incoming and a second for outgoing (Virtual Path traffic). For more information, see SNMP.
NetFlow Limitations
-
With Netflow enabled on SD-WAN Standard Edition appliances, Virtual Path data is streamed to the designated Netflow collectors. One limitation with this is that one cannot differentiate which physical WAN link is being used by SD-WAN, as the solution reports aggregated Virtual Path information (A Virtual Path may comprise of multiple distinct WAN Paths), there is no way to filter the Netflow records for the distinct WAN paths.
-
TCP control Bits report as N/A which indicates SD-WAN does not follow the internet standard for Netflow exports based on RFC 7011 which has element ID 6 for tcpControlBits (IANA). Without TCP Flags, calculating round trip time (RTT), latency, jitter, and other performance metrics in the flow data is not possible. From the security side, without TCP flags, the Net Flow collector cannot determine if there are FIN, ACK/RST, or SYN scans occurring.
Route statistics
To view route statistics of your SD-WAN appliances, in the SD-WAN GUI navigate to Monitoring > Statistics > Routes.
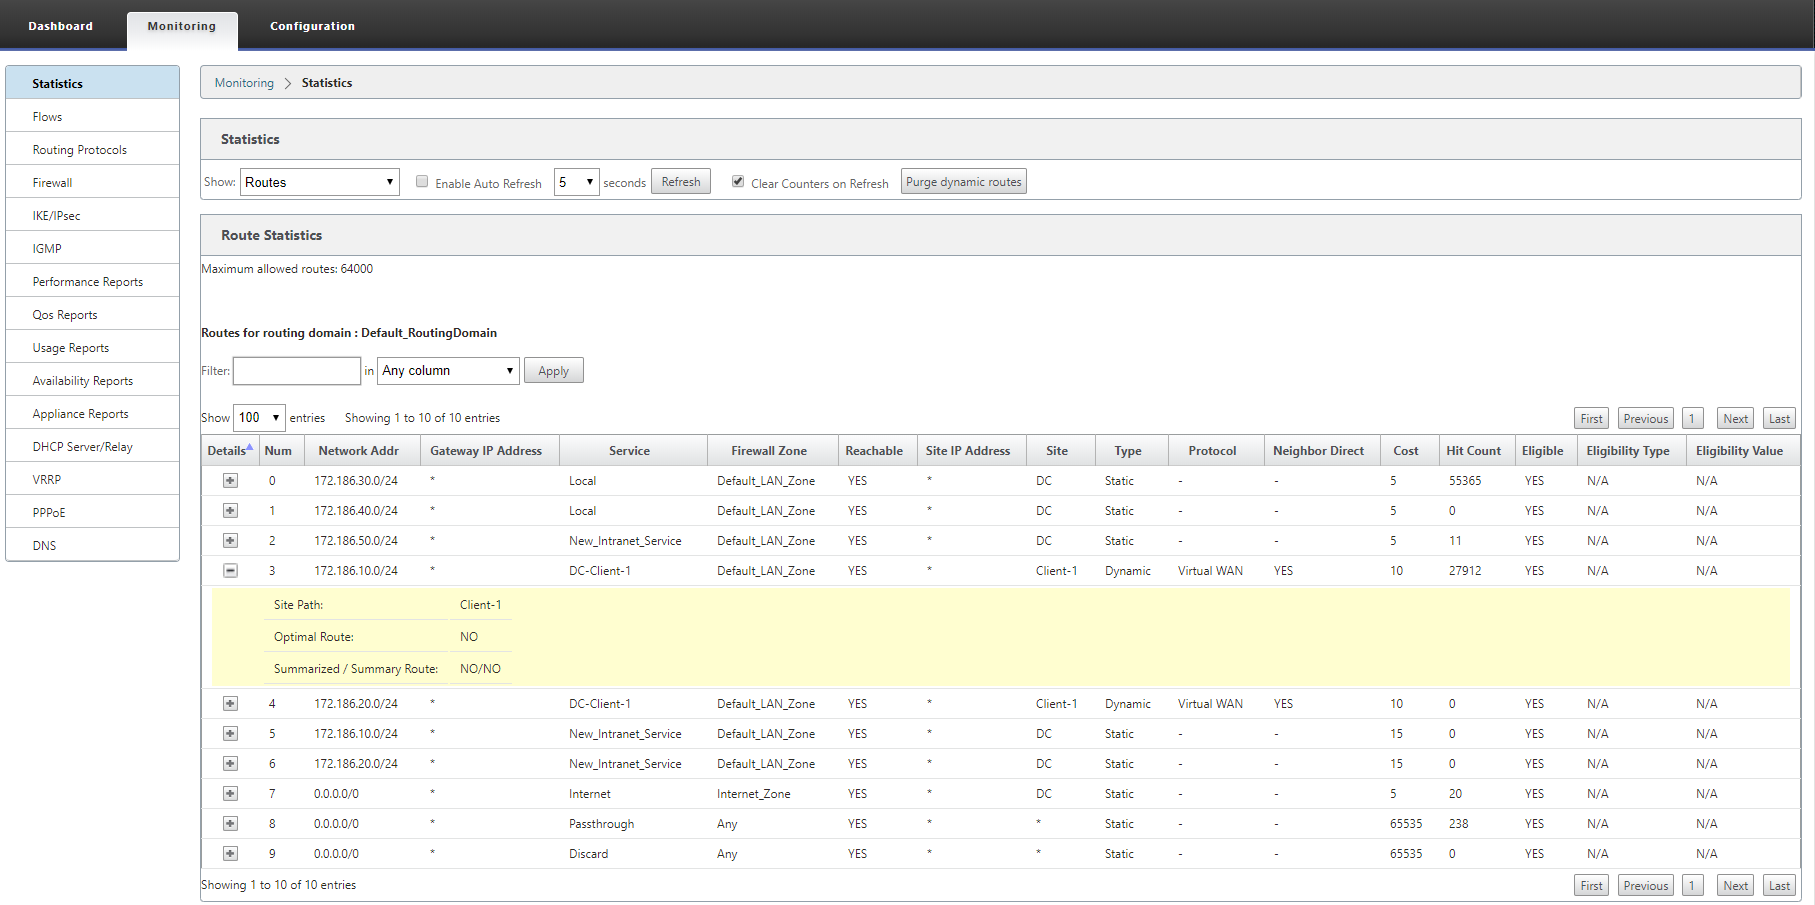
You can view the following parameters:
- Network Address: The Network address and subnet mask of the route.
-
Details: Click + to display the following information.
-
Site Path: Site Path is a source of truth metric for the received prefix. It is used in situations where WAN to WAN forwarding is enabled on multiple devices and in mesh deployment. Multiple such prefixes are received and the administrators are able to judge the prefix attributes by viewing the site path.
For example, consider a simple topology of Branch1, Branch2, and MCN along with a Geo MCN. Branch1 has a prefix 172.16.1.0/24 and has to get to Branch2. Geo MCN and MCN have WAN to WAN forwarding enabled.
The prefix 172.16.1.0/24 can get to Branch2 via Branch1-MCN-Branch2, Branch1-Geo-Branch2, and Branch1-MCN-Geo-Branch2. For each of these distinct prefixes the routing table is updated with their site path metric. The site path metric indicates the origin of the route prefix and the cost involved to get to Branch2.
-
Optimal Route: Optimal route indicates whether the route is the optimal route to reach that subnet compared to all other routes. This optimal route is exported to other sites.
-
Summarized/ Summary Route: A summary route is a route configured explicitly by an administrator to summarize multiple prefixes that fall in the supernet. Summarized routes are the prefixes that fall under the summary route.
For example, assume that we have a summary route 172.16.0.0/16. This is a summary route only and not a summarized route. A summary route has Summary ‘YES’ and Summarized ‘NO’. If there are few other subnets like 172.16.1.0/24, 172.16.2.0/24 and 172.16.3.0/24, these three routes fall under the summary route or the supernet and hence are called summarized routes. A summarized route has Summarized ‘YES’ and Summary ‘NO’.
-
- Gateway IP Address: The IP address of the gateway/route used to reach this route.
-
Service: The type of Citrix SD-WAN service.
- Firewall Zone: The firewall zone used by the route.
- Reachable: Is the route reachable or not.
- Site IP Address: The IP address of the site.
- Site: The name of the site.
-
Type: Type of a route depends upon the source of the route learning. The routes on the LAN side and routes entered manually during configuration are Static routes. Routes learned from the SD-WAN or dynamic routing peers are Dynamic routes.
-
Protocol: The protocol of the prefixes.
- Local: Local virtual IPs of the appliance.
- Virtual WAN: Prefixes learned from peer SD-WAN appliances.
- OSPF: Prefixes learned from OSPF dynamic routing peer.
- BGP: Prefixes learned from BGP dynamic routing peer.
-
Neighbor Direct: Indicates whether the subnet is connected to the branch from which the route came to the appliance.
-
Cost: The cost used to determine the best path to a destination network.
-
Hit Count: The number of times a route was hit to forward a packet to that subnet.
-
Eligible: Indicates that the route is eligible and is used for forwarding or routing the packets to the prefix hit during traffic processing.
-
Eligibility Type: The following two eligibility types are available.
- Gateway eligibility: Determines if the gateway is reachable or not.
- Path eligibility: Determines if the path is DEAD or NOT DEAD.
- Eligibility Value: The value selected for the gateway or the path in the configuration while the route is created in the system. For instance a route can be called eligible based on a path MCN-WL-1->BR1-WL-2. So the eligibility value for this route in the routes section is the value MCN-WL-1->BR1-WL-2.