Access assurance dashboard
With an increase in remote working, as a Citrix IT administrator, you might want to get an assurance that your users are accessing Citrix Virtual Apps and Desktops or Citrix DaaS (formerly Citrix Virtual Apps and Desktops service) from their usual and safe locations. If any users have logged on from unknown locations or new locations, you can validate their logon details and take necessary actions to mitigate any threats to your Citrix IT environment.
The Access Assurance dashboard provides an overview of the locations and networks from where your users are accessing virtual apps or virtual desktops. Citrix Analytics for Security receives these user logon events from Citrix Workspace app installed on the users’ devices. For more details on supported versions, refer Citrix Workspace app version matrix.
View the dashboard
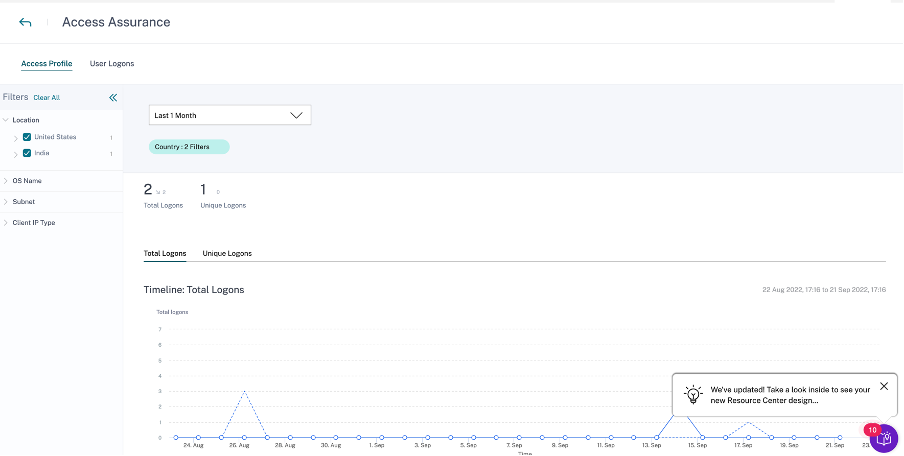
To view the dashboard, click Security > Access Assurance. Select the time period for which you want to view the logon details.

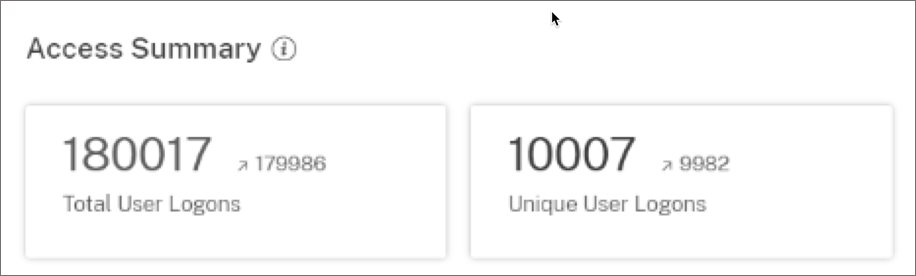
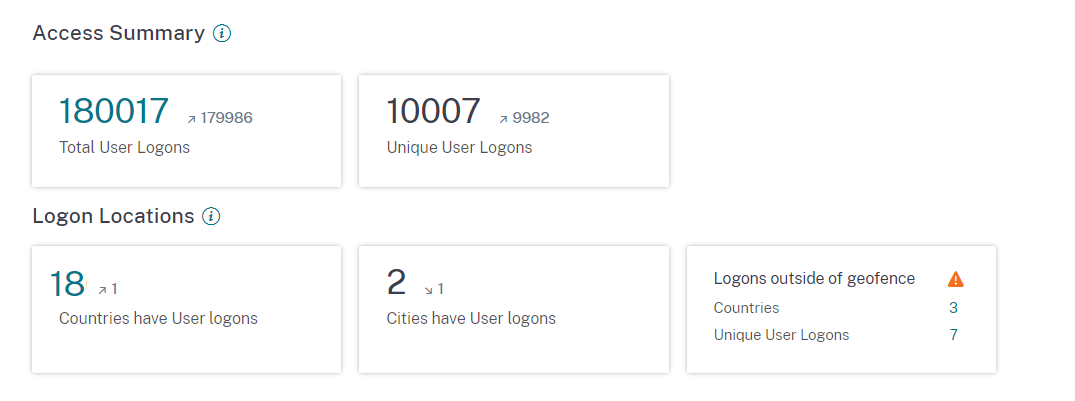
Access summary
The summary section of the dashboard provides the following information for a selected period:
-
Total number of user logons across the locations (worldwide).
-
Total number of unique user logons across the locations (worldwide).
Logon location
The Logon Locations section provides the following information for a selected period:
-
Total number of countries from where the users have logged on.
-
Total number of cities from where the users have logged on.
-
Total number of countries and the unique user logons in the geofencing areas. To view the logon details from the geofencing areas, enable geofencing.
-
Top 10 locations with unique user logons. Sometimes the top unique user logons are also from unknown cities and countries and these are listed under the Unknown Locations tab. The list of unknown locations is also a subset of the top 10 locations. To find the reasons why some locations are unidentified, see Locations identified as not available.
You can also view the upward or downward trend of the total user logons worldwide and the total unique user logons worldwide. For the top 10 locations, the DEVIATION column shows the change (positive (+) or negative (-)) in the user logons for each location. This comparison is based on the selected time period and the previous time period of equal length. For example, if you select the time period Last 1 Month, the user logon trend and the deviation are compared between the last 1 month and the previous to last 1 month.
Note
The location information is provided at the city and the country level and does not represent a precise geolocation. For more details on Access assurance, Geolocation, refer FAQ.
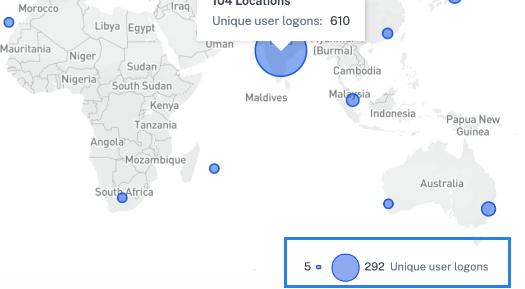
On the Top 10 Unique Logon Locations table, select a location to view the users and their access profiles and logon details.
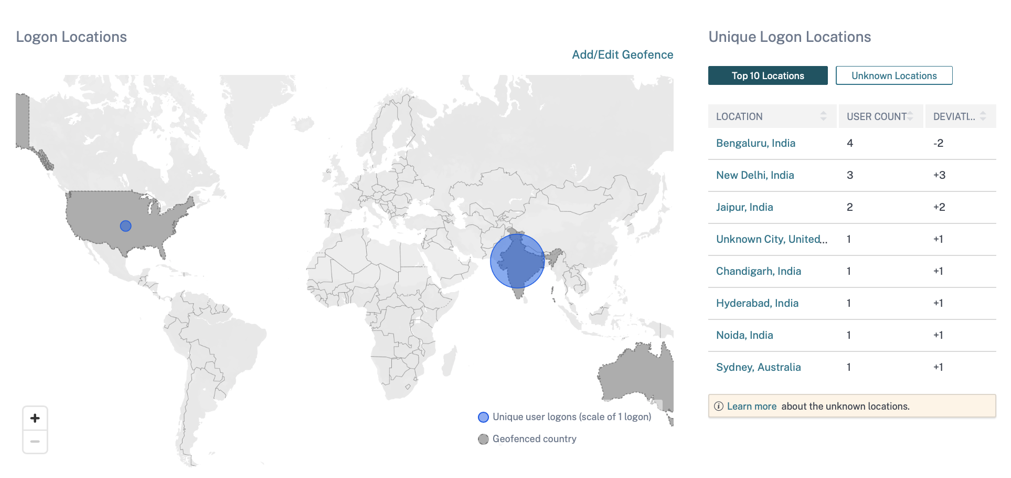
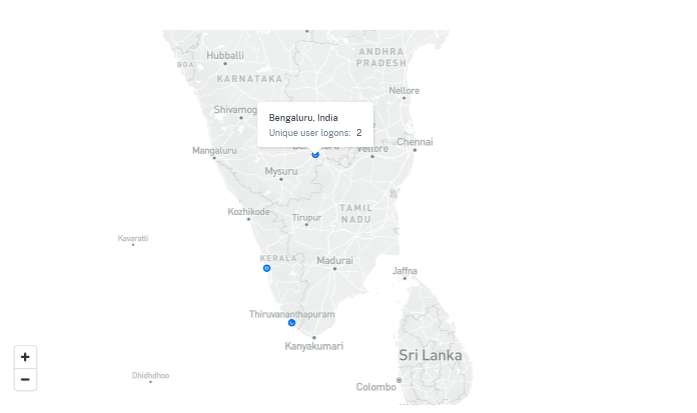
The map displays the number of unique users from various locations for a selected period. Hover over the blue bubble or zoom in to a location to view the total number of unique user logons from the location. Click the blue bubble to view the access details for a location.
On the bottom right corner of the map, you can view the range of the unique user logons. For a selected period, the small bubble indicates the minimum number of the unique user logons across the locations. The large bubble indicates the maximum number of the unique user logons across the locations.
Locations identified as not available
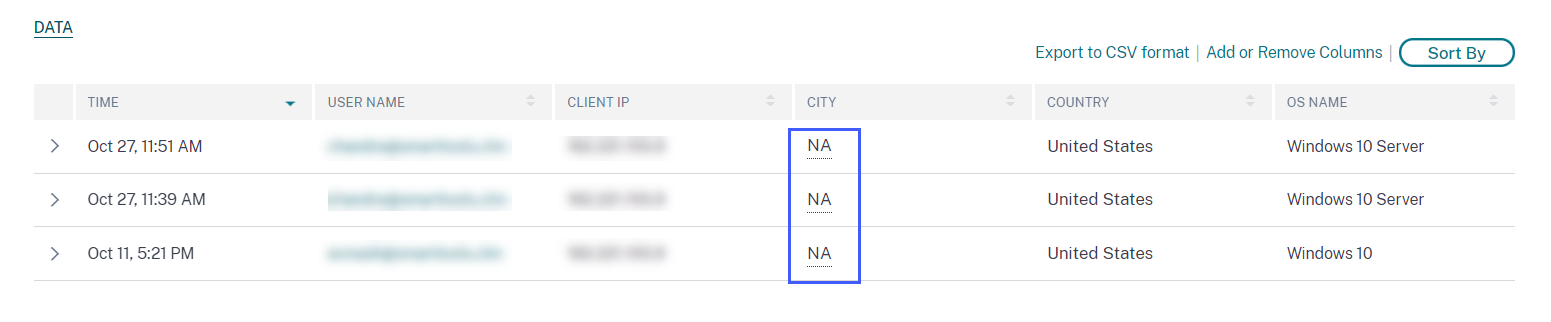
On the Top 10 Unique Logon Locations table, you might see that some locations are unknown or unavailable. Click an unknown location to view the corresponding user logon details on the User Logons page.
On the User Logons page, the DATA table displays the NA label if any country or city information is unavailable.
Hover over the NA label to view the reason why the location information is unavailable.
You might see one of the following scenarios for the unavailability of a location:
| Scenario | Reasons |
|---|---|
| The city name and the country name are not available. | One of the following |
|
|
| Locations with private IPs | The user’s device is within a private network. In this case, the location information is unavailable to Citrix Analytics. |
| The country name is available but the city name is not available. | The user’s device might be using a corporate IP. The corporate IP ranges are obfuscated in the external geo-location service. Therefore, the location information is unavailable to Citrix Analytics. |
Enable geofencing
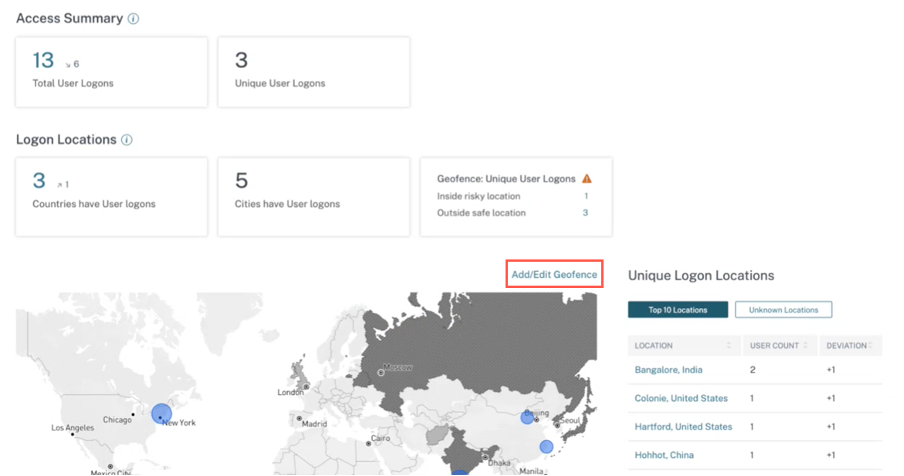
Geofencing helps you to identify the users who access virtual apps or virtual desktops from outside safe geofence and inside risky geofence areas. To view the Access Summary page, navigate to Security > Access Assurance.
By default, the Geofence Settings is always turned on. To configure your geofence, click Add/Edit Geofence.
The Geofence Settings window appears with two tabs:
- Safe locations: You can configure or remove the countries that fall under safe location.
- Risky locations: You can configure or remove the countries that fall under risky location. You can also view the total number of safe and risky locations configured on each tab. To delete or remove a country from a Safe location geofence or Risk location geofence, click the close (X) sign next to the country. Click Save to save the Geofence settings.
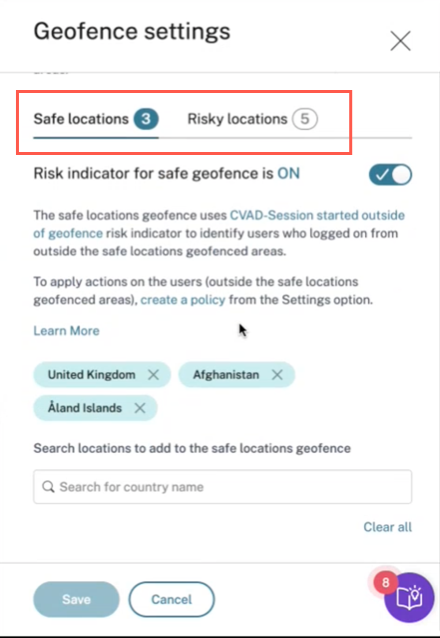
You can configure the countries that fall under Risky locations geofence. If there are no risk indicators added for Risky Locations geofence or the risk indicators are deleted, you can see a Update geofence warning message next to Add/Edit Geofence.
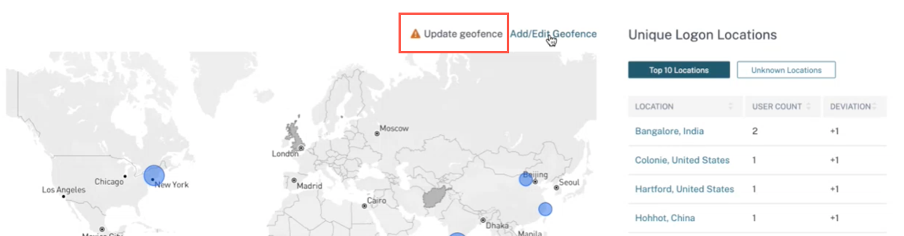
To recreate the indicator, navigate to Risky locations tab and turn on the Risk indicator for risky geofence toggle.
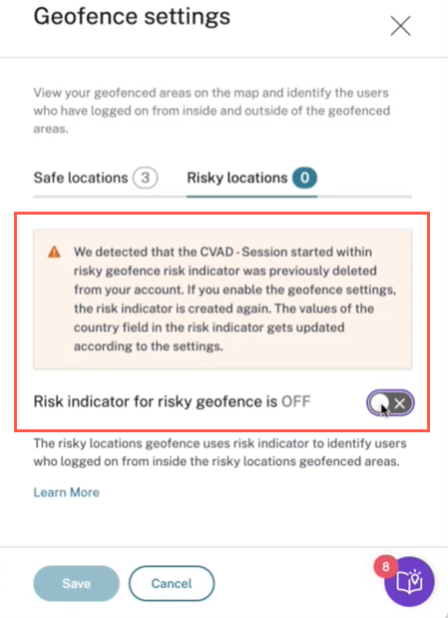
The indicator is created with the default list of risky locations.
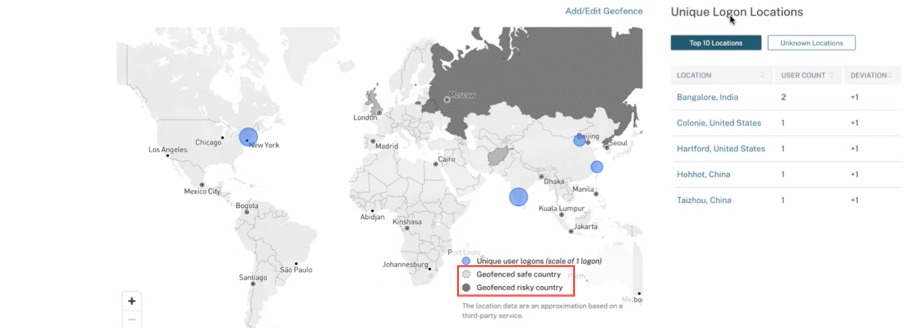
The Access Summary page also displays the Geofenced safe and risky countries.
- Geofenced Safe countries are marked with the light gray circle.
- Geofenced Risky countries are marked with the dark gray circle.
Geofence: Unique User Logons
Navigate to Access Summary page to view Geofence: Unique User Logons. The card shows the number of Inside risky locations and Outside safe locations.
- Inside risky location: Identify users who logged on from inside the risky locations geofenced areas.
- Outside safe location Identify users who logged on from outside the safe locations geofenced areas.
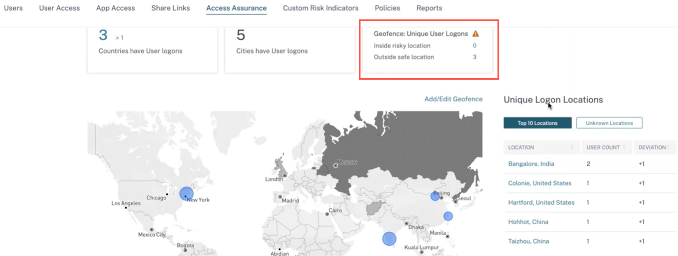
For a detailed summary of the total and the unique user logons, click the number next to Inside risky location or Outside safe location.
This feature uses the following preconfigure custom risk indicator:
- CVAD-Session started outside of geofence: To monitor user logons outside safe geofence.
- CVAD-Session started inside risky geofence: To monitor user logons inside the risky geofence.
If any user logons are detected outside the geofence, the risk indicator is triggered and the Session started outside of geofence policy is applied on those users. The policy triggers the Request End User Response action and based on the user’s response, you can take appropriate action to prevent threats from any suspicious logons. For more information, see preconfigured custom risk indicators.
Notes
In the Geofence Settings, when you modify the countries, the CVAD-Session started outside of geofence risk indicator also gets updated.
For example, if you select and save the countries Australia and India as the new geofenced countries, the preconfigured condition of the risk indicator gets updated with the new countries, in addition to the United States (which is the default geofence). You can also remove the default geofenced country United States.
Preconfigured condition of the risk indicator:
Event-Type = \"Session.logon\" AND Country != \"\" AND Country ~ \"\" AND Country != \"United States\"After updating the Geofenced Settings, the condition of the risk indicator:
Event-Type = \"Session.logon\" AND Country != \"\" AND Country ~ \"\" AND Country NOT IN (\"Australia\", \"United States\", \"India\"If the CVAD-Session started outside of geofence risk indicator is previously deleted from your account, enabling the Geofence Settings creates the risk indicator again. The geofenced countries of the risk indicator are controlled from the Geofence Settings.
After enabling the Geofence Settings, the map displays the geofenced areas and the unique user logons from these areas.
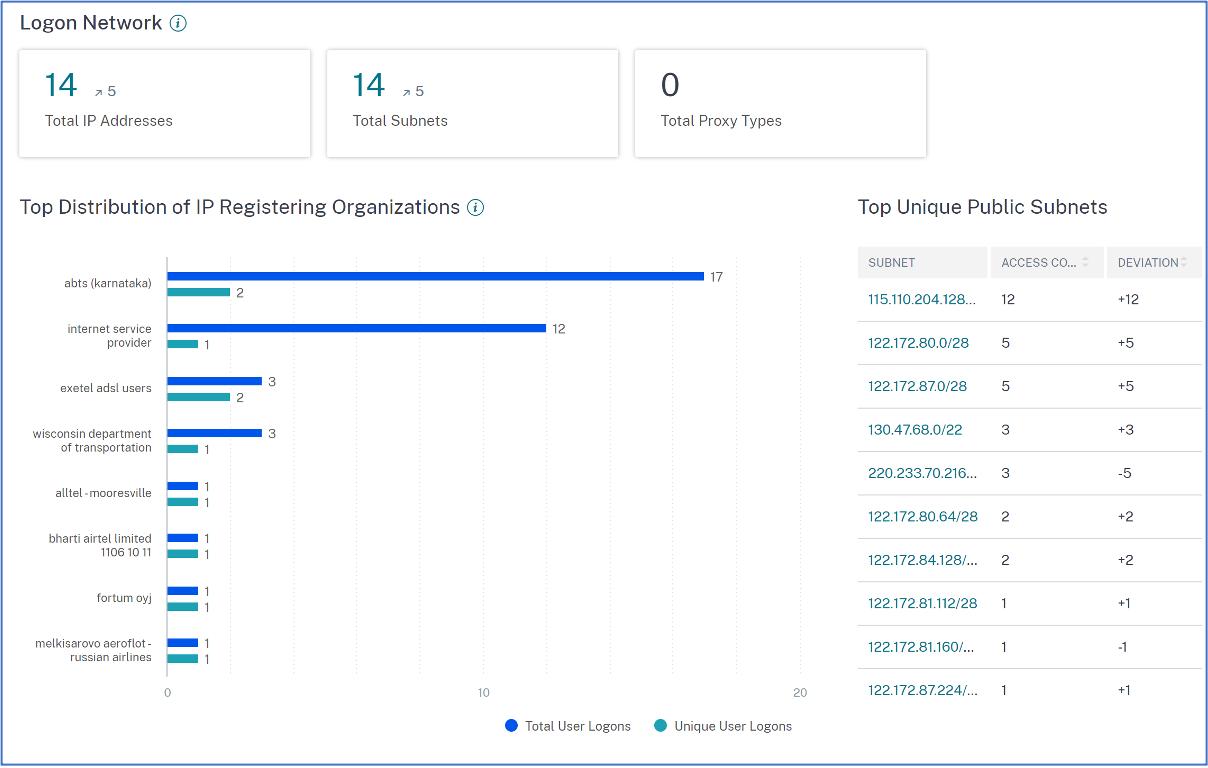
Logon network
In Access Assurance dashboard, you can now view the following additional user details:
-
The organizations associated with the IP addresses from which the users have logged on. These organizations include the entities such as corporate, government, educational entities, and internet service providers.
-
The total unique public subnet and private subnet from where the users have logged on.
-
The details that the user has logged on using proxies and private VPN services.
Using these additional details, as an administrator, you can validate the user logon details and ensure if the user logon is within the security expectation of the organization.
View user network details
Navigate to Security > Access Assurance and scroll down to view details under Logon Network.
-
Total IP Addresses: Indicates the total number of unique IP addresses used to log on to virtual sessions.
-
Total Subnets: Indicates the total number of subnets used to log on to virtual sessions.
-
Total Proxy Types: Indicates the total types of network or protocol utilized by the server to proxy the user connection.
-
Under Top Distribution of IP Registering Organizations, you can visualize an overview of total user logons and unique logon details from each organization (ISP). You can click the chart to drill-down to view details of the users, and their access profiles and logon details associated with the selected organization.
-
Under Total Unique Public Subnets, you can visualize an overview of the subnets, total user logons from each subnet, and the deviation trend in each subnet. You can click each subnet to drill-down to view details of the users, and their access profiles and logon details associated with the selected subnet.
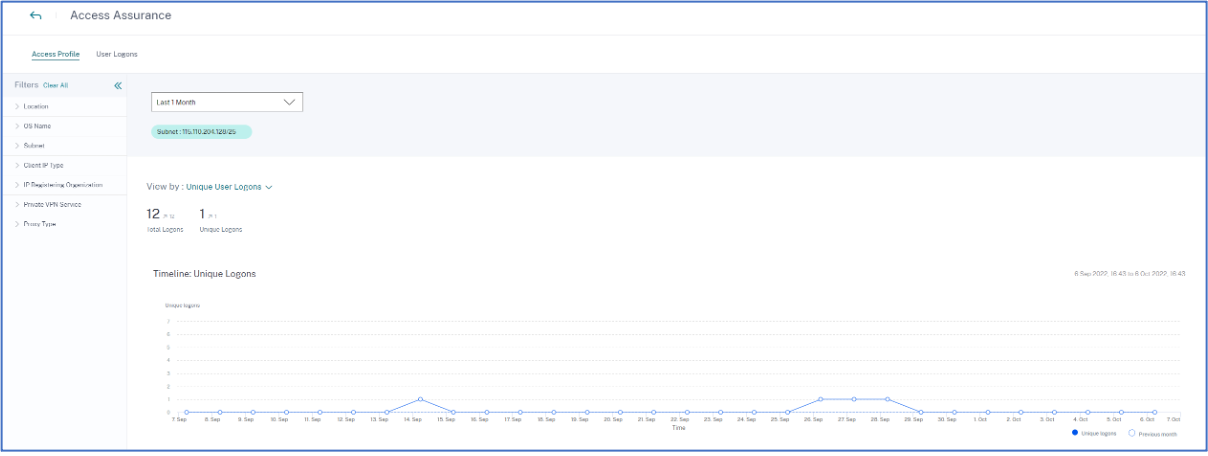
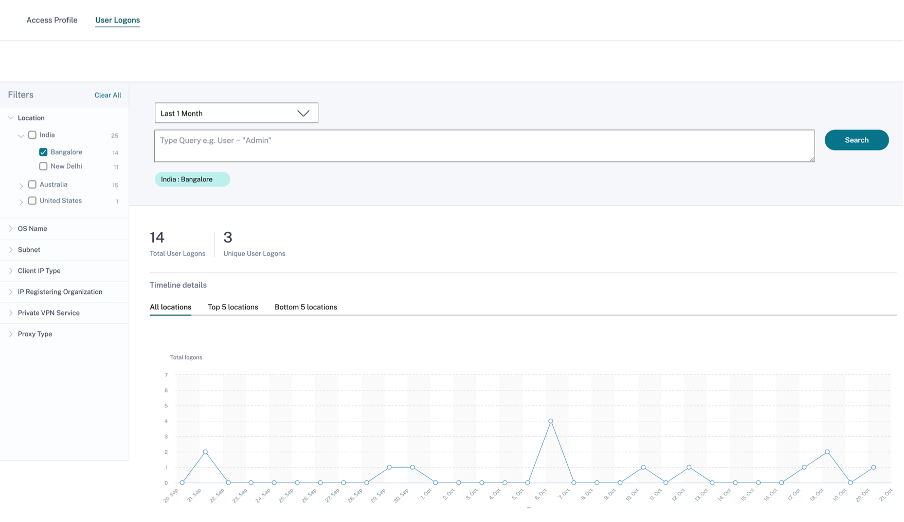
View access profiles of the users
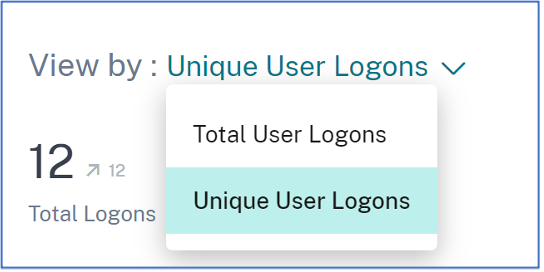
When you drill-down any metric (location, organization, or subnet), the Access Profile page provides the summary of your users’ accesses to virtual apps or virtual desktops from the selected locations. You can select the unique logon or total logon option to view the trend analysis for the selected period.
You can view the top access events for the selected metric (location, organization, or subnet). This information helps you to review the access patterns and the details for threat investigation and analysis.
The upward or downward trend for the total user logons and the unique user logons is compared based on the selected time period and previous time period of equal length. For example, if you select the time period as Last 1 Month, the trend is compared between last 1 month and previous to last 1 month.
Facets
You can use the following facets for the access events:
-
Location- Filter the access events by countries and their cities.
-
OS- Filter the access events by the operating systems and their versions.
-
Subnet- Filter the access events by the subnets.
-
Client IP Type- Filter the access events by public or private.
-
IP Registering Organization- Filter the organization associated to the public IP address.
-
Private VPN Service- Filter the access events by the private VPN network names.
-
Proxy Type- Filter the access events by the proxy type classifications such as HTTP, web, Tor, and SOCKS.
Note
You might also see the not available label if data is either unavailable or unidentified.
Based on the applied filters, view the following information for total user logons and unique user logons:
-
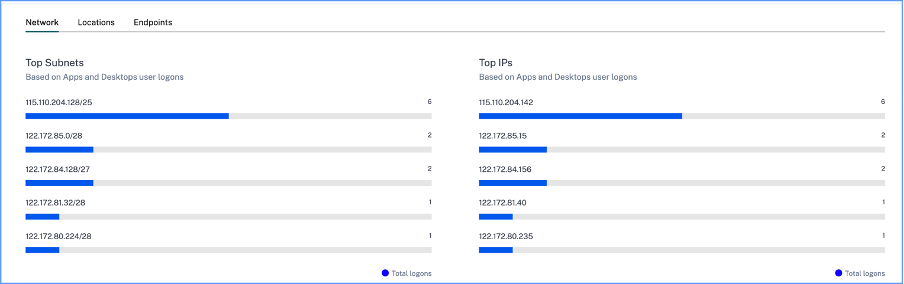
Network- The top subnets and the IP addresses from which the users have logged on to virtual apps or virtual desktops.
-
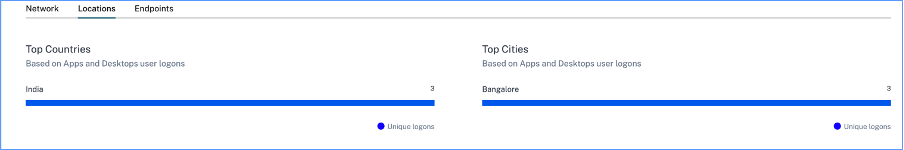
Locations- The top countries and cities from which the users have logged on to virtual apps or virtual desktops.
-
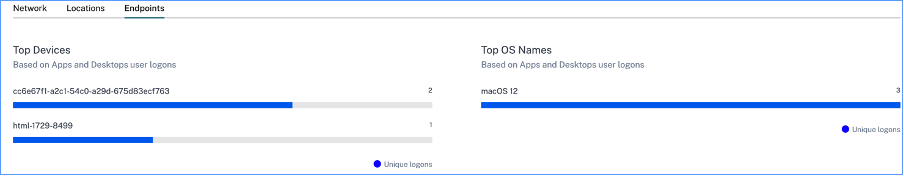
Endpoints- The top device and OS names based on apps and desktops user logons.
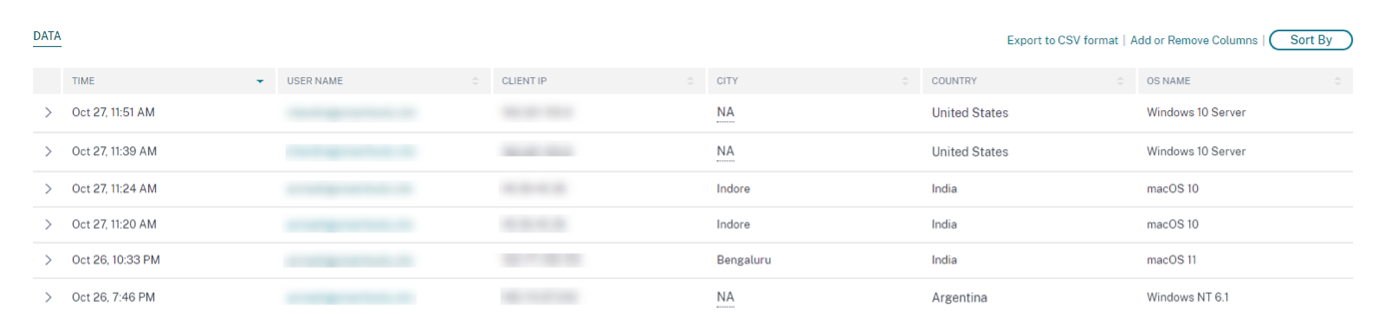
View logons details of users
The User Logons page provides the details of the user logons to virtual apps or virtual desktops from the selected locations. This information helps you during threat investigation and analysis.
The DATA table displays the following logon details for the selected locations and the time period:
-
Time. The date and time when the user logged on.
-
User name. The identity of the user.
-
Client IP. The IP address of the user device.
-
Client IP Type. The type of IP address of the user such as public or private.
-
City and country. The locations from where the user has logged on to virtual apps or virtual desktops.
-
Device ID. The identity code of the user device.
-
OS name. The operating system on the user device. For more information, see Self-service search for Apps and Desktops.
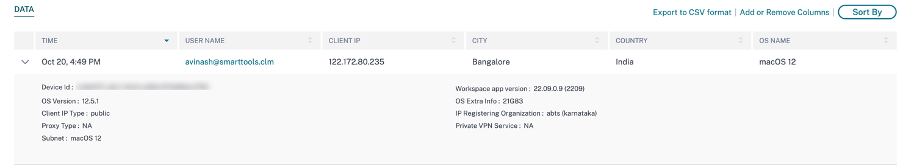
If you expand each event, you can see the following details:
-
OS version. The version of the operating system on the user device. For more information, see Self-service search for Apps and Desktops.
-
OS extra information- Any additional information of the operating system such as build numbers, service packs, and patches. For more information, see Self-service search for Apps and Desktops.
-
Workspace app version. The build version of Citrix Workspace™ app or Citrix Receiver.
On the DATA table, you can do the following operations:
-
Click Add or Remove Columns to update the table columns based on how you want to view the data.
-
Click Sort By and select the data elements to perform a multi-column sort. For more information, see Multi-column sorting.
-
Click Export to CSV format to download the data shown on the DATA table to a CSV file and use it for your analysis.
Search bar
You can also use the search bar to define your query using the dimensions associated with a logon event.
For example:
User = “test user” AND Client-IP = “10.xx.xx.xx AND Client-IP-Type = public”
User = “demo_user@citrix.com” AND OS-Major-Version = “macOS 10.13” AND OS-Minor-Version = 6
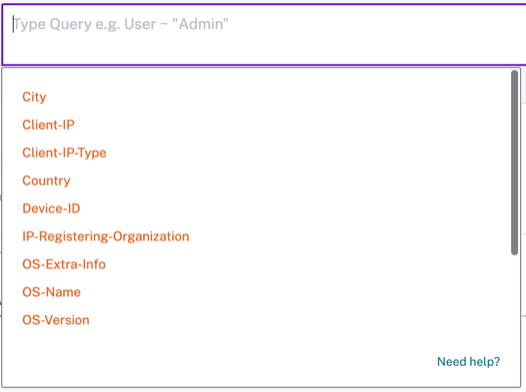
Facets
You can use the following facets for the logon events:
-
Locations- Filter the logon events by countries and their cities.
-
OS- Filter the logon events by operating system and their versions.
-
Subnet- Filter the access events by the subnets.
-
Client IP type- Filter the access events by the public and the private IP types.
-
IP Registering Organization- Filter the access events by user availed ISP.
-
Private VPN Service- Filter the access events by the private VPN network names.
-
Proxy Type- Filter the access events by the proxy type classifications such as HTTP, web, Tor, and SOCKS.
Note
You might also see the not available label if data is either unavailable or unidentified.