Custom reports
You can create and schedule custom reports using the events and insights available in Citrix Analytics for Security. Custom reports help you to extract information of specific interest and organize the data graphically. It helps analyze the security of the data source of your choice over time.
Custom reports support the following data sources:
- Apps and Desktops
- Gateway
- Secure Private Access
- Secure Browser
- Policies
- Risk Indicators
- Risk Score
Supported Fields in Custom Reports
Some data sources are also available in self-service search. To view these event types and supported fields, click the following data sources.
The following data sources are only available in Custom Reports. The following table lists the supported fields in the Custom reports for the following data sources:
- Risk Indicators
- Risk Score
| Data source | Dimension | Description |
|---|---|---|
| Risk Indicators | Category | Indicates the category of risk indicators. The risk indicators are grouped into one of four categories - compromised endpoints, compromised users, data exfiltration, or insider threats. |
| Risk-Indicator-Name | The name of the risk indicator. For a custom risk indicator, the name is defined by the admin while creating the indicator. | |
| Severity | Indicates the severity of the risk. It can be low, medium, or high. | |
| User-Name | The user name or domain\username that is used for logging in. | |
| Risk Score | Risk-Score | The risk score assigned to the user. The risk score varies from 0 to 100 depending on the threat severity associated with the user’s activity. |
| User-Name | The user name or domain\username that is used for logging in. | |
| Risk-Score-Category | Based on the risk score, a risky user can fall into one of the following categories: high risk, medium risk, and low risk. |
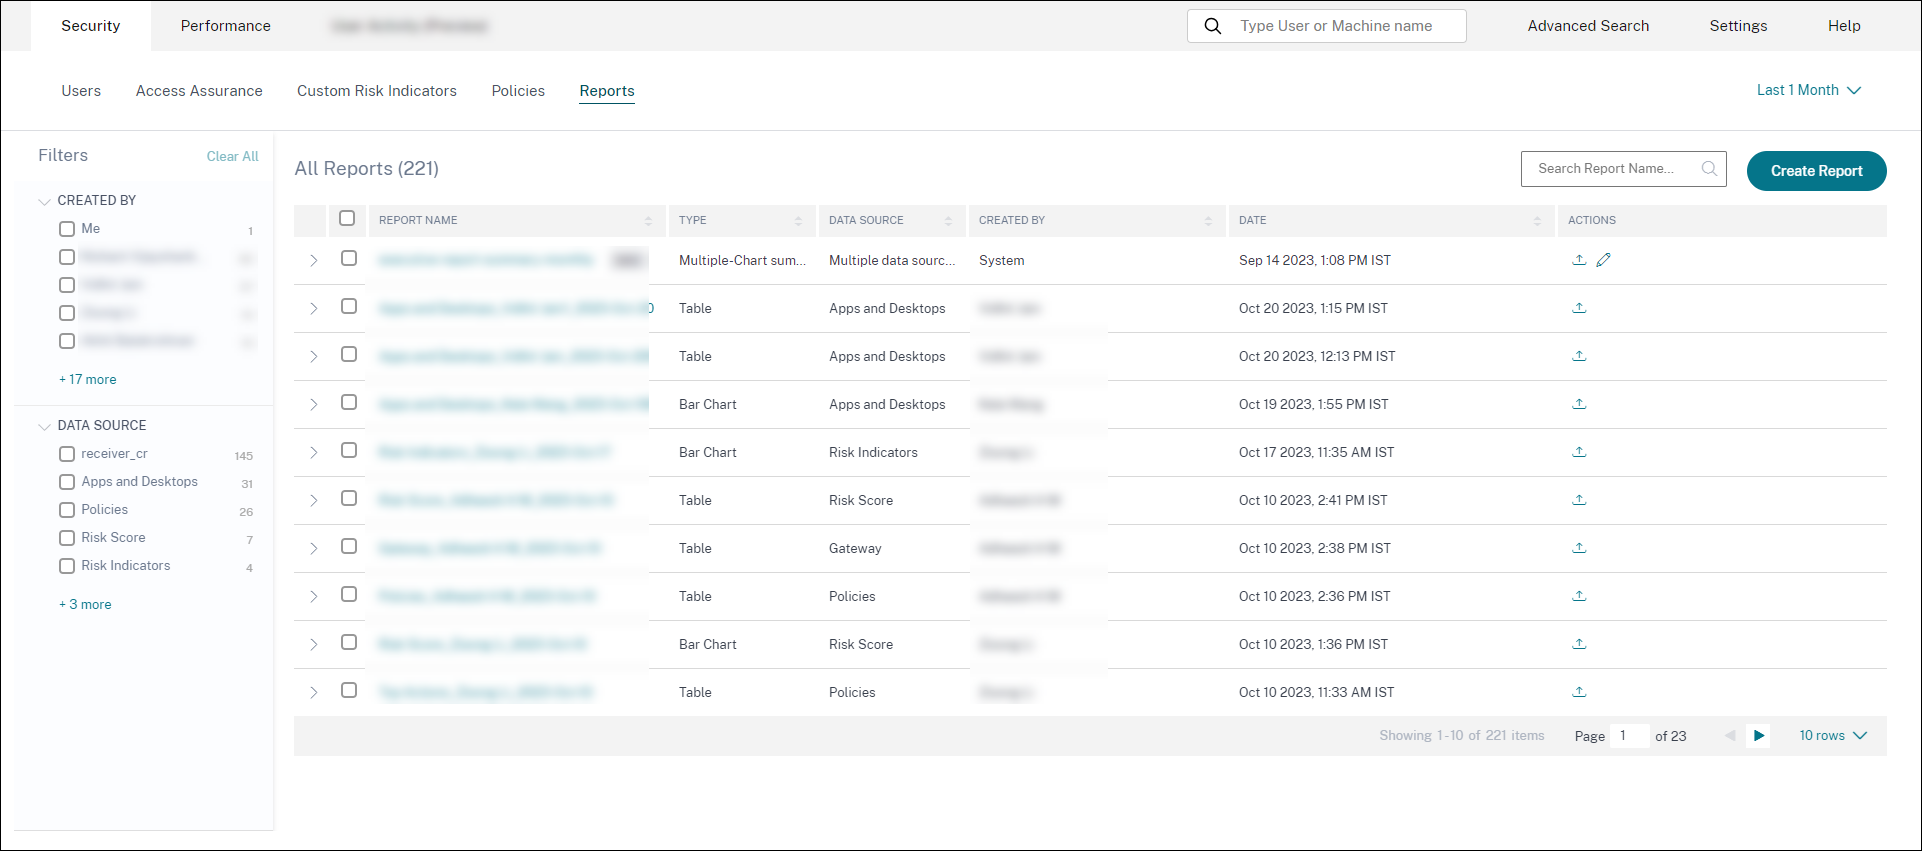
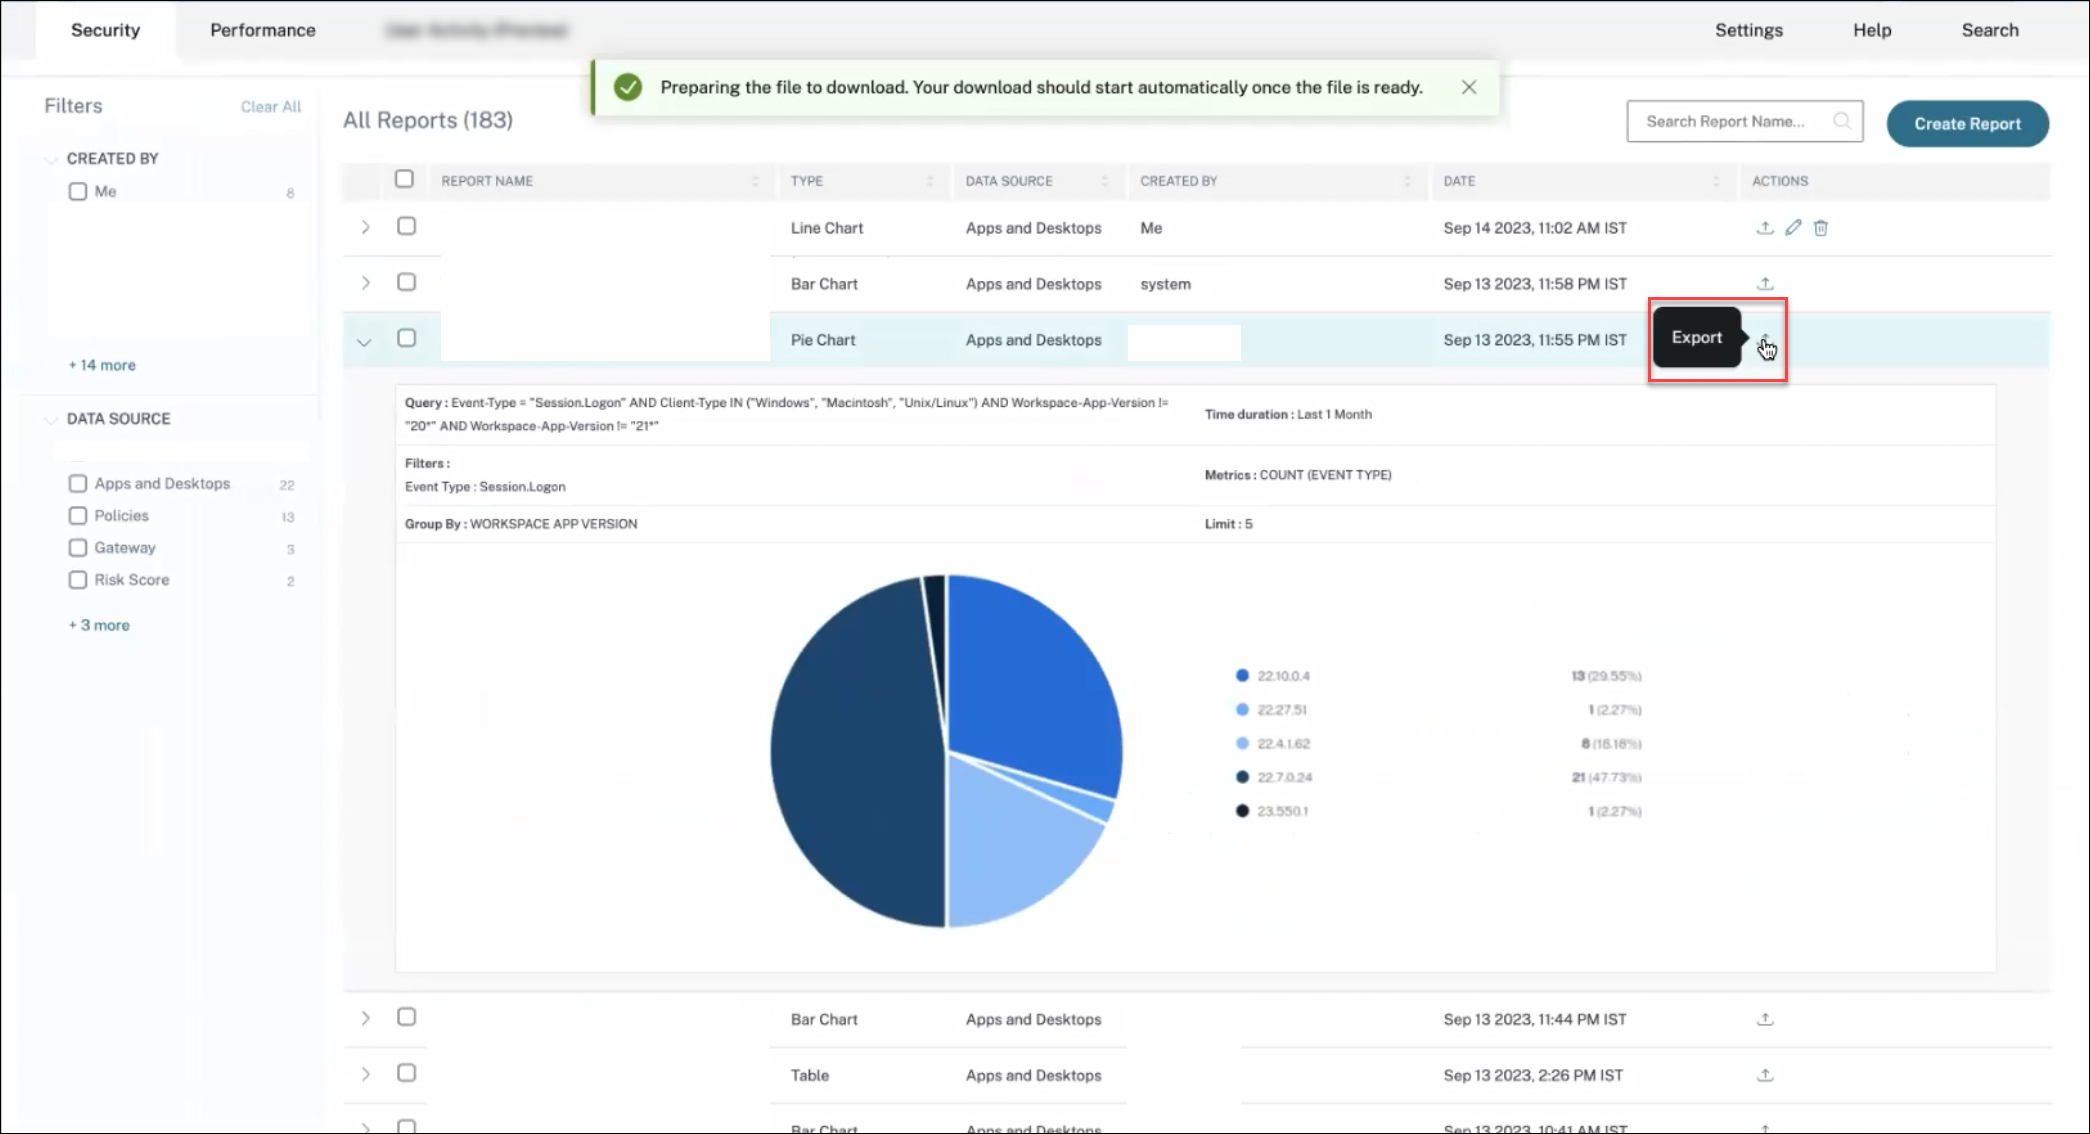
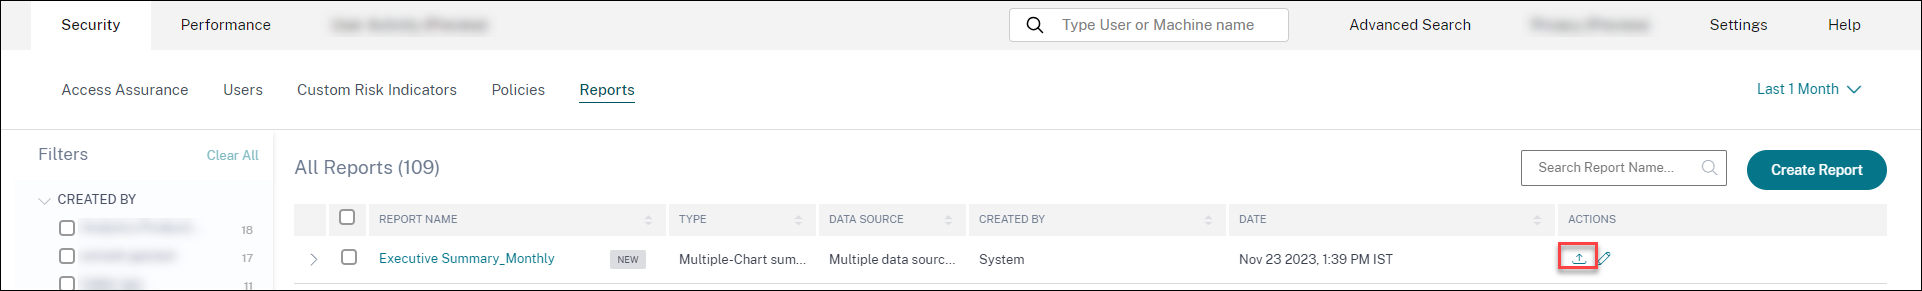
Reports
You can perform the following actions on reports using this view:
- Click Create Report to create a custom report.
- Expand a row to see the preview of an existing custom report.
- Click the report name to see the detailed report visualization.
- Click the export icon to export an existing custom report in PDF format.
- Click the edit icon to edit the reports you’ve created.
- Click the delete icon to delete the reports you’ve created.
Create a custom report
To create a custom report, click Create Reports. On the Create Report page, you can choose to create a custom report with or without templates.
Creating a custom report with templates
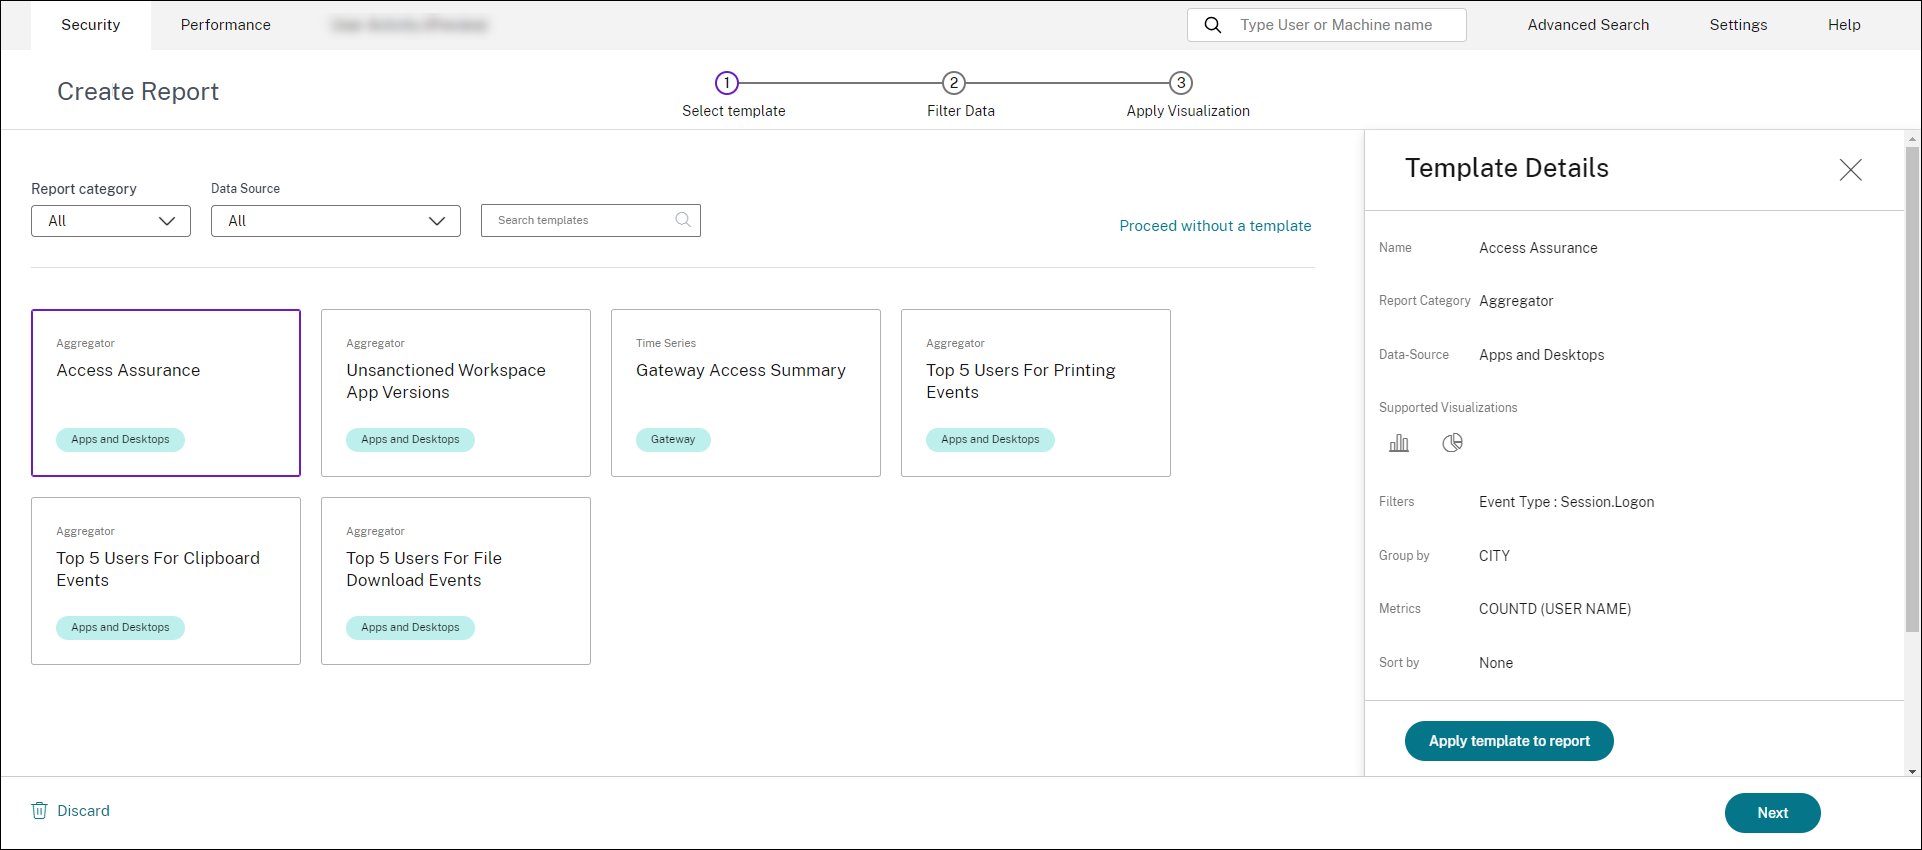
To create a custom report with a template:
-
Select a template: Once you click a template, the template details are listed on the right. Click Apply Template to Report to enable the report to use the selected template.
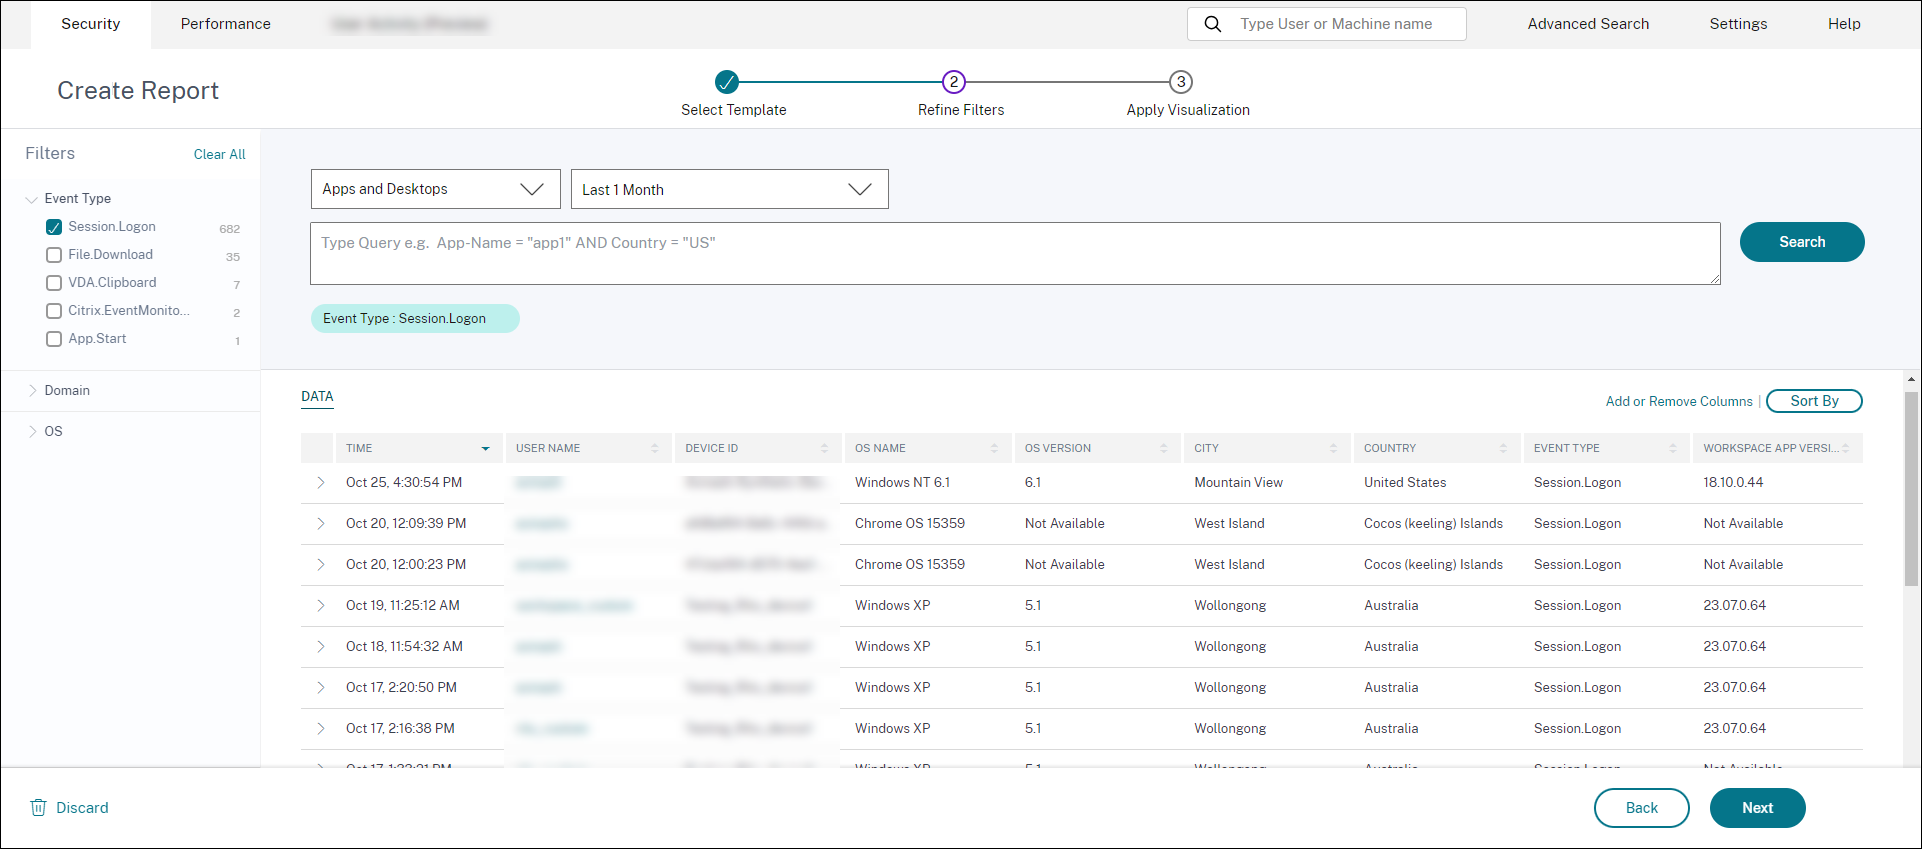
-
Refine Filters: The Refine Filters page shows the filters that were predefined for the template you selected. Make the required changes and then click Next.
- Apply Visualization: Select one of the available visualizations for displaying the report.
- Bar chart: Presents data with vertical rectangular bars with height proportional to the values. Used for comparing events.
- Stacked-column chart: Presents data in the form of bars stacked one over the other. Used to visualize the total sum of data over multiple sub-categories.
- Pie chart: Presents data in the form of a pie. Used to visualize the relative size of the data or percentages.
- Donut chart: Presents data in the form of a donut. Used to visualize the relative size of the data or percentages. - Table: Presents data in the form of a table. Used to visualize as many dimensions as needed.
- Line chart: Presents data with dots connected by straight line segments. Used to visualize data trends over a time period.
-
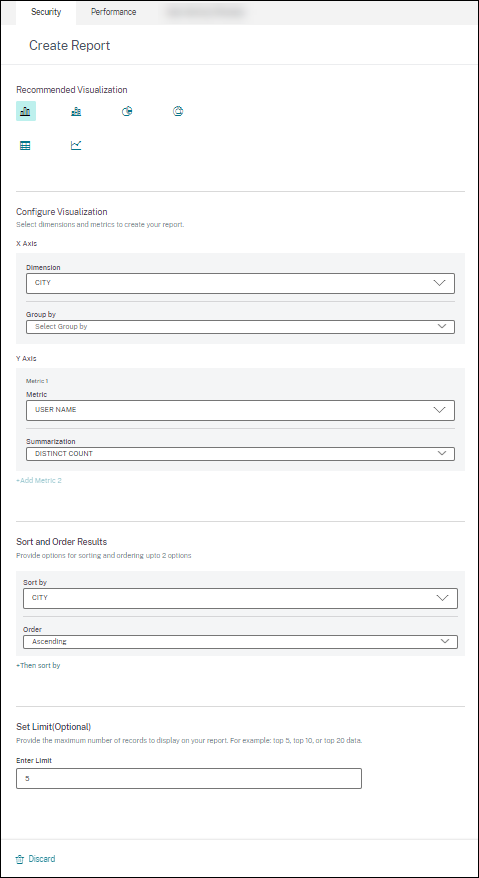
Now configure the visualization with the following parameters:
- Dimension for the x-axis
- Metrics to be plotted in the y-axis
- Summarization or aggregations, such as average or count, to be applied to the metric
- Options for sorting and ordering
- An optional limit for the maximum number of records to be displayed on the report.
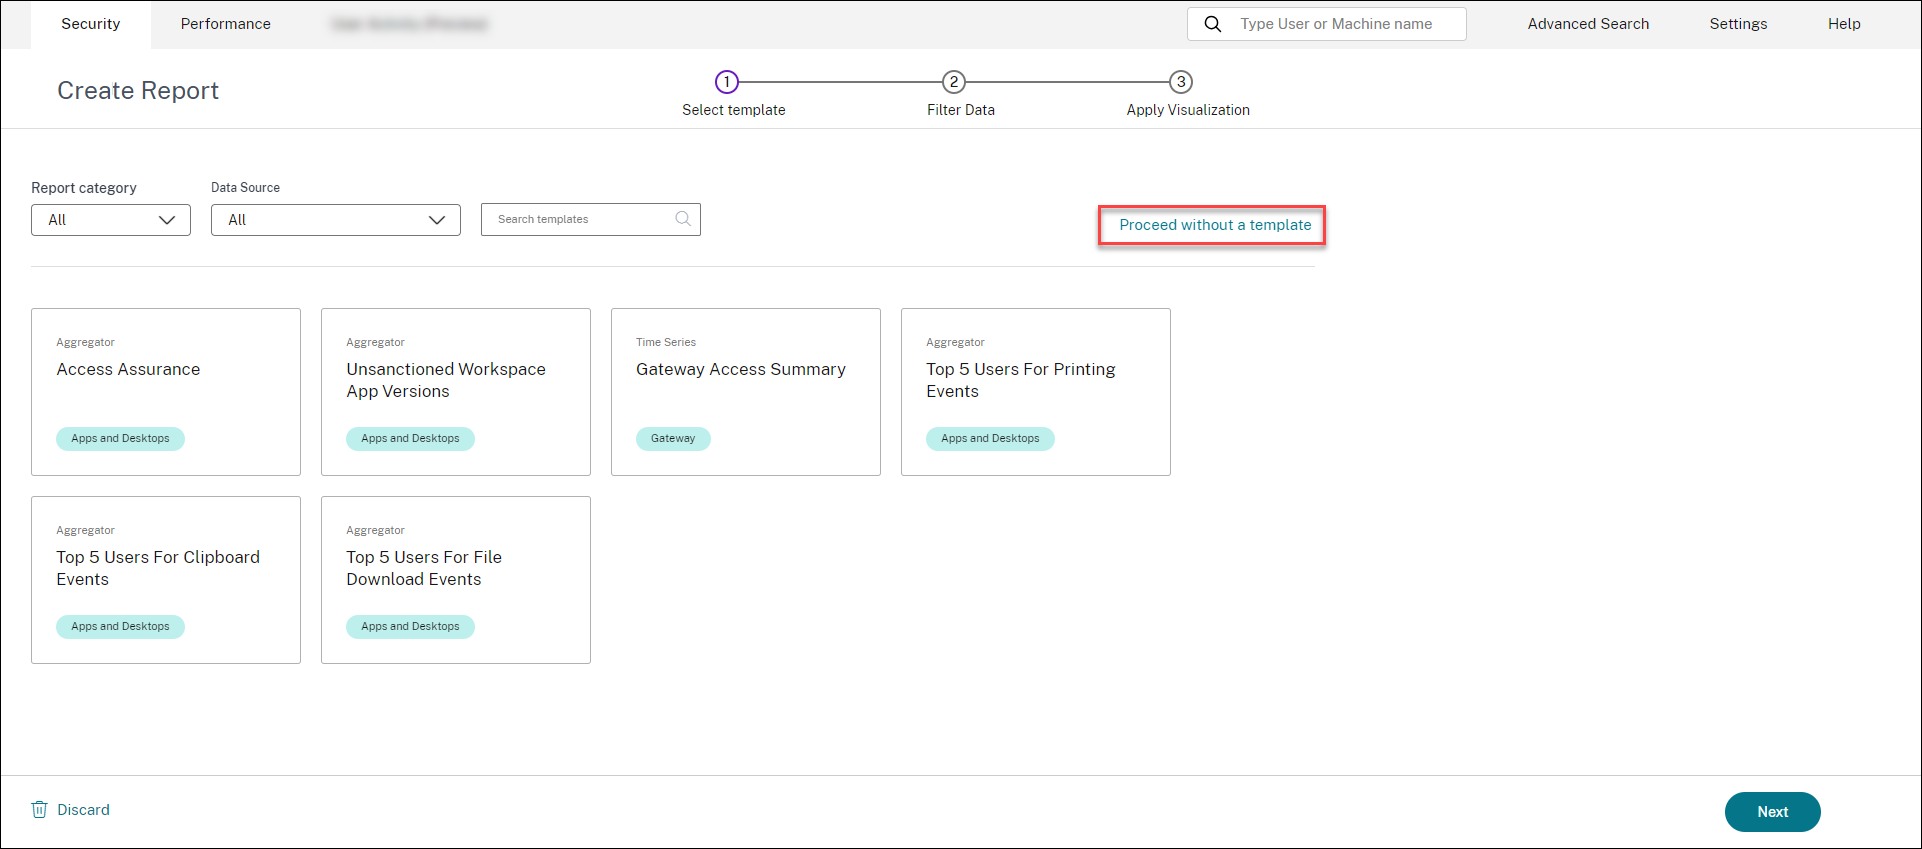
Creating a custom report without templates
You can also create a custom report without a predefined template. Click Create Custom Report without Template. Select a data source from the dropdown list. Follow the steps to define the filters, apply visualization, save, and schedule the report.
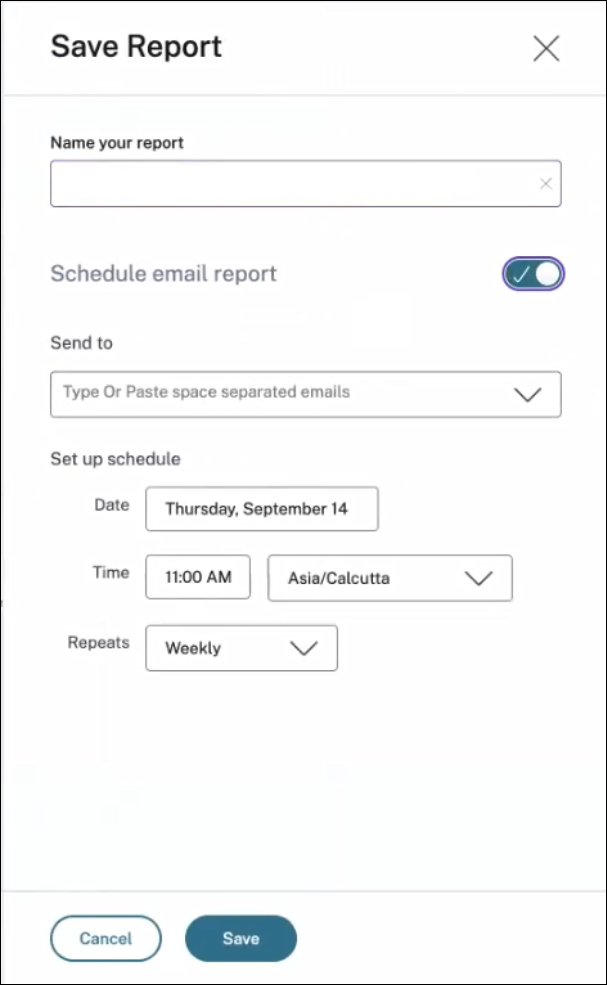
Save a report
- To save the report, click Save. Specify a title for your report.
- You can schedule to email the report to the specified email IDs and distribution lists on a specific date and time or a recurring schedule.
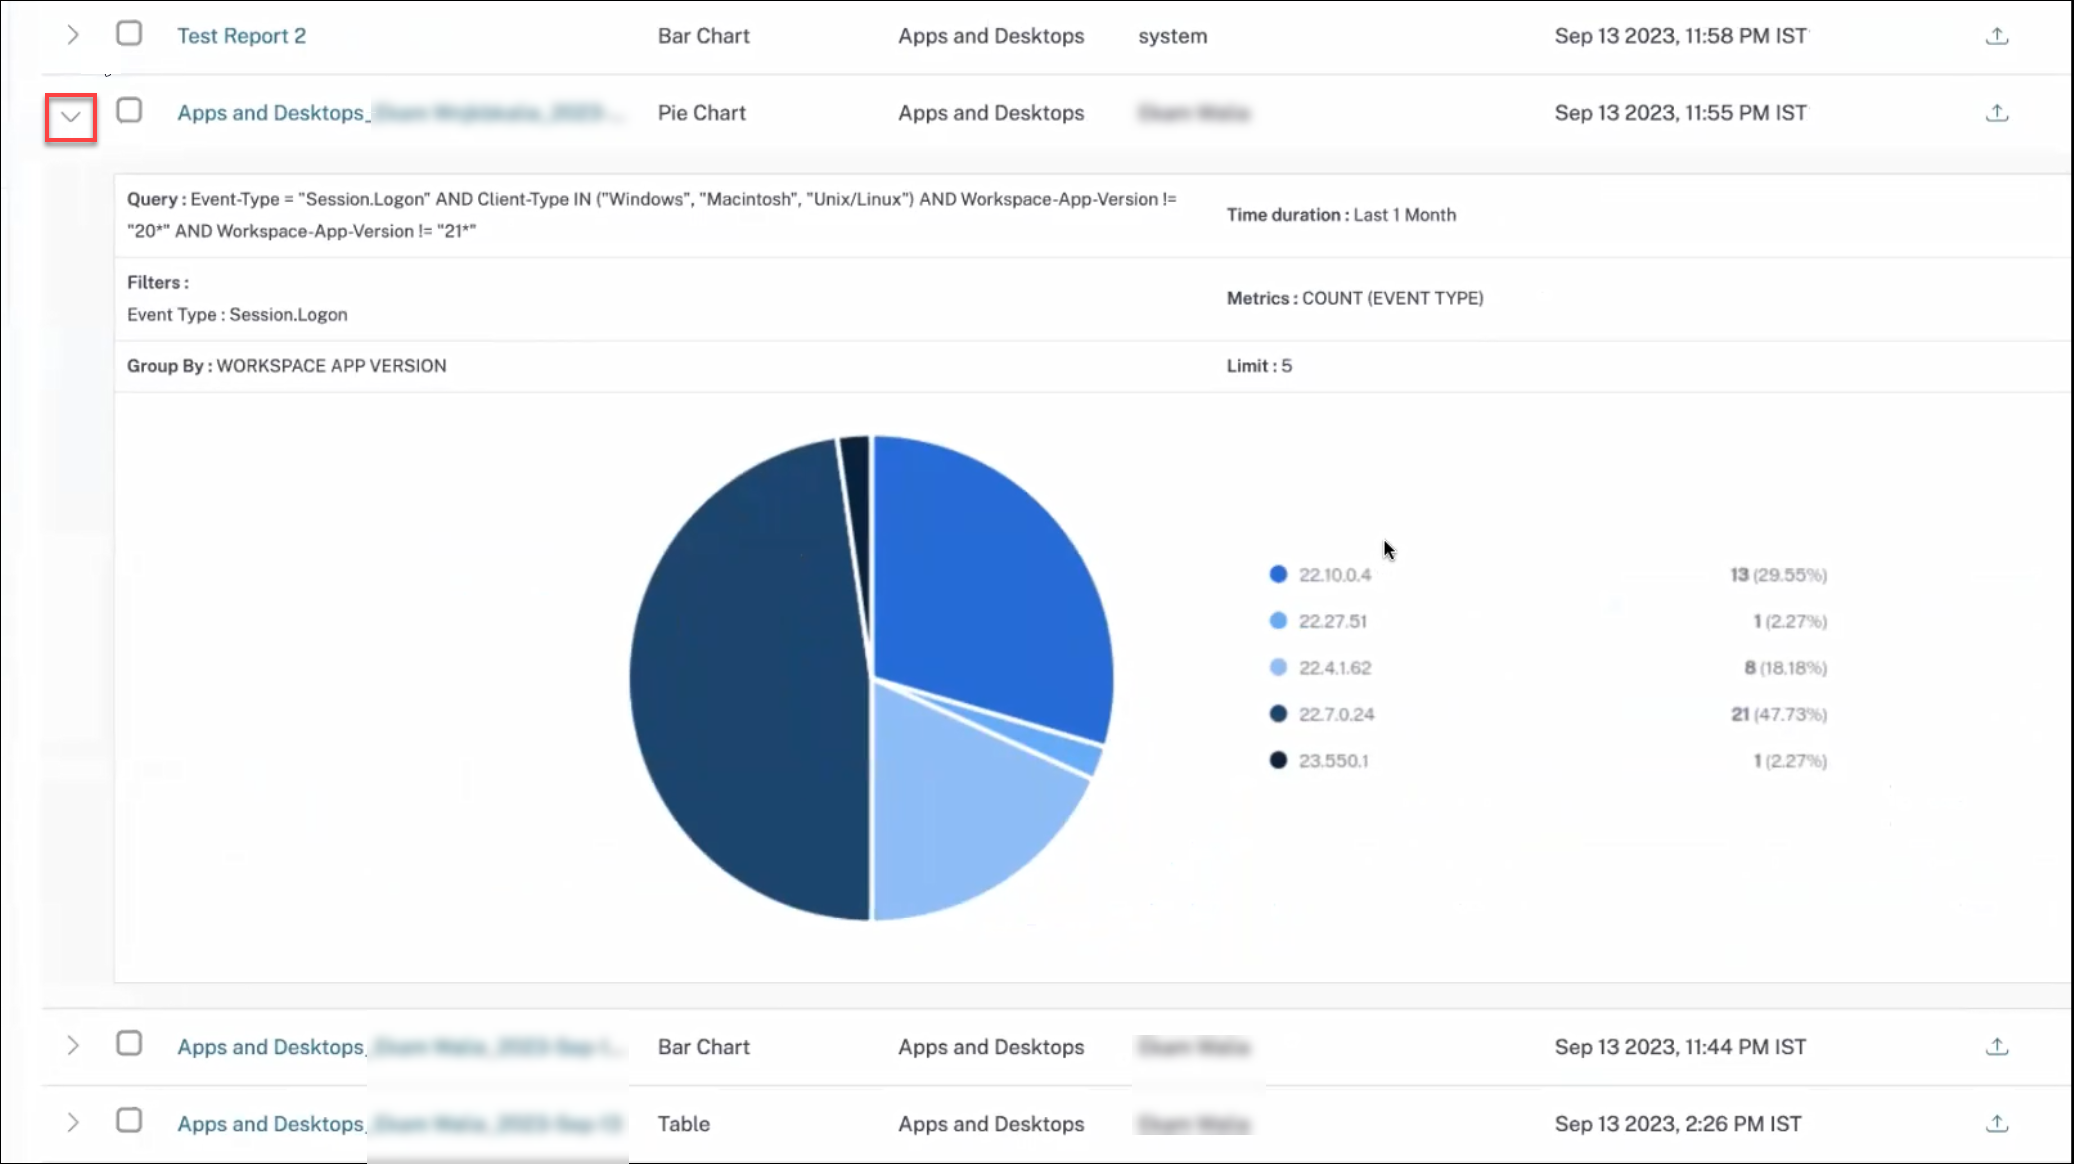
View a report
- After you’ve created and saved a report, you can view the report on the Reports page. You can also modify or delete a saved report.
- Click the dropdown button to preview the report.
Export a report
Click the export icon to export the report.
Delete a report
Click the delete icon to delete the report.
Note:
Only the user who creates the report can delete it.

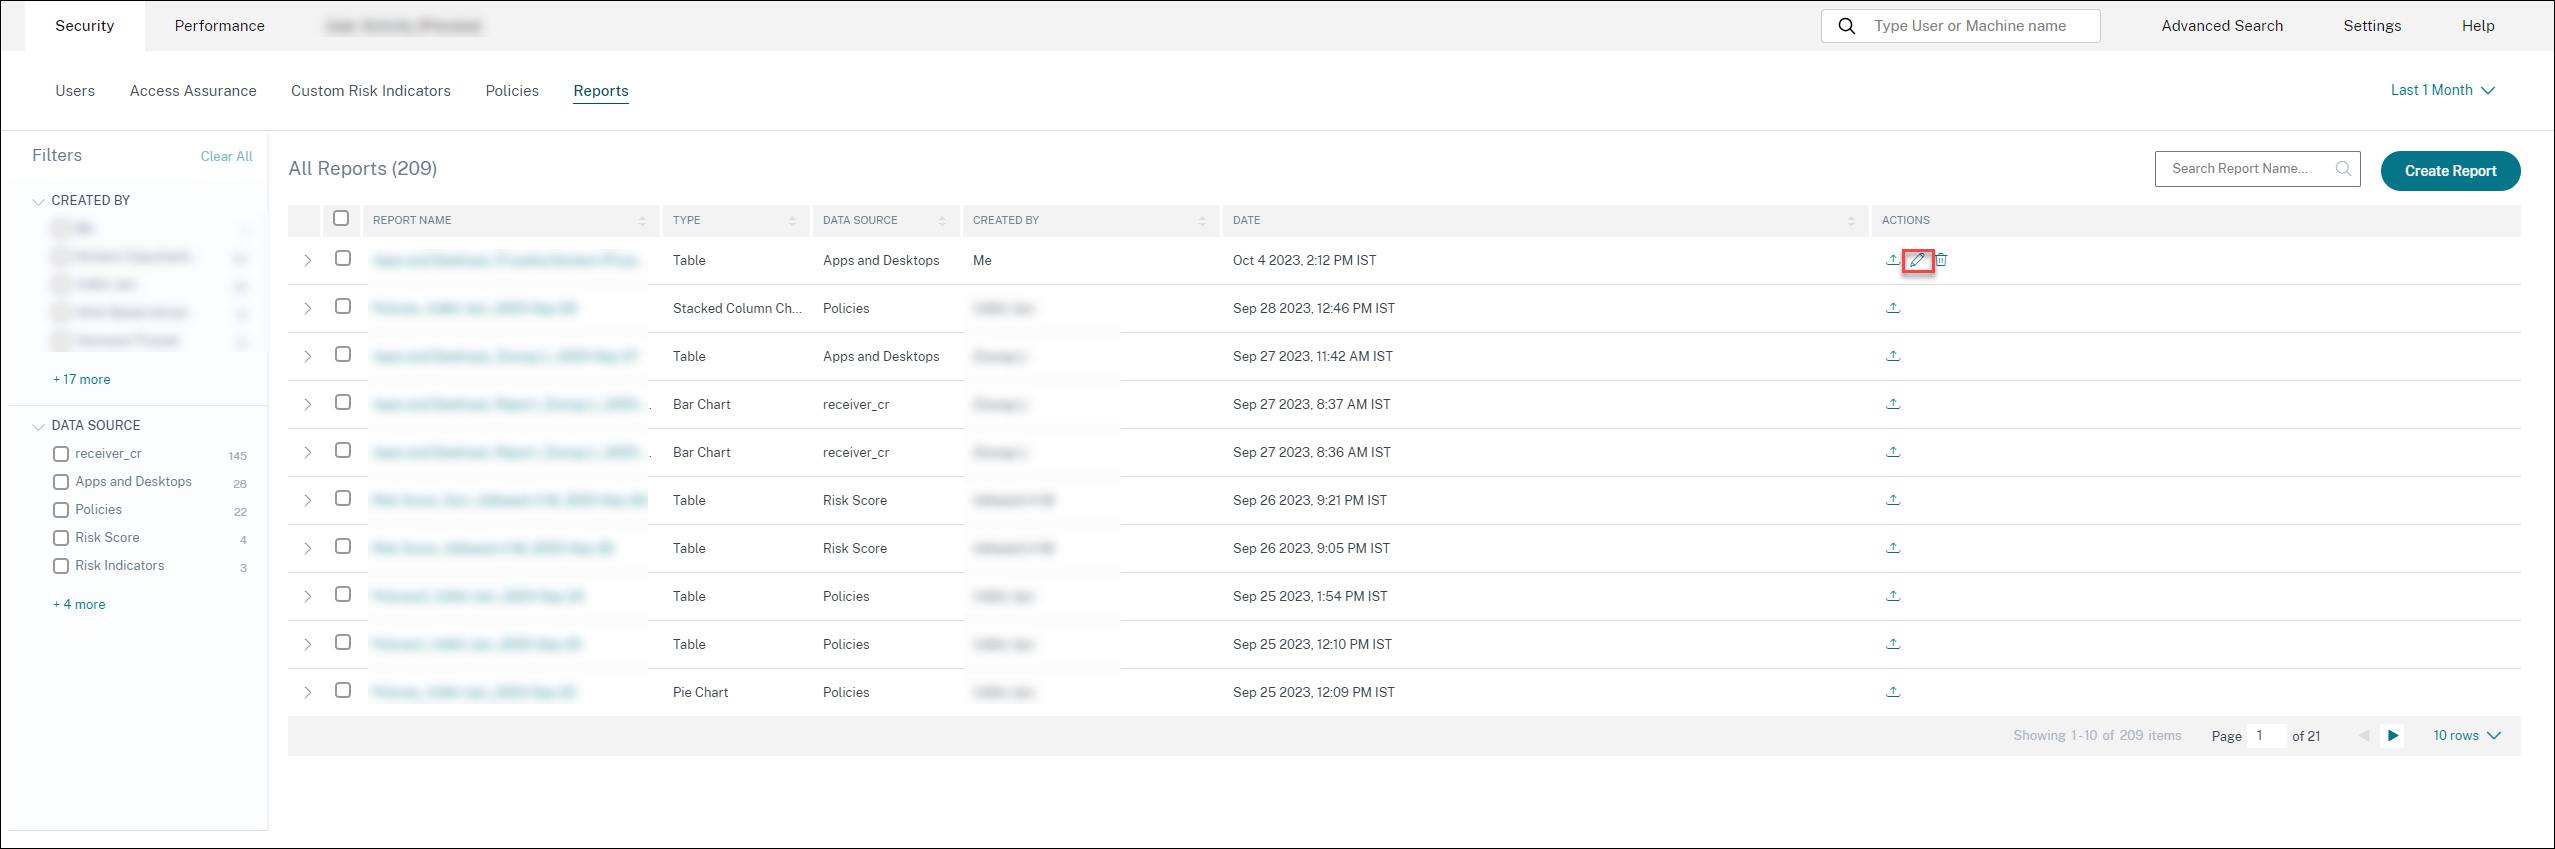
Edit a report
Click the edit icon to edit the report.
Note:
Only the user who creates the report can edit it.
Executive Summary report
You can schedule an automated export through email which contains a PDF of a pre-created executive summary report. The executive summary report is a collection of reports depicting your enterprise’s security posture at one single glance for the selected time period to the audience of your choice.
You can create the report for data for the following time durations:
- Last 1 Hour
- Last 12 Hour
- Last 1 Day
- Last 1 Week
- Last 1 Month
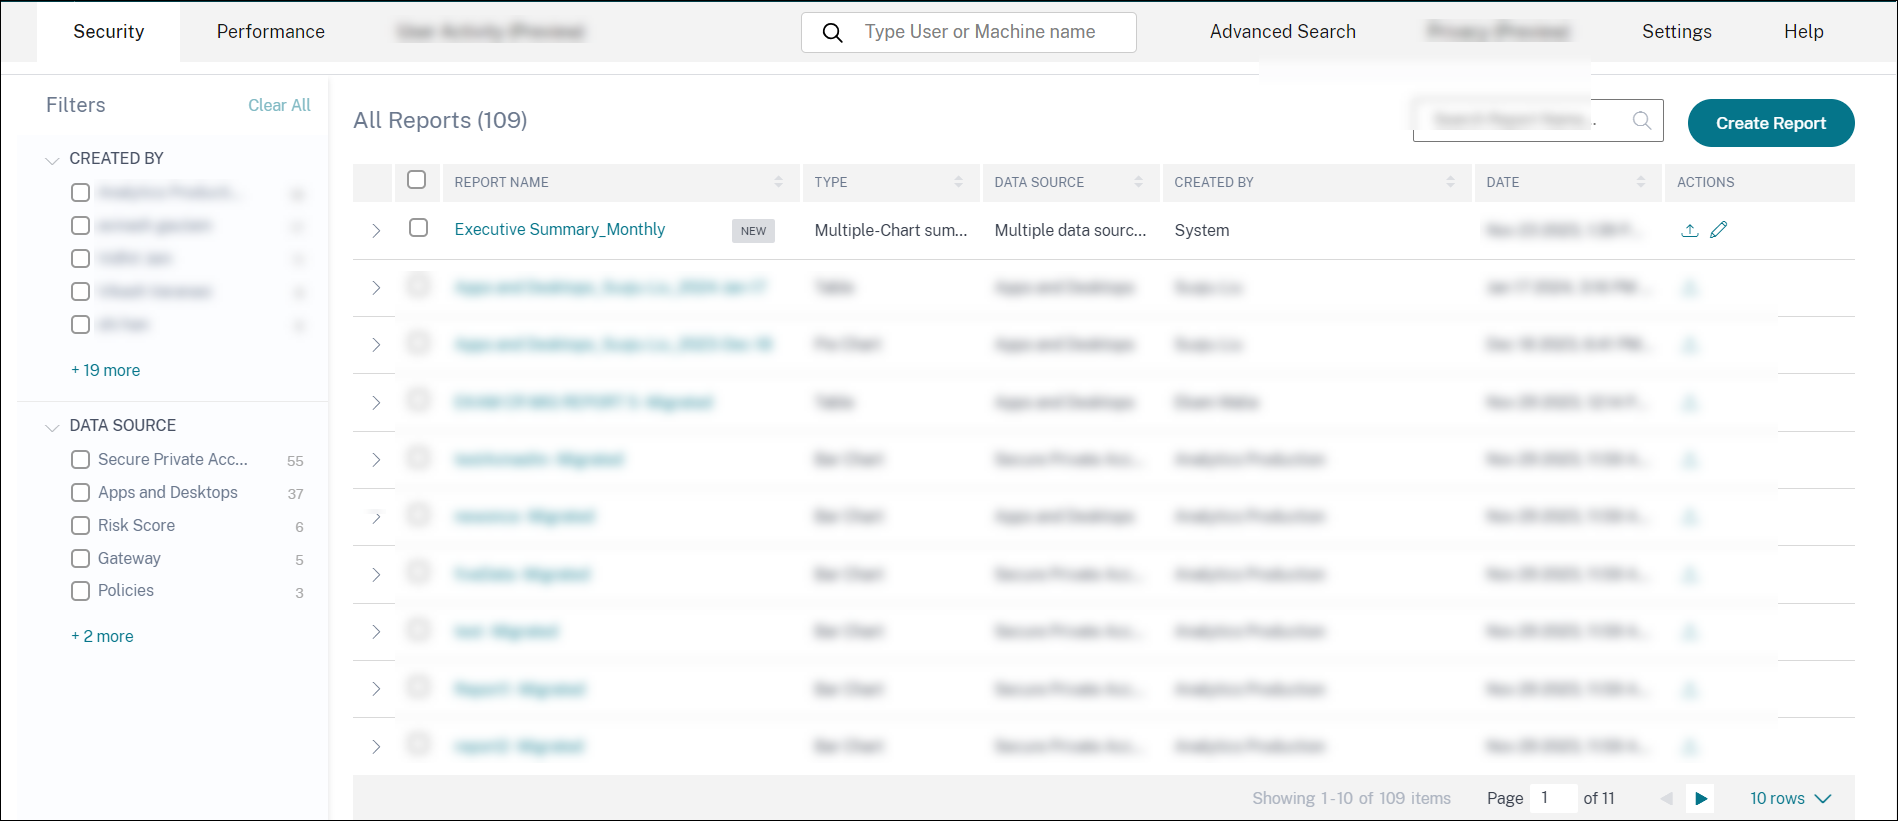
What reports does it contain?
The Executive Summary report contains the following reports:
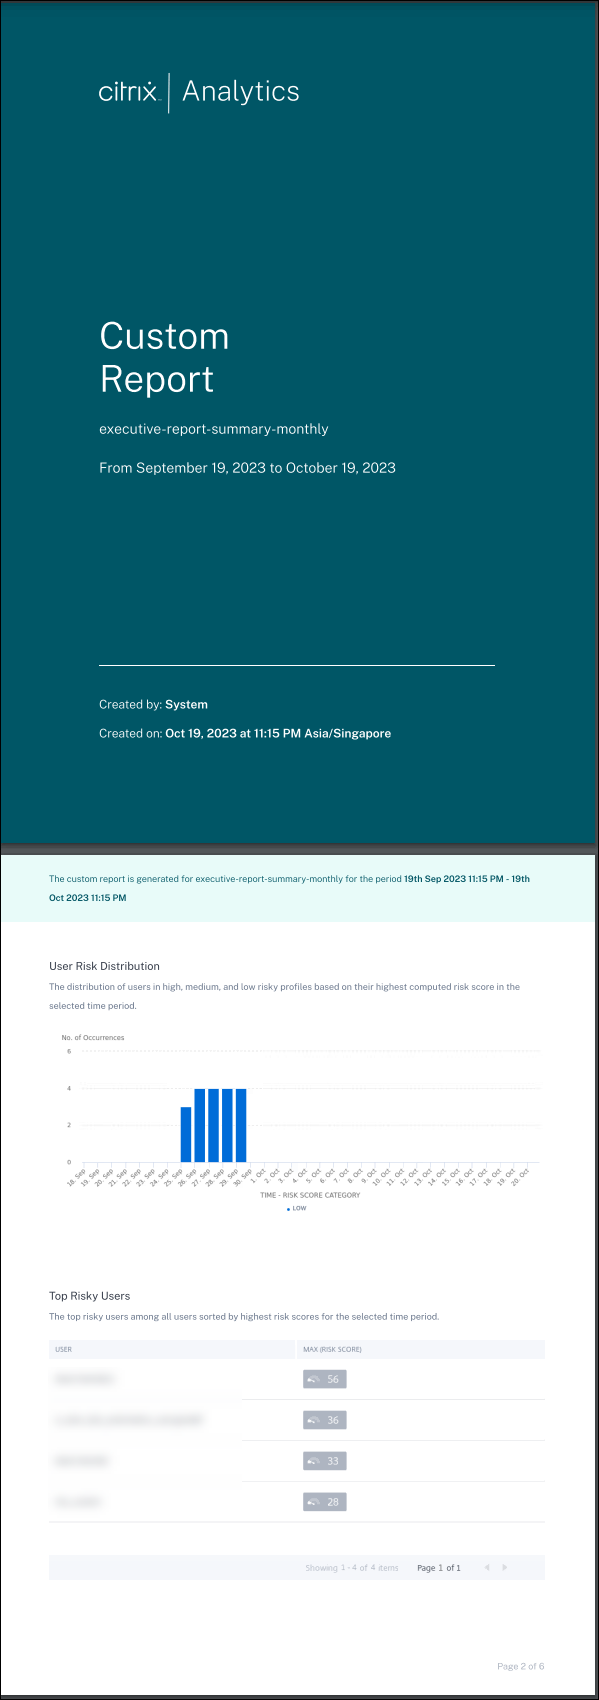
- User Risk Distribution: The distribution of high, medium, and low risky profiles based on their highest computed risk score in the selected time period.
- Top Risky Users: The top risky users among all users sorted by highest risk scores for the selected time period.
-
Risk Occurrences by Categories: The comprehensive view of the types of risk exposures and critical risks provided by risk categories that require immediate action. The risk indicators are grouped under the following categories:
- Compromised users
- Compromised endpoints
- Data exfiltration
- Insider threats
- Risk Indicators: The triggered risk indicators for the users for the selected time period.
- Actions: The applied actions to the risk indicators triggered for the users for the selected time period.
- Top policies: The top five policies that got triggered the most in the selected time period.
- Top Actions: The top five actions that got triggered the most in the selected time period.
- Risk Indicators by Severity: Default and custom risk indicators triggered by the users sorted based on the severity.
- Risk Indicators by Total Occurrences: Default and custom risk indicators triggered by the users sorted based on the occurrences.
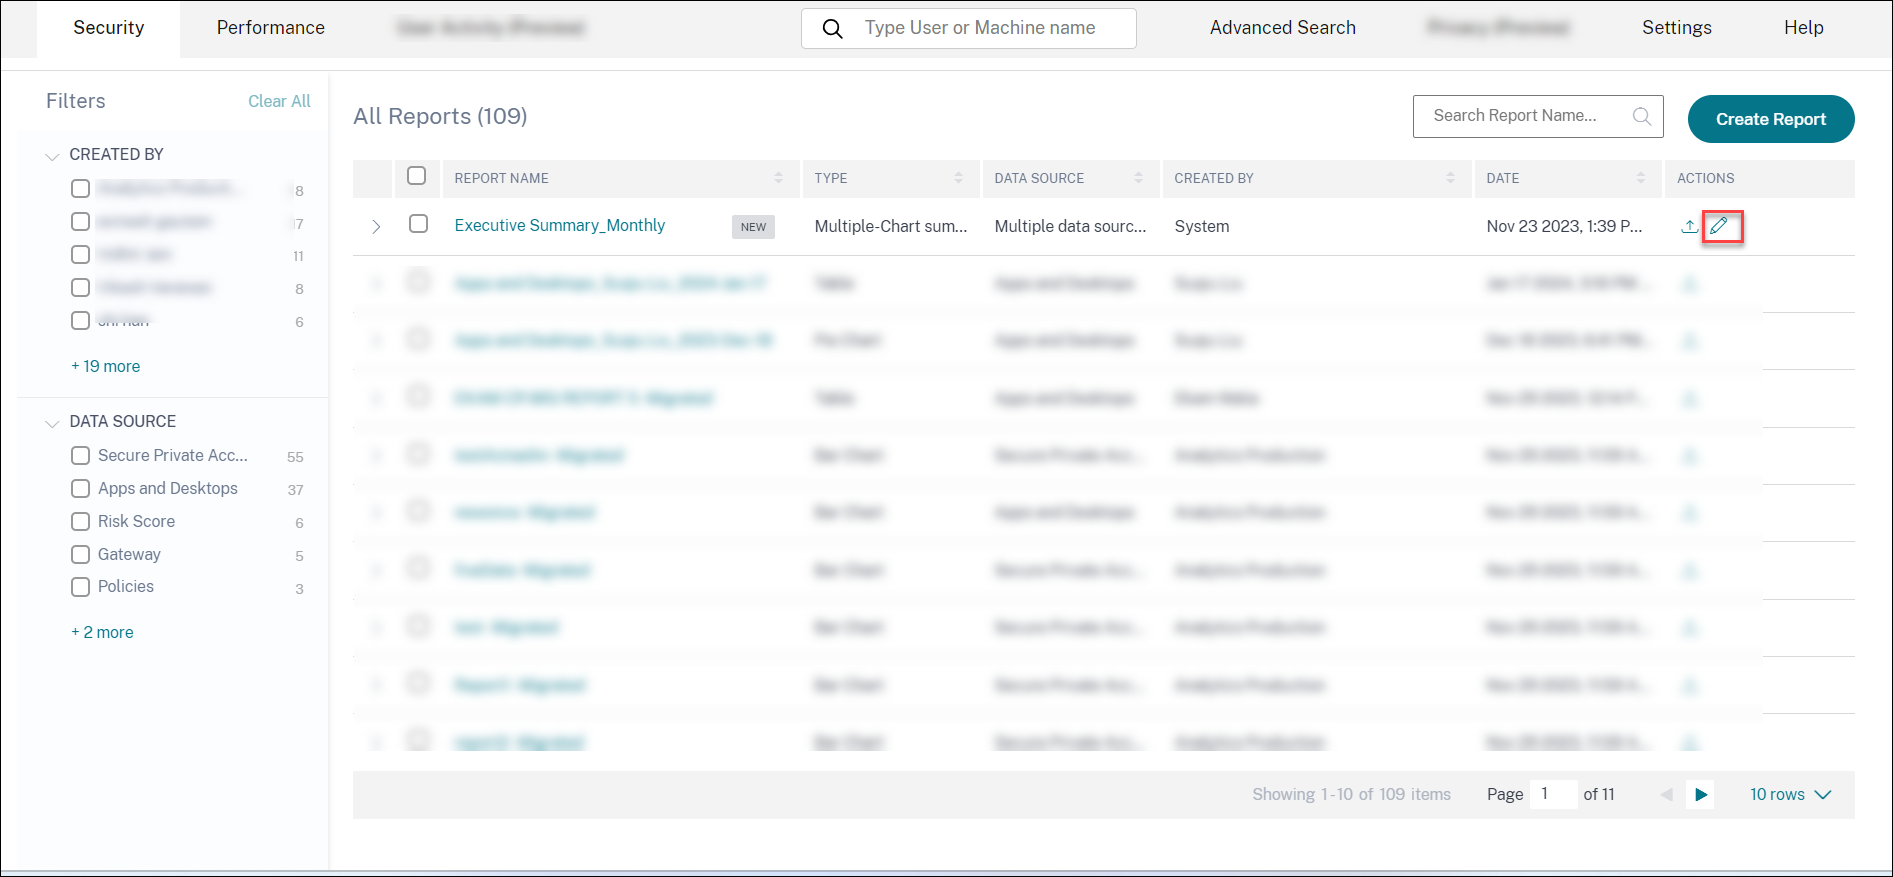
Edit an Executive Report
To edit an Executive Report, complete the following steps:
- Click the Edit symbol.
- In the Configure your report pane, select the time duration for which you want to see the data.
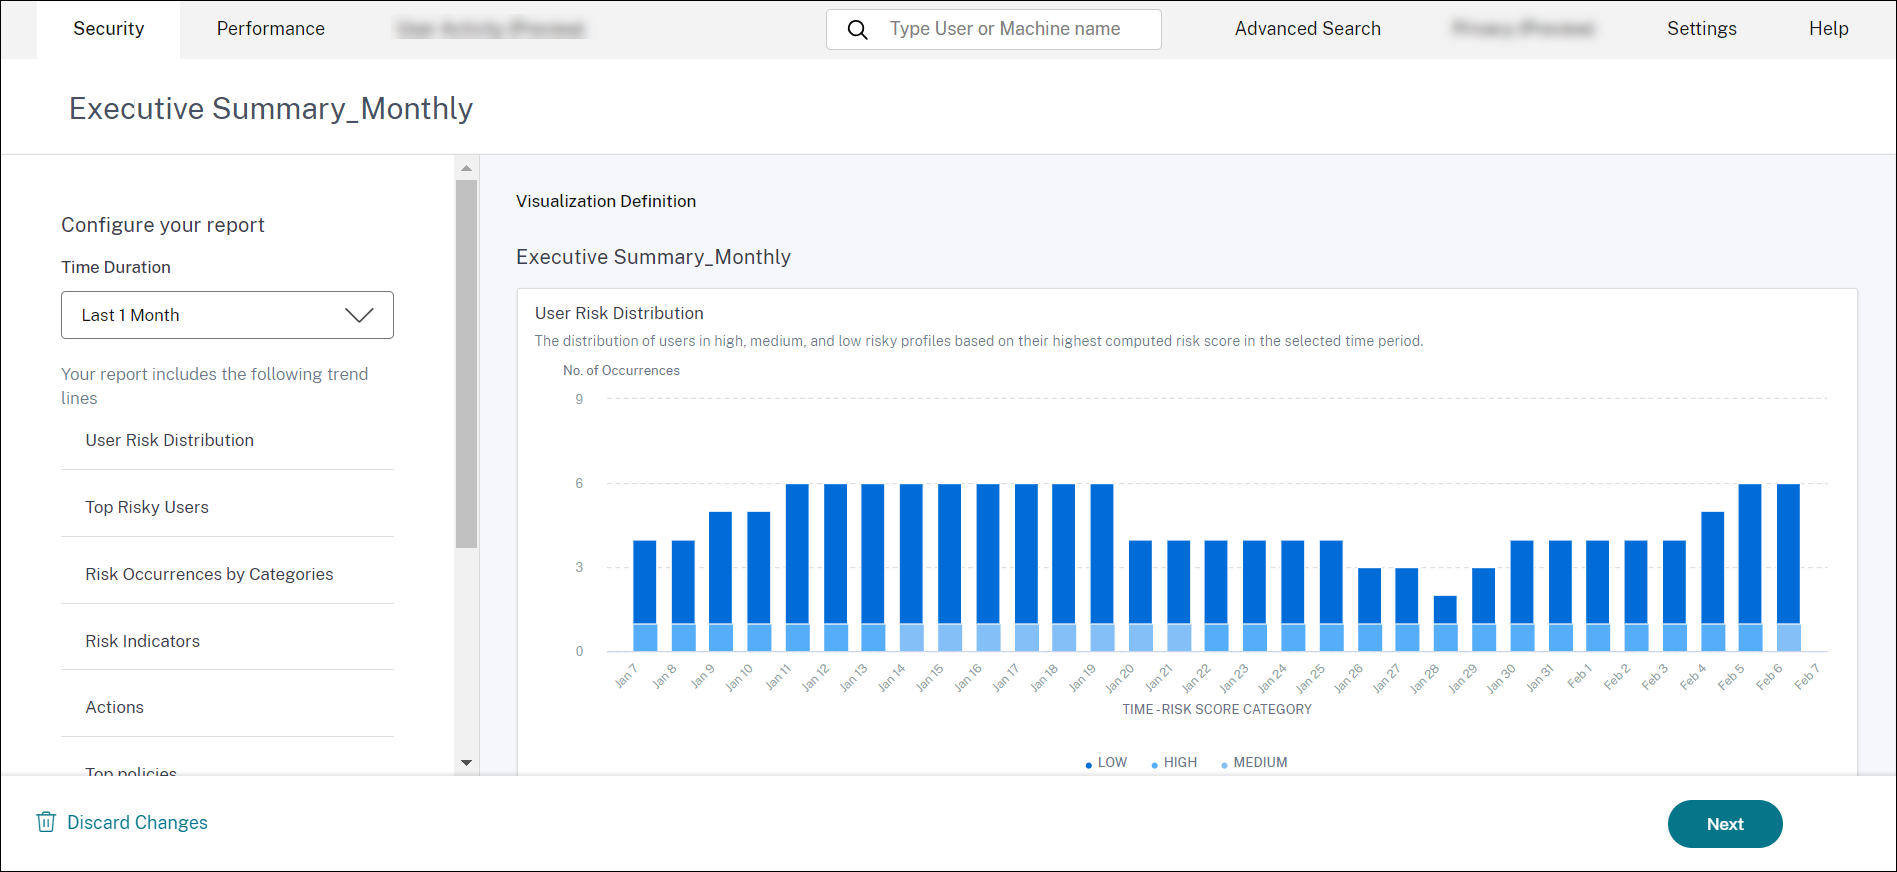
- Click Next. The Save Report pane appears.
Note:
To discard the changes, click Discard Changes.
-
In the Save Report pane, enter the following details:
- Name your report: The name of the executive report.
- Schedule email report: Toggle on to schedule the report. The toggle is off by default.
- Send to: Select a distribution list from the dropdown. You can also add a combination of distribution lists and individual email addresses. To create a customized distribution list, see Admin Email Settings.
-
Set up schedule: Select the desired time at which the report is first sent to the selected audience and the time it repeats.
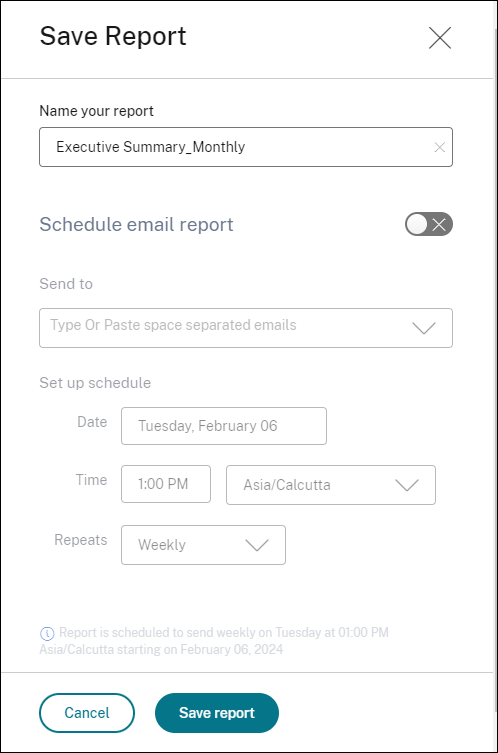
-
Click Save report. The report is then sent as an email to the listed recipients.
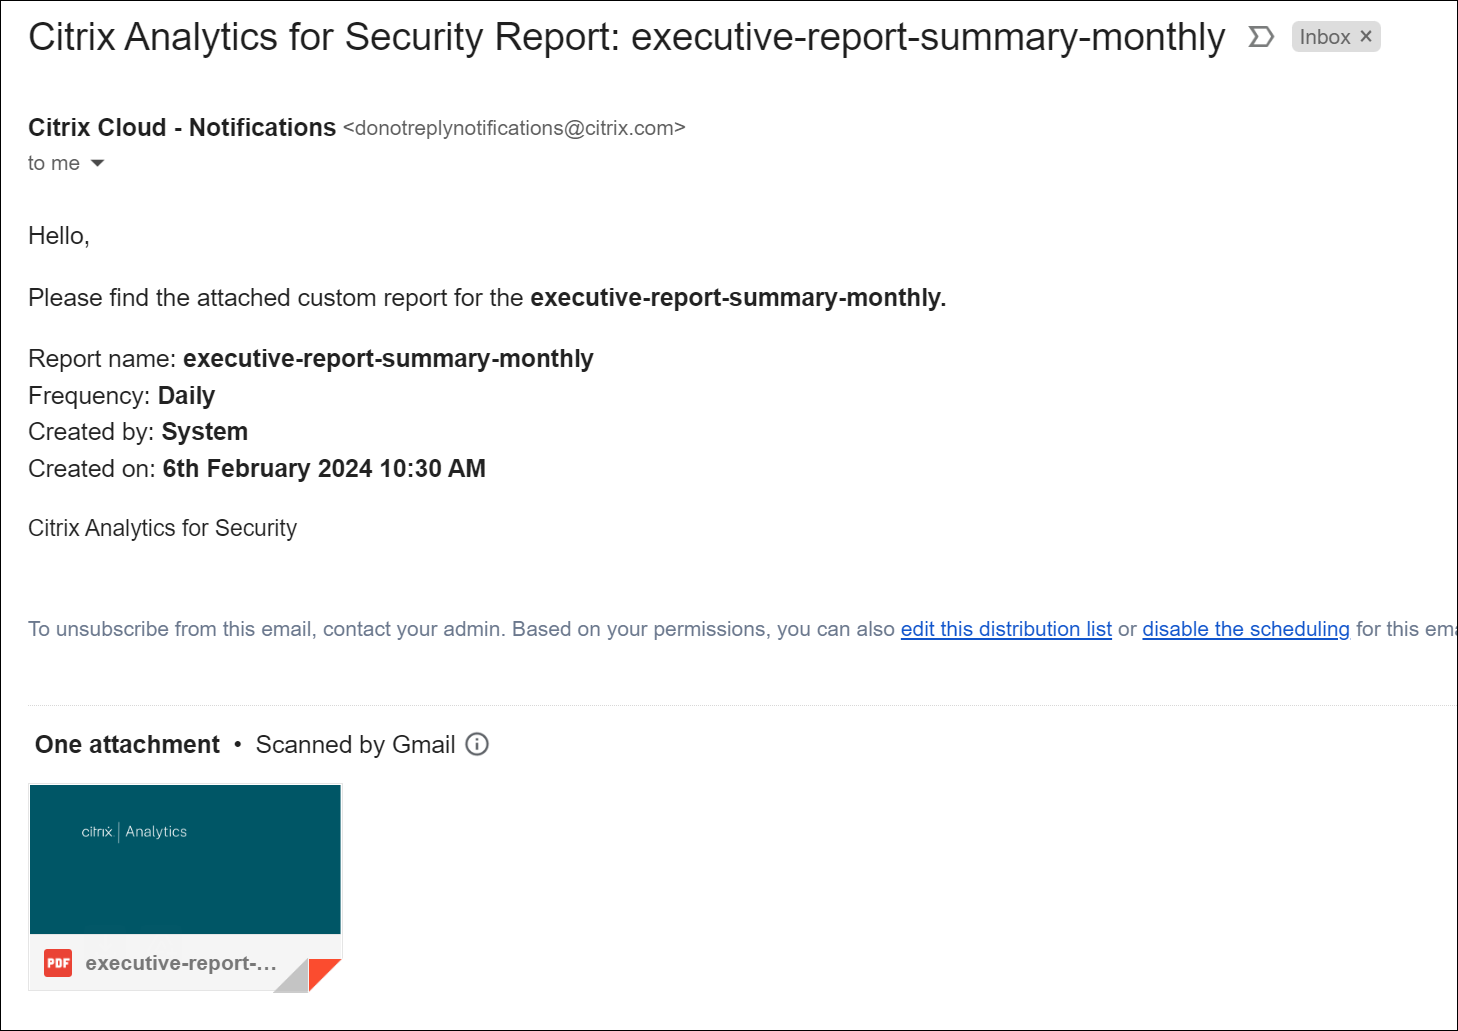
Alternatively, you can export the executive report as a PDF using the Export symbol.
 The following screenshot depicts a sample PDF output: