Citrix Analytics workbook for Microsoft Sentinel
Note
This feature is in preview.
This article describes the Citrix Analytics workbook that is available in your Microsoft Sentinel workspace.
Prerequisite
To use the Citrix Analytics workbook, ensure that you have already integrated Microsoft Sentinel with Citrix Analytics for Security. For more information, see Microsoft Sentinel integration.
View the Citrix Analytics events
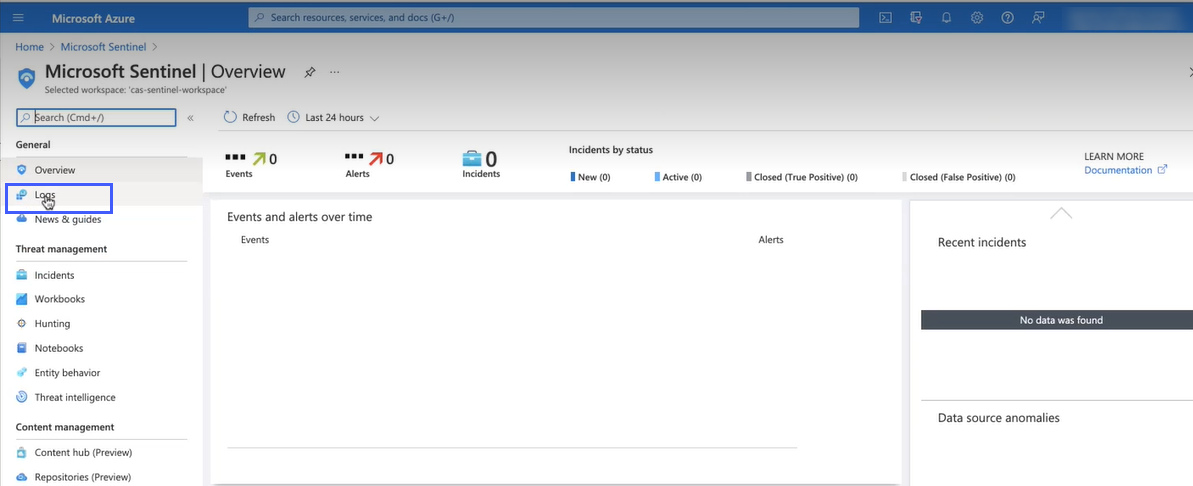
After integrating Citrix Analytics for Security™ with Microsoft Sentinel, the Logstash connector starts pushing events from Citrix Analytics for Security to the Microsoft Sentinel workspace. On your Azure portal, open the Microsoft Sentinel workspace that you have used for the integration.
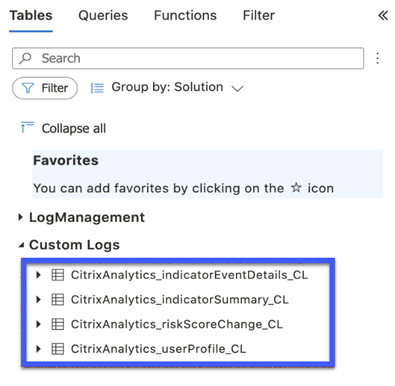
To verify that Microsoft Sentinel is receiving the events from Citrix Analytics for Security, select Logs > Custom Logs.
In the Custom Logs section, you can view the log tables that are created automatically to store the events received from Citrix Analytics for Security. These log tables serve as the source for the dashboards on the Citrix Analytics workbook.
Note
The events sent from Citrix Analytics for Security might take a few hours to appear in the Microsoft Sentinel workspace. So, you might see a delay in the creation of the log tables for the events.
View the Citrix Analytics workbook
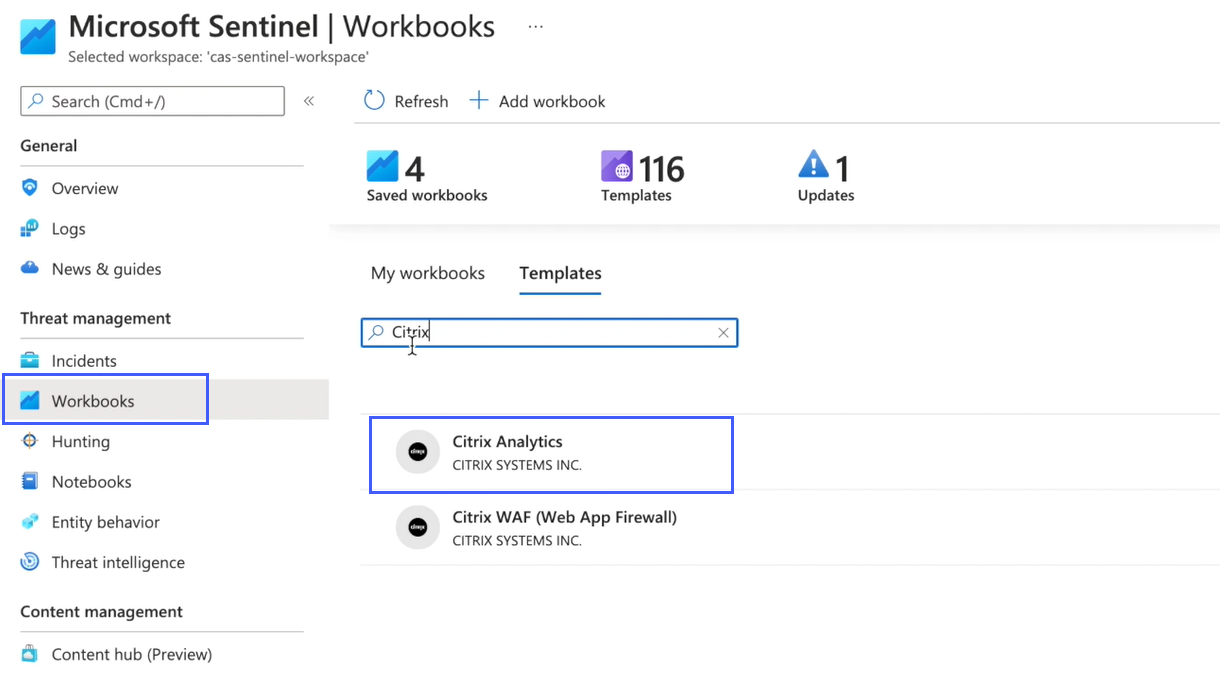
When the log tables are successfully created, do the following:
-
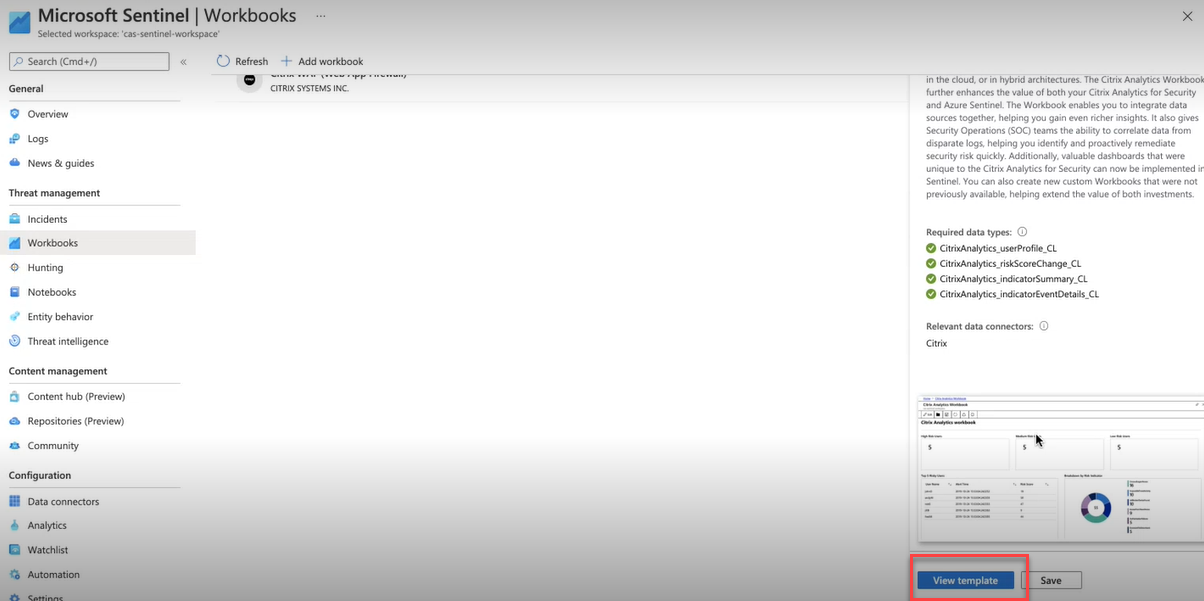
Select Workbooks and search Citrix Analytics. Select Citrix Analytics.
-
Select View Template to open the Citrix Analytics workbook.
In the Citrix Analytics workbook, you can view the user events in the following dashboards:
-
User Risk Scores Overview: Provides a consolidated view of the risky users in your organization.
-
User Details: Provides details of the users and their risky behavior.
-
User Profile: Provides the event metrics associated with the users.
-
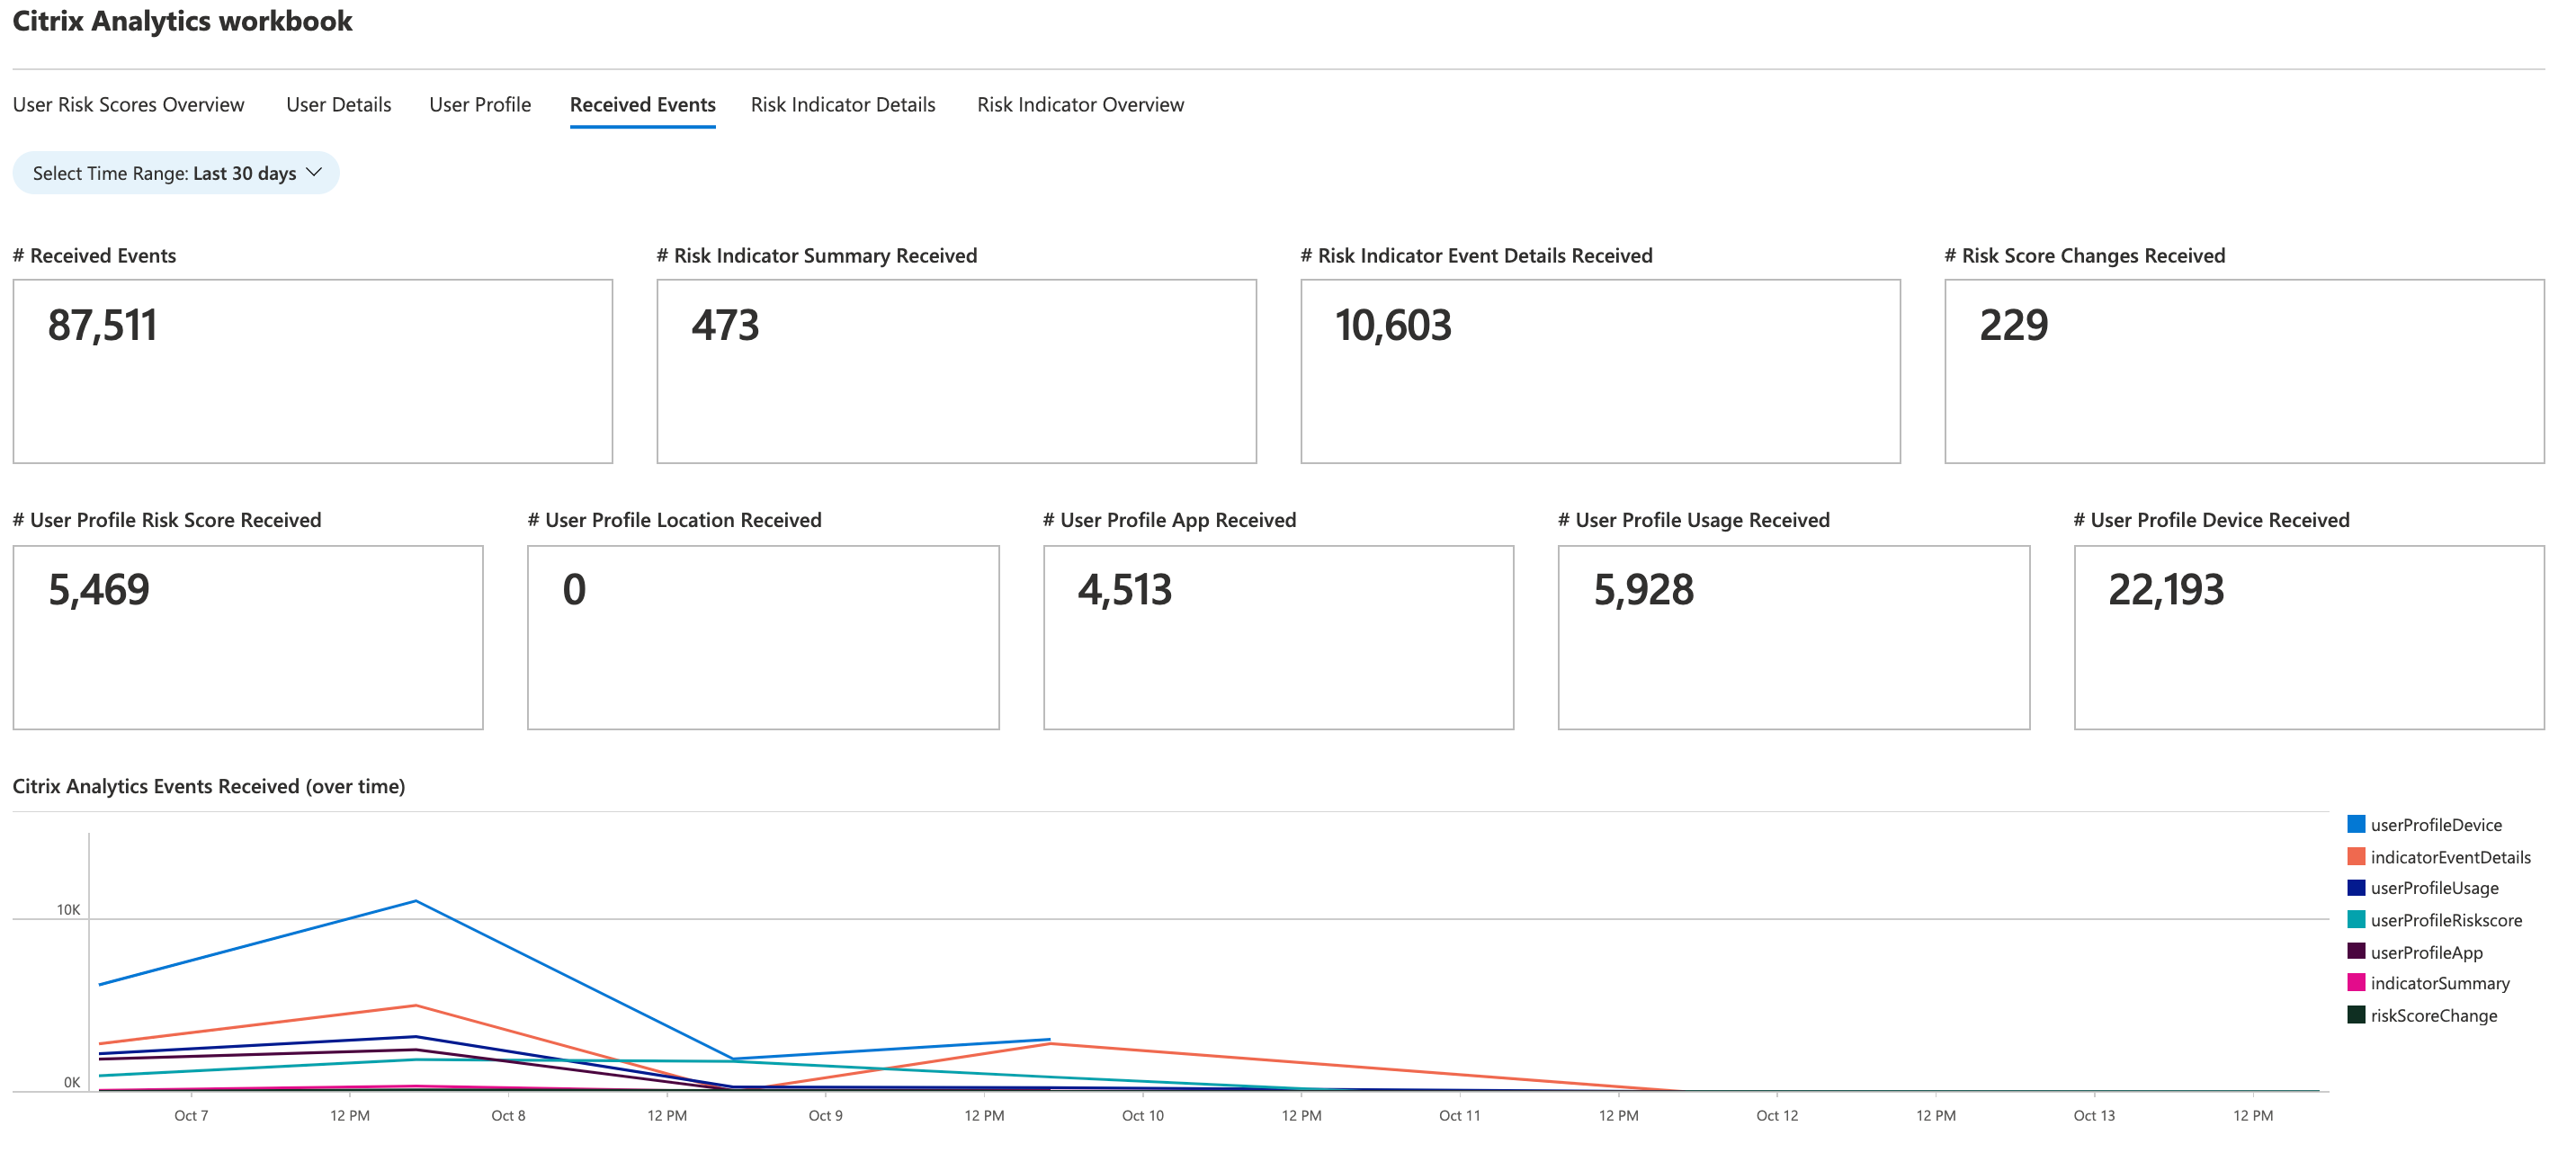
Received Events: Provides the events received from Citrix Analytics for Security.
-
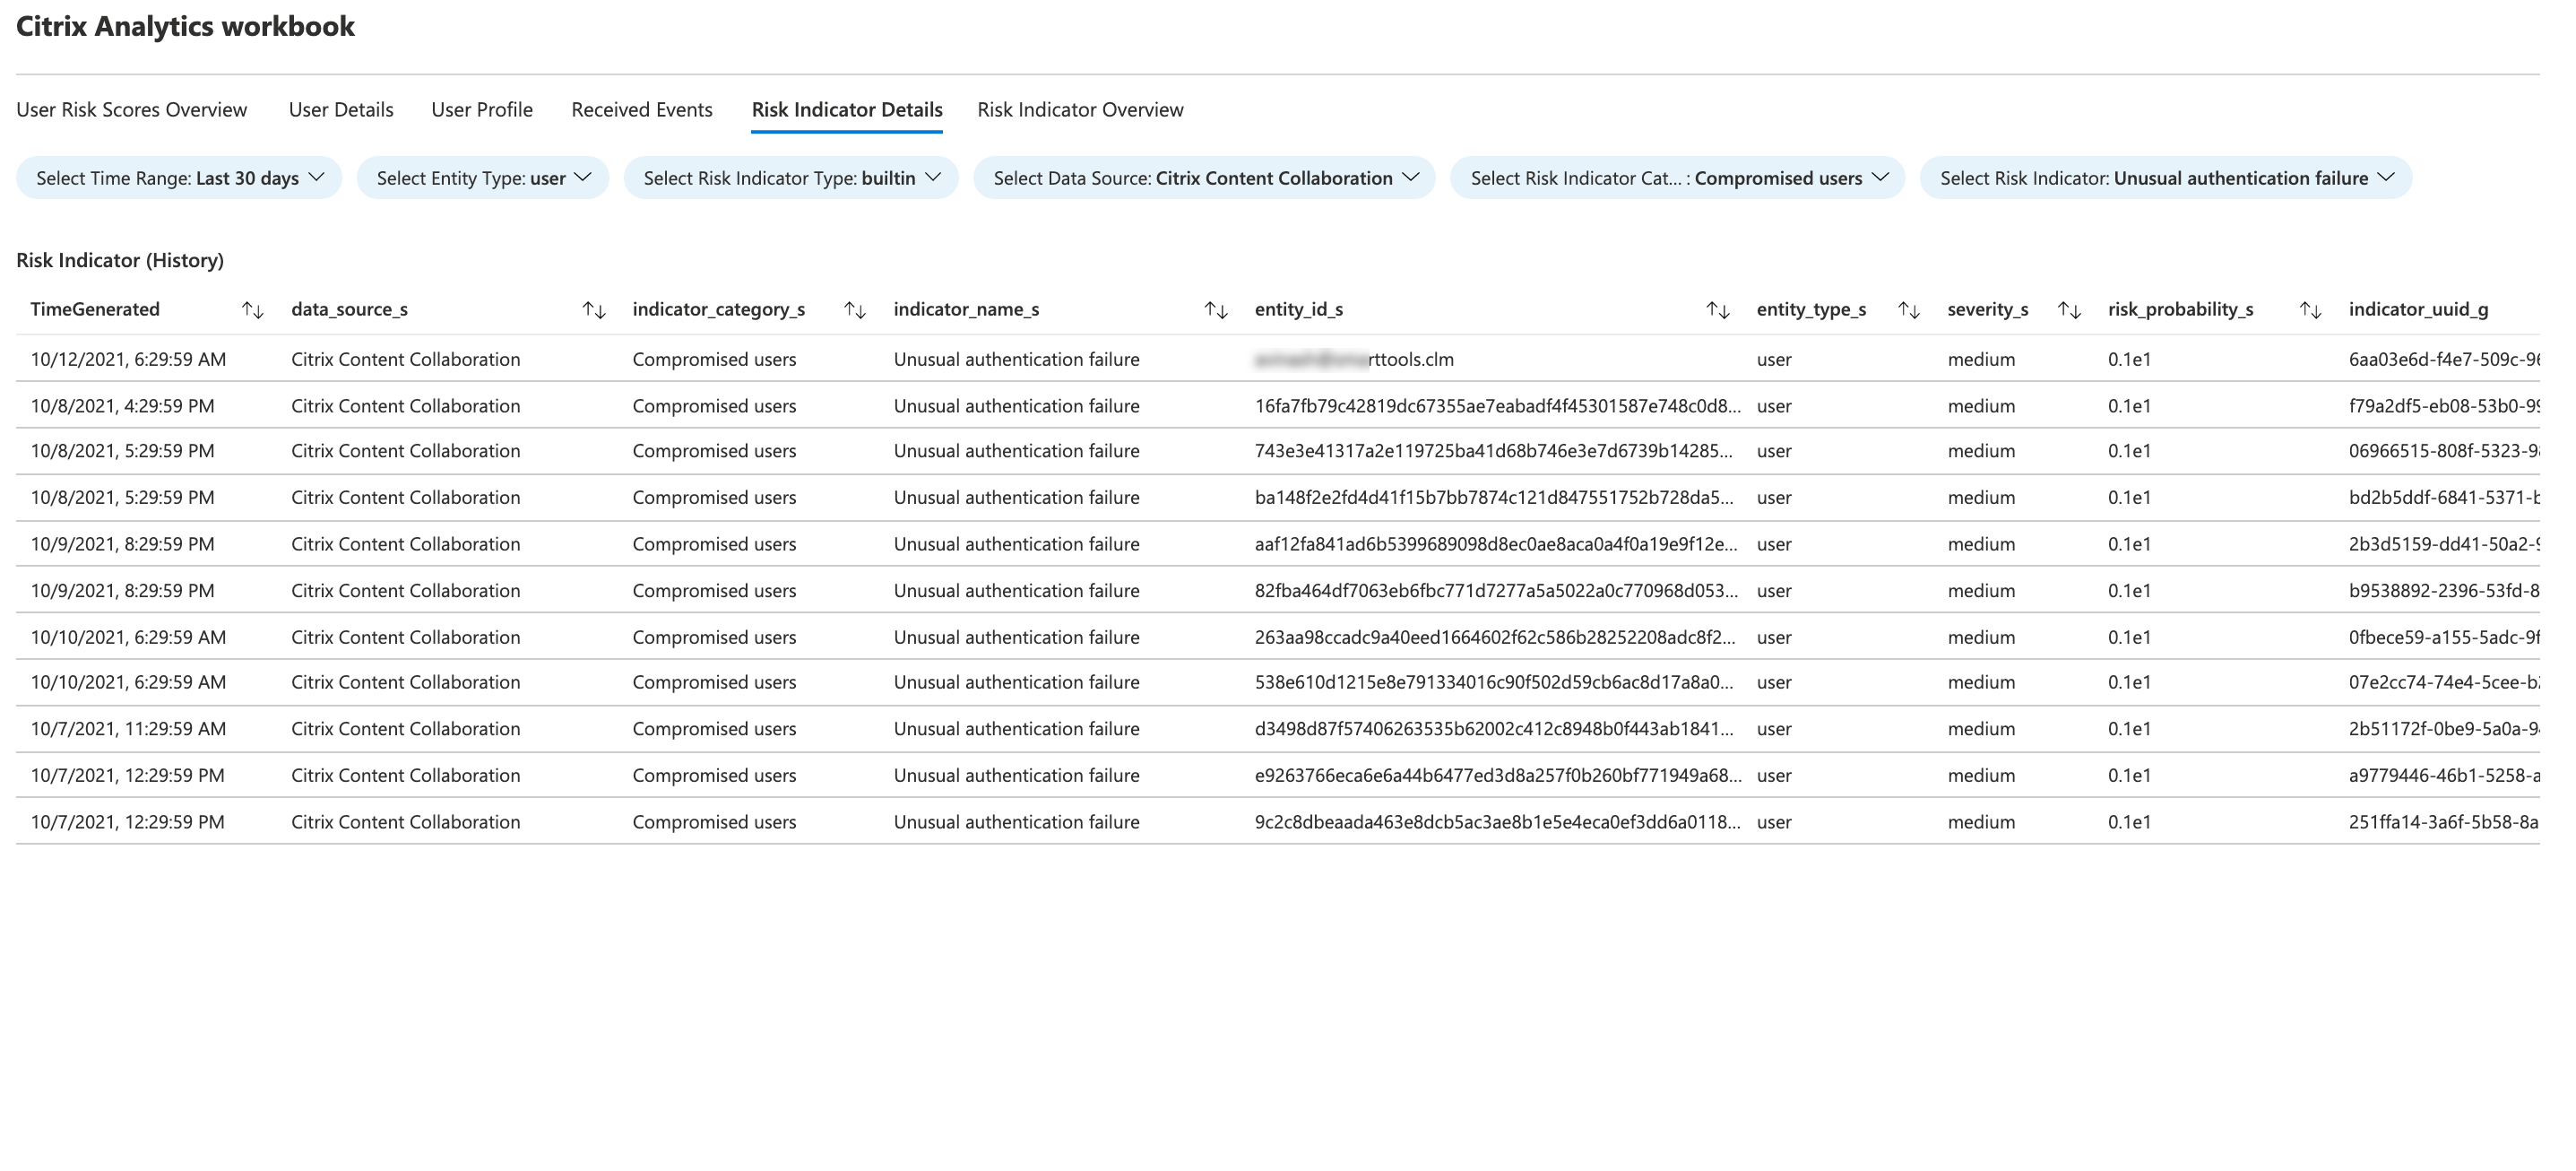
Risk Indicator Details: Provides details about the built-in and custom risk indicators triggered by the users.
-
Risk Indicator Overview: Provides a consolidated view of the risk indicators triggered by the users.

User risk score overview
This dashboard provides a consolidated view of the risky users in your organization. The users are categorized by the risk levels- high, medium, and low. The risk levels are based on the anomalies in the user activities and accordingly a risk score is assigned. For more information about the types of risky users, see the Users dashboard.
Select a time period to view the risky users in your organization.
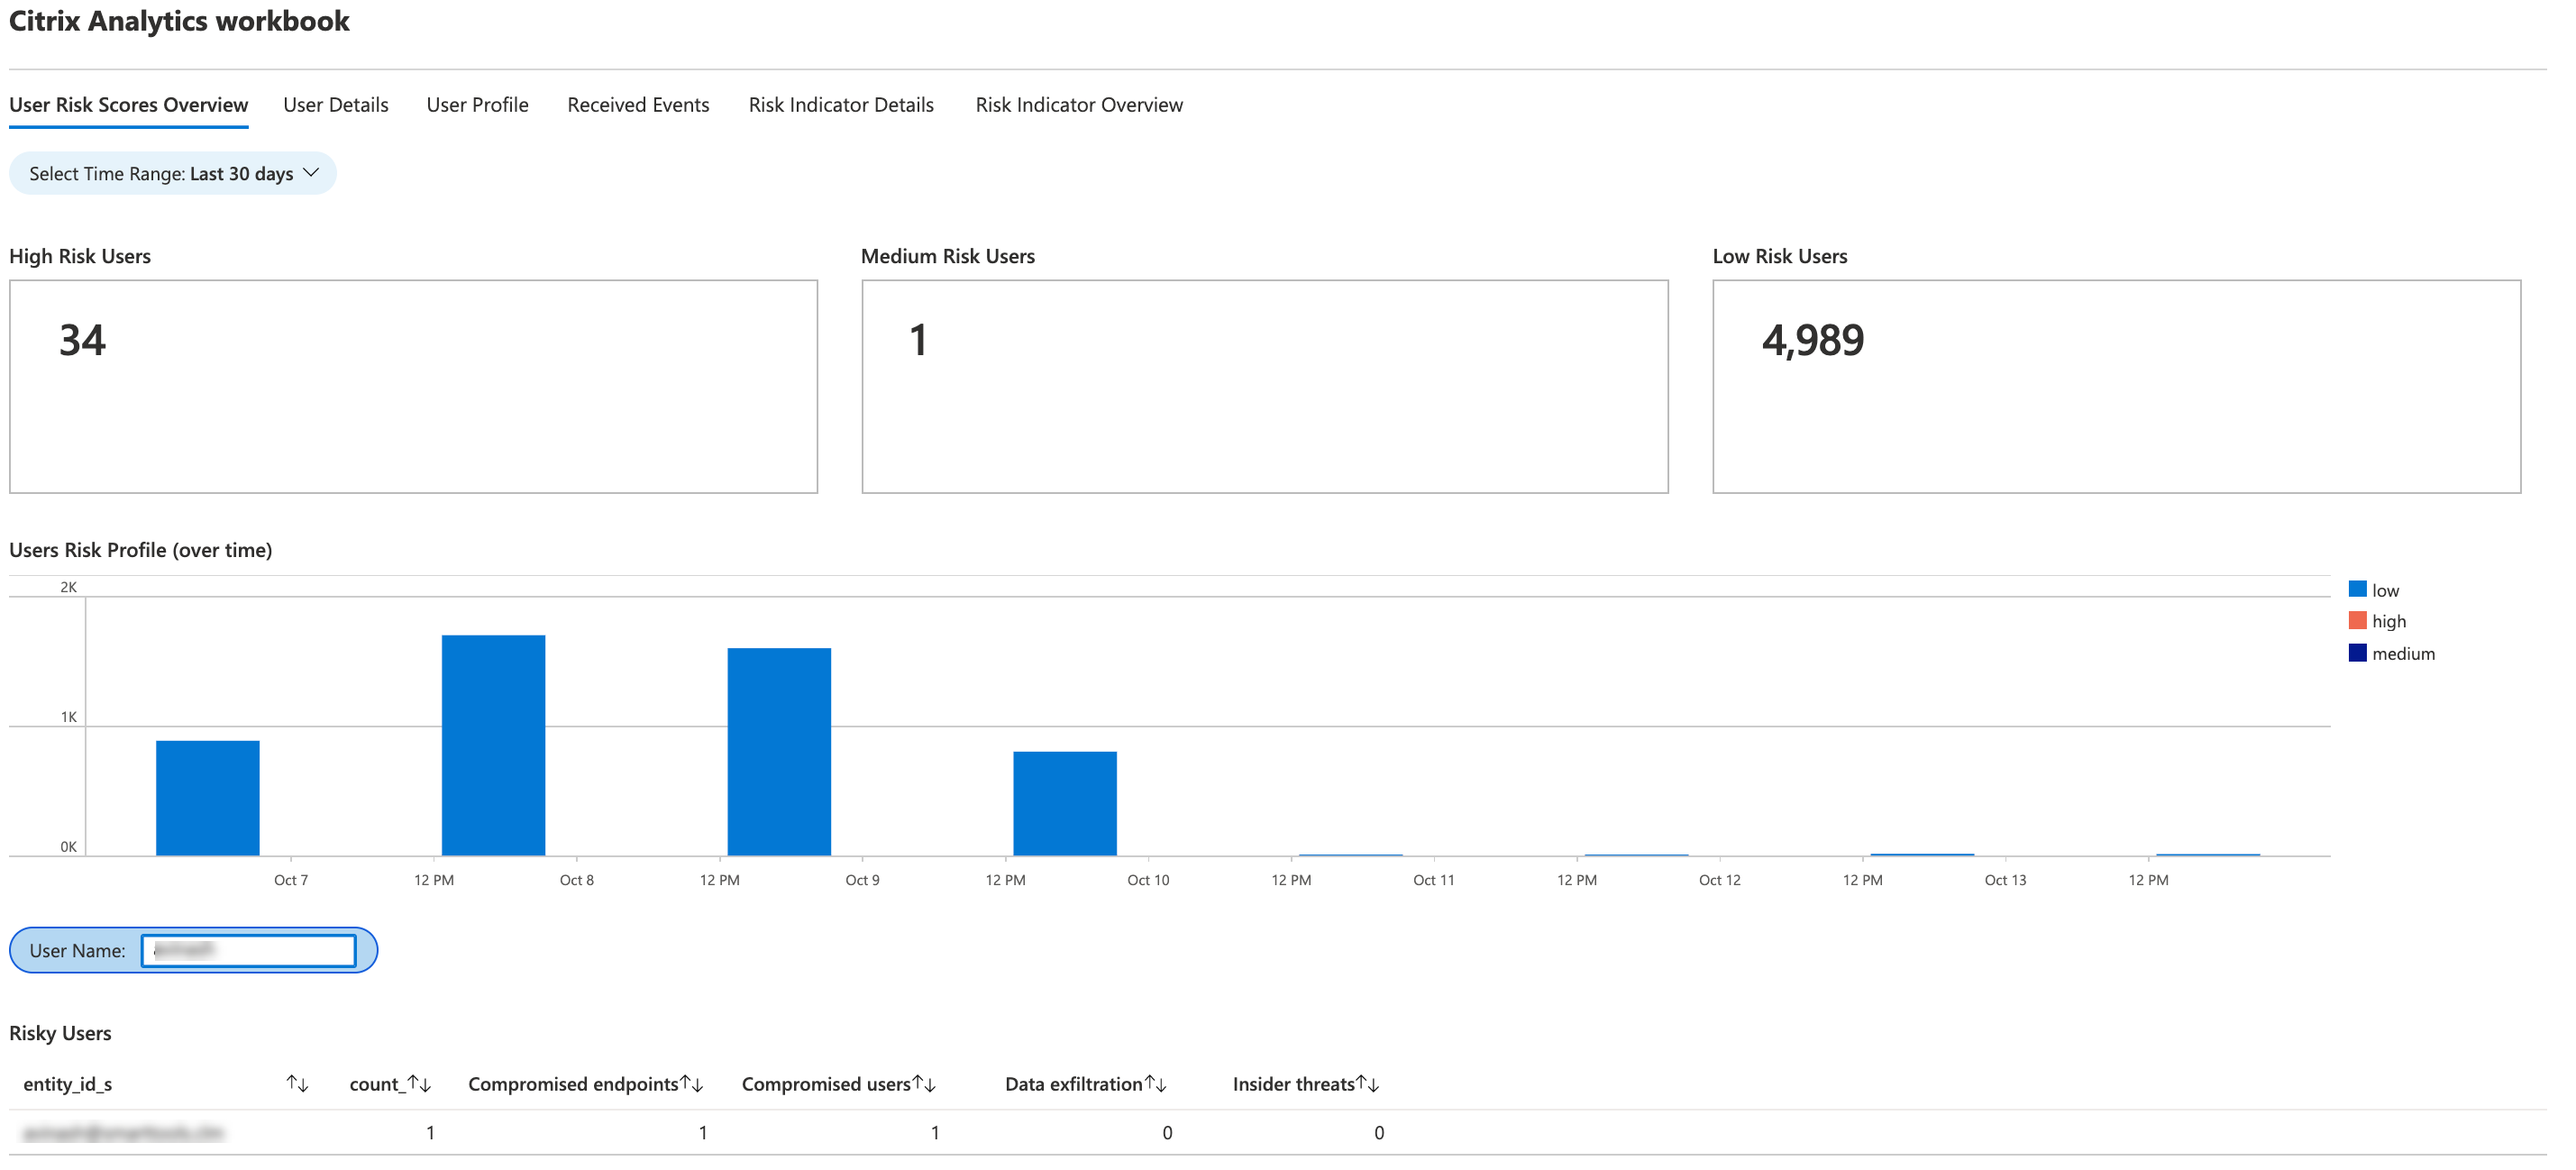
User details
This dashboard provides the risk score and the risk indicators associated with a user.
Search a user and view their risky activities that can pose a threat to your organization. To mitigate the threat, you can take appropriate actions on the user accounts based on their risk severity.
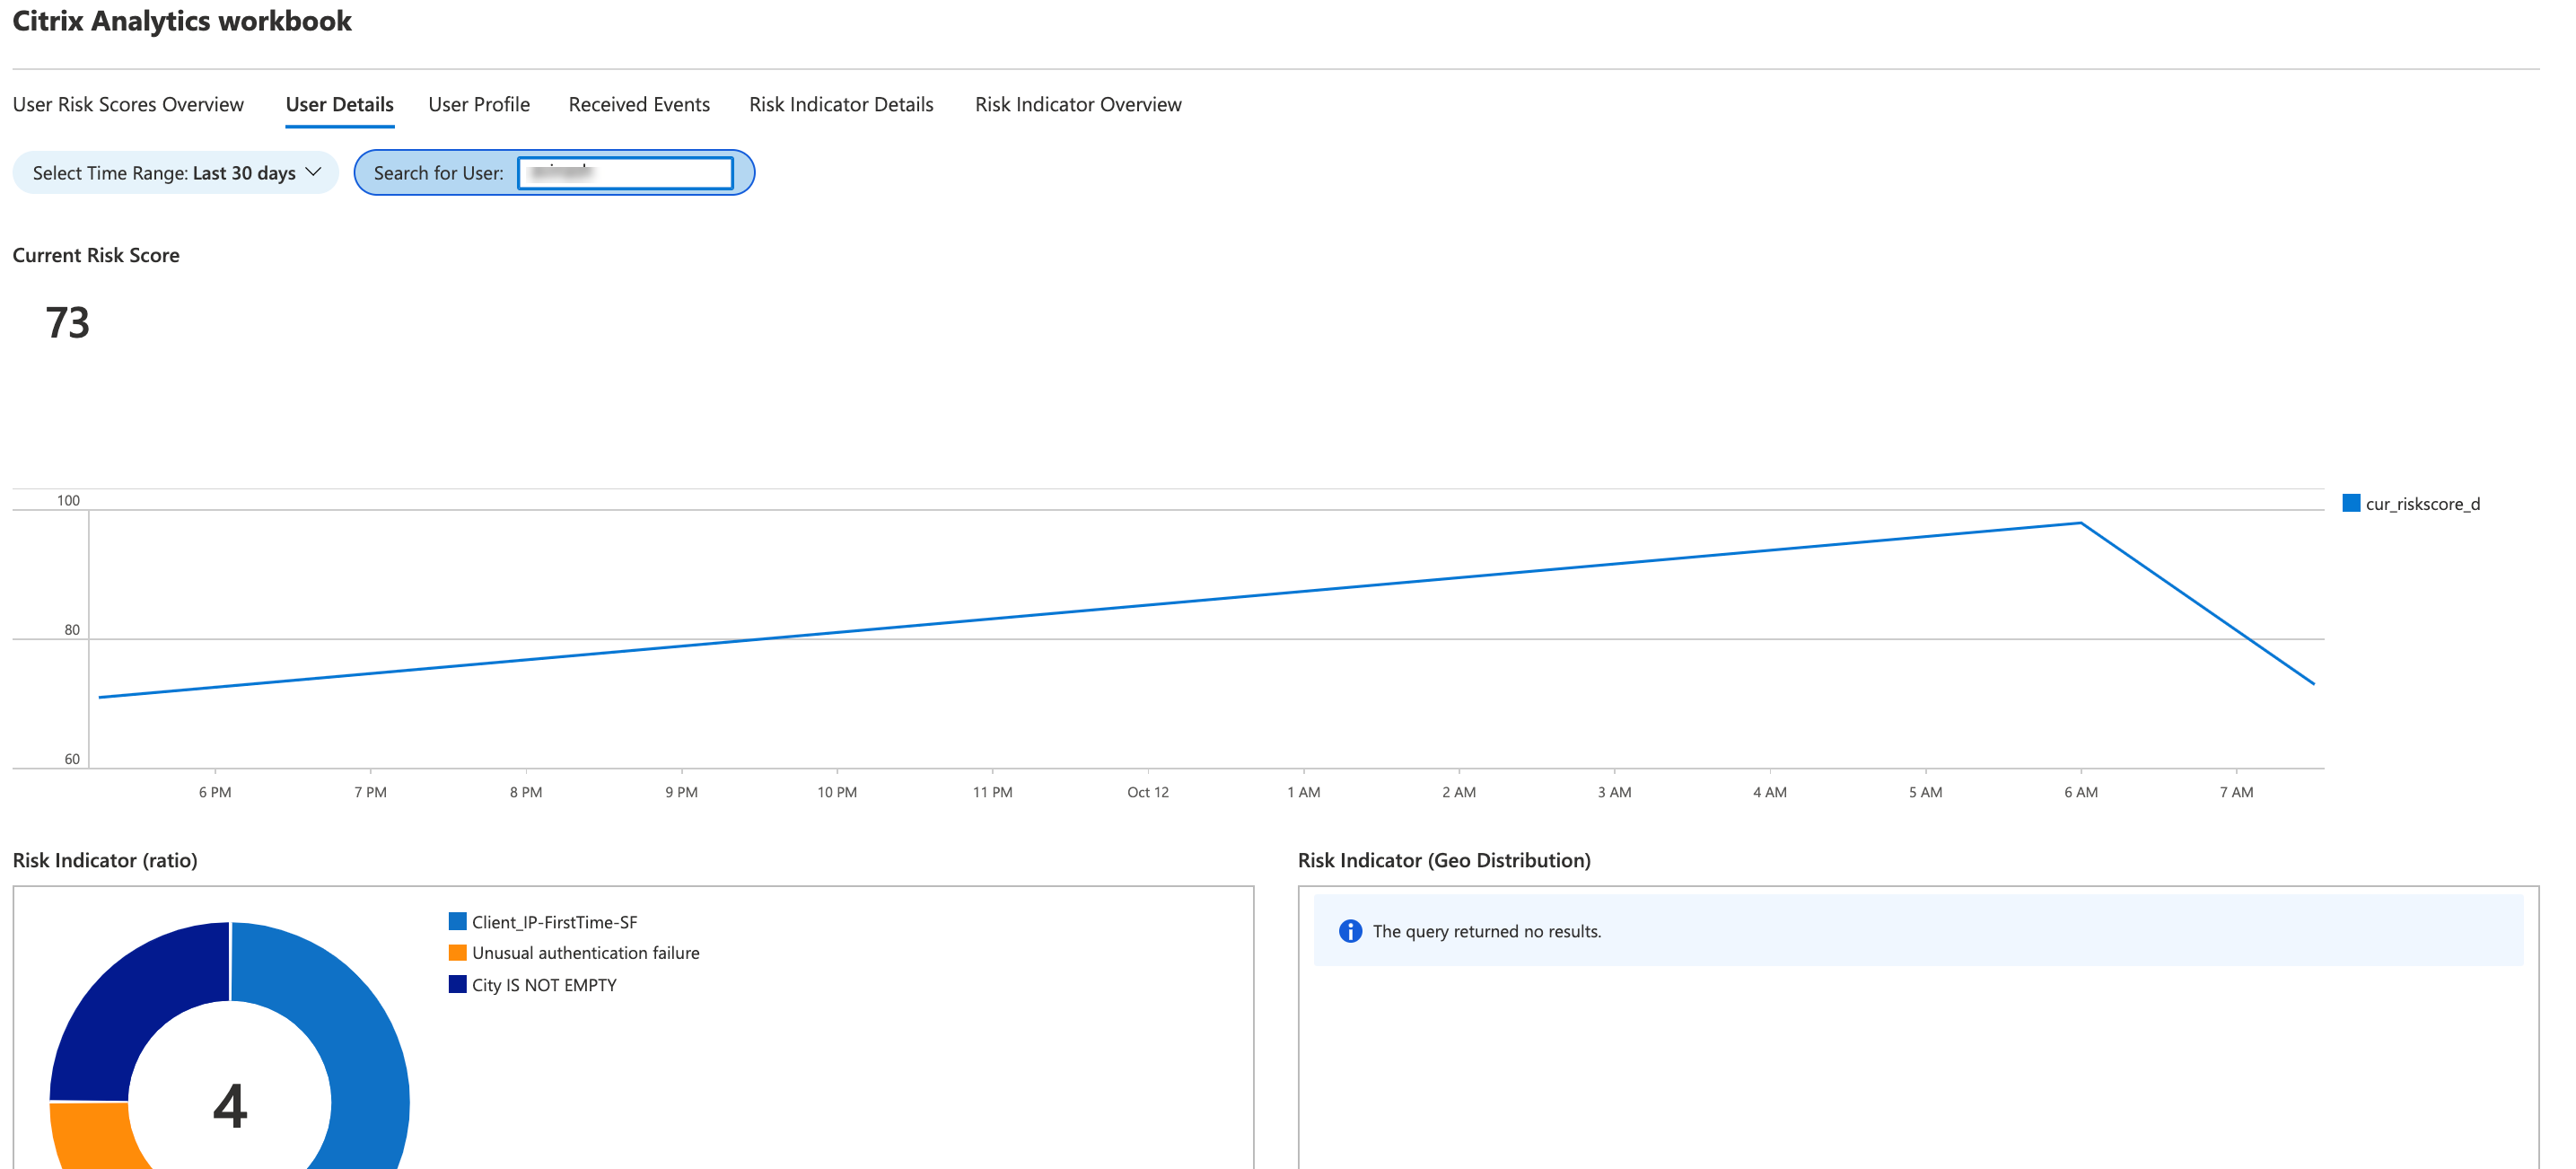
User profile
This dashboard provides the details of the event metrics associated with your users for a selected time period. The metrics provide insights into the user activities such as:
-
Top 10 applications used by the users
-
Top 10 devices used by the users
-
Top 10 locations from where the users have logged on
Using the reports, you can:
-
Identify the usage trend of your users
-
Discover the non-compliant devices that are used to access the resources
-
Check for any potential risky accesses from your users
Received events
For a selected time period, you can view the total number of events received from Citrix Analytics for Security. The total received events include the following:
-
Risk indicator summary: Indicates the events associated with the user risk indicators’ summary. For information on various risk indicator summary events, see Risk indicator schema.
-
Risk indicator event details: Indicates the events associated with user risk indicators’ details. For information on various risk indicator detail events, see Risk indicator schema.
-
User profile risk score: Indicates the events associated with users’ risk score. For information, see Users dashboard.
-
Risk score changes: Indicates the events associated with users’ risk score change. For information, see Users dashboard.
-
User profile locations: Indicates the events associated with the locations from where the users have logged on.
-
User profile app: Indicates the events associated with the applications used by the users.
-
User profile usage: Indicates the events associated with the data usage of the users.
-
User profile device: Indicates the events associated with the devices used by the users.
By reviewing the dashboard at regular intervals, you can ensure if events are properly flowing to your Microsoft Sentinel workspace. Any discrepancy in the total received events might indicate integration issues with Citrix Analytics for Security. You can perform the necessary steps to debug the issues.
Risk indicator details
This dashboard provides the details of the risk indicators triggered by your users.
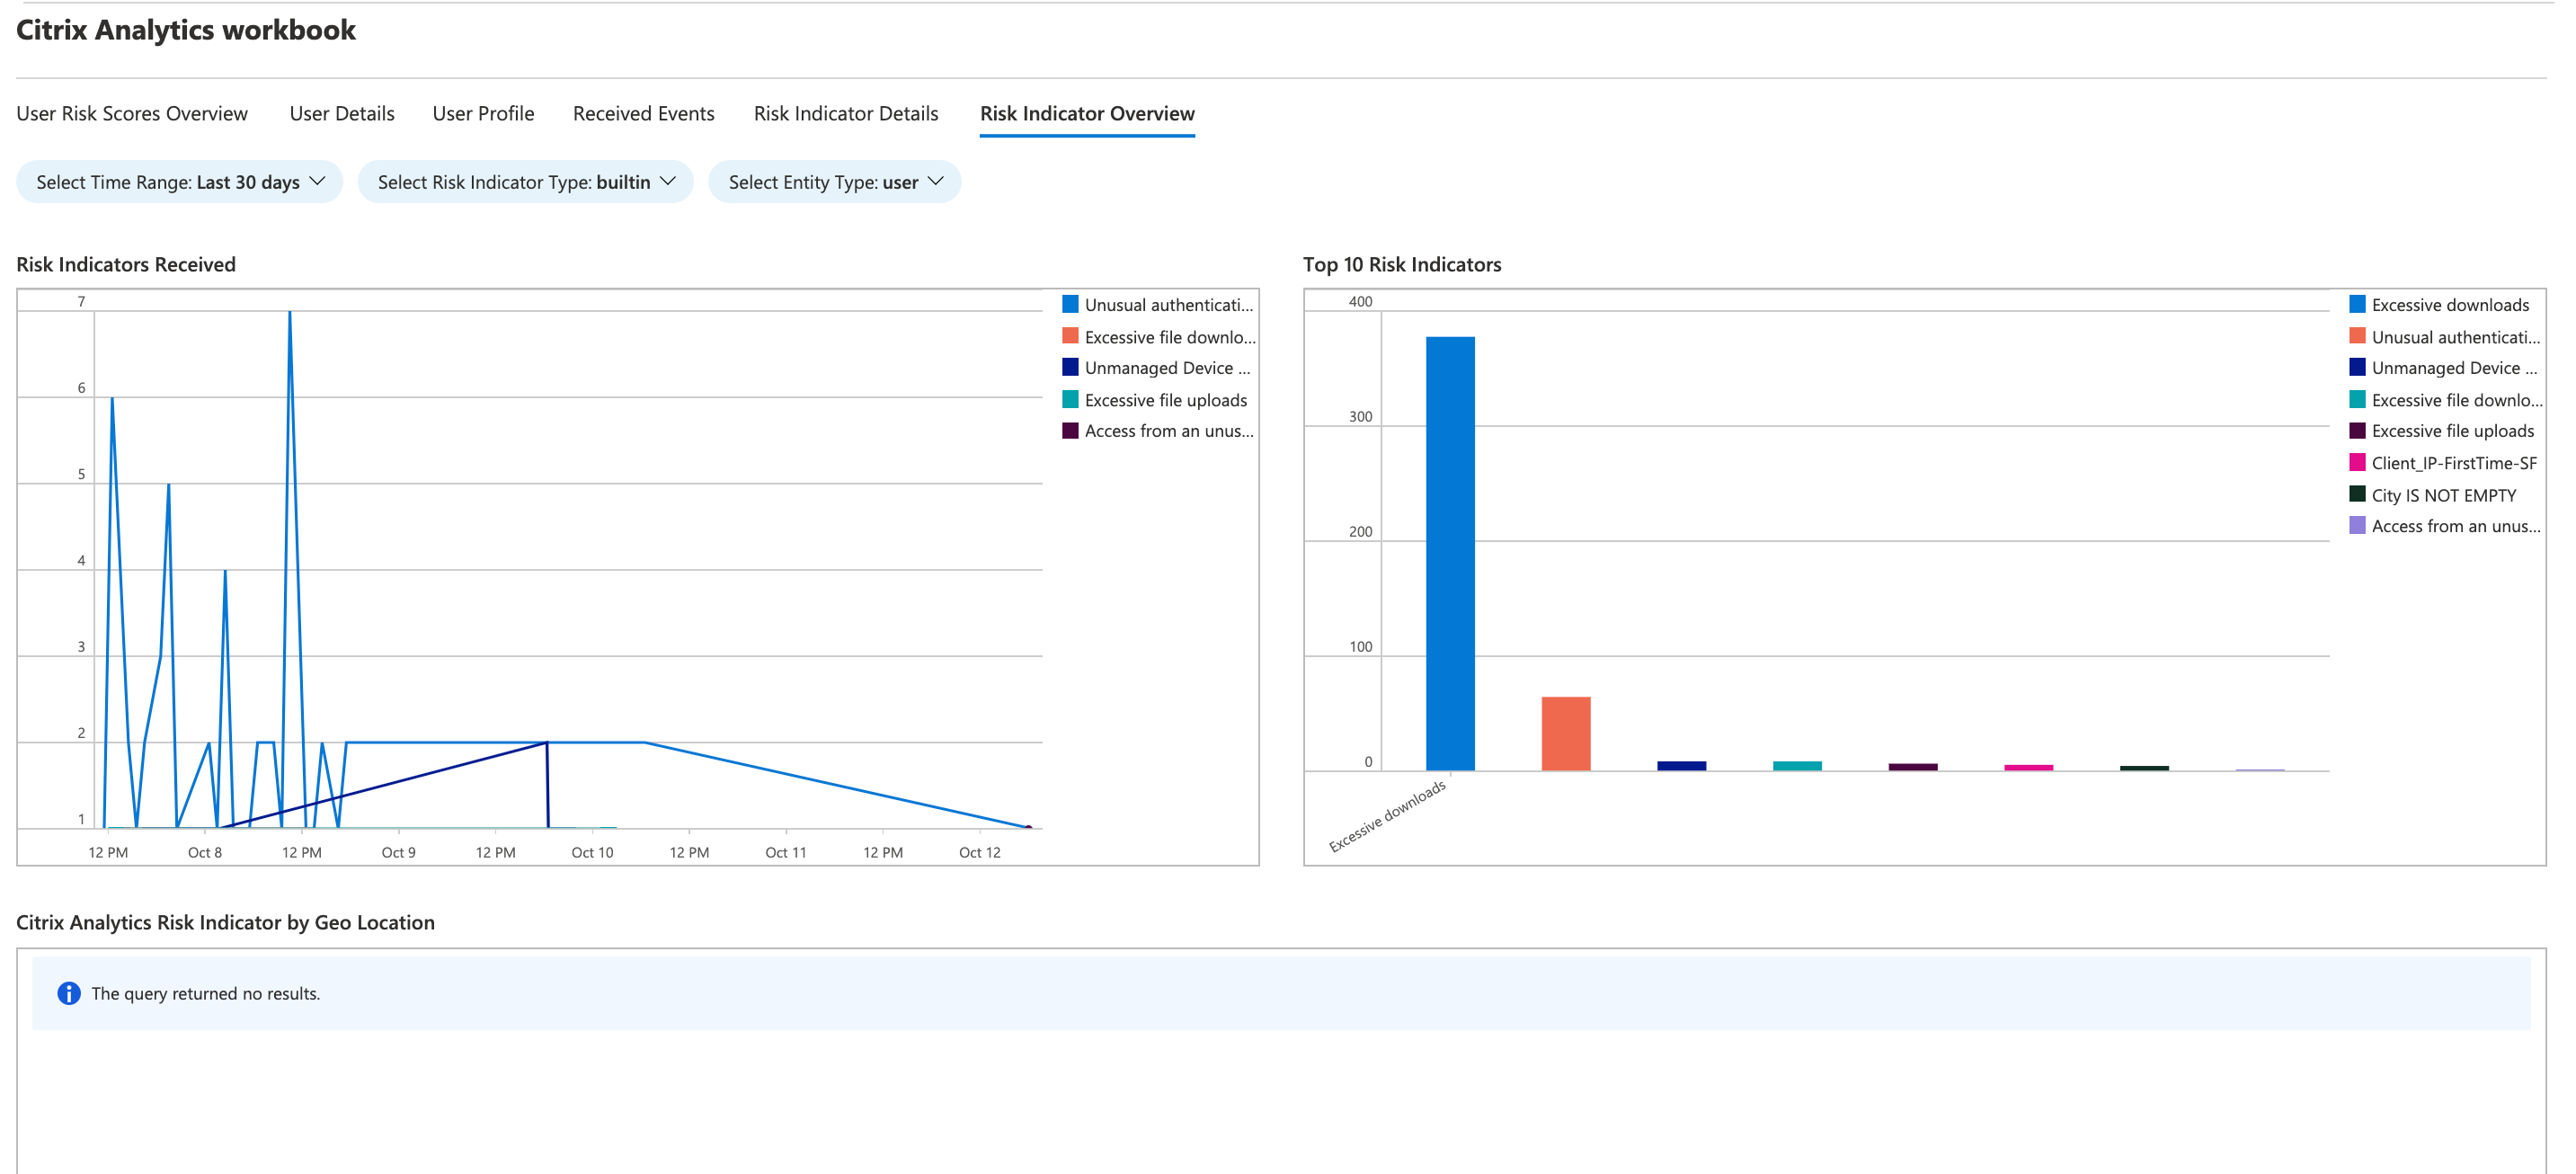
You can view the risk indicator details by selecting one or more categories:
-
Time range: Select a time range to view the details of the risk indicators triggered during the period.
-
Entity type: Select a user to view the details of the associated risk indicators.
-
Risk indicator type: Select either built-in or custom risk indicators to view their details.
-
Data source: Select a data source to view the associated risk indicators.
-
Risk indicator category: Select the risk category to view the associated risk indicators.
-
Risk indicator: Select a risk indicator by name and view its details.
Risk indicator overview
This dashboard provides a consolidated view of all the risk indicators triggered by your users.
You can view the risk indicators by selecting one or more categories: