Citrix Analytics dashboards for Splunk
Note
Attention: Citrix Content Collaboration™ and ShareFile has reached its end of life and is no longer available to users.
This feature is in preview.
Prerequisite
To use the following Citrix Analytics dashboards, ensure that you have already configured and set up Citrix Analytics App for Splunk.
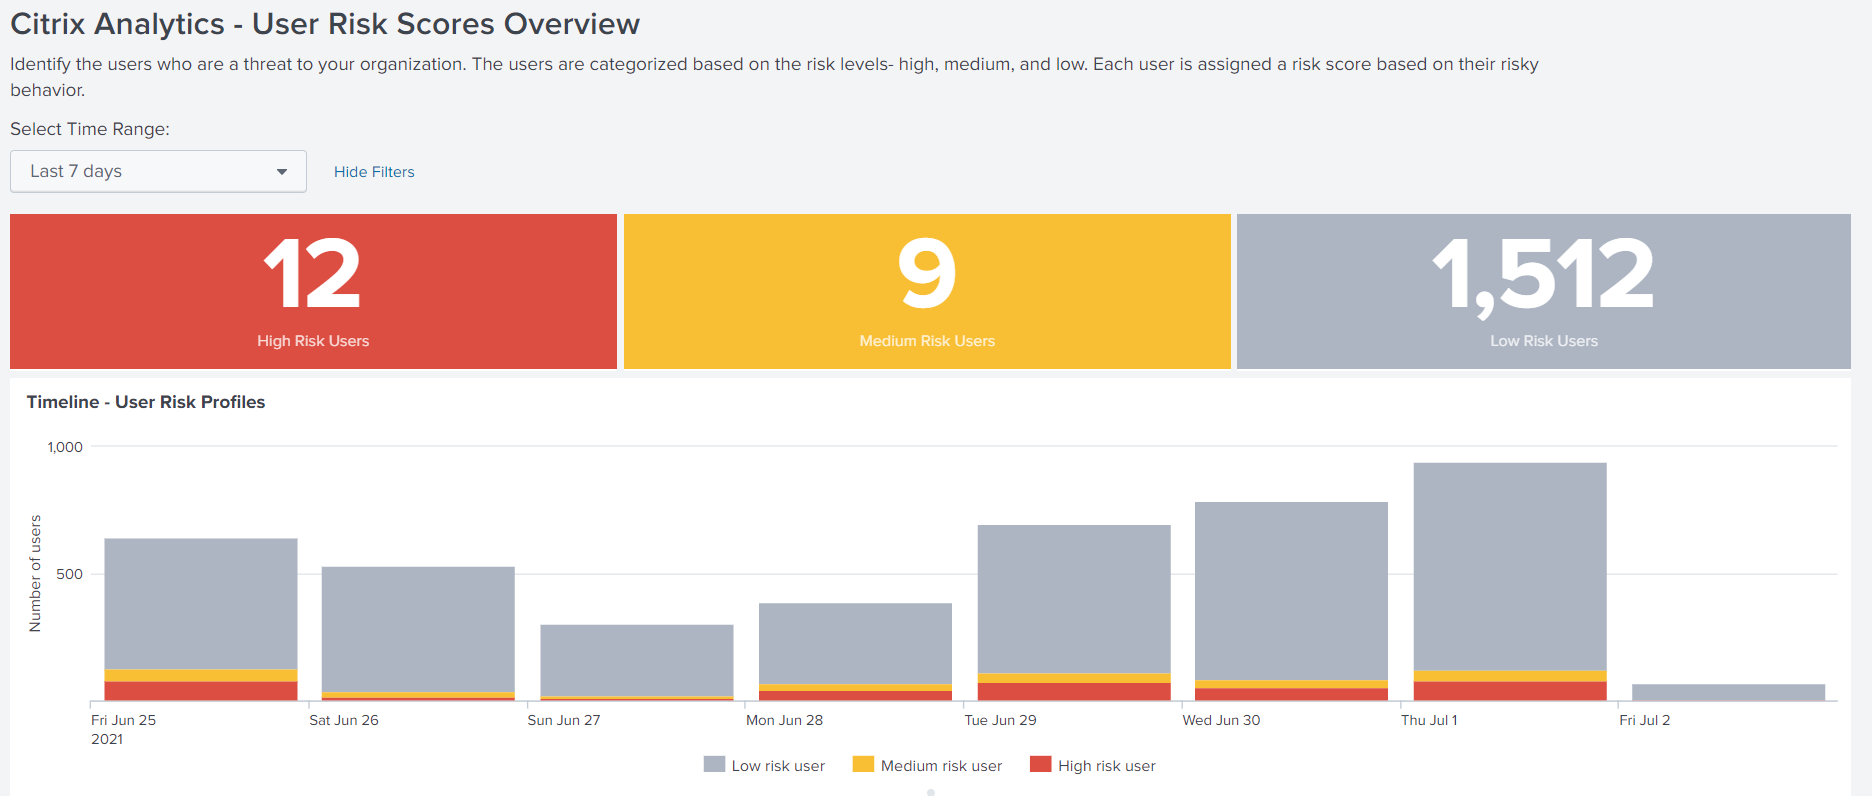
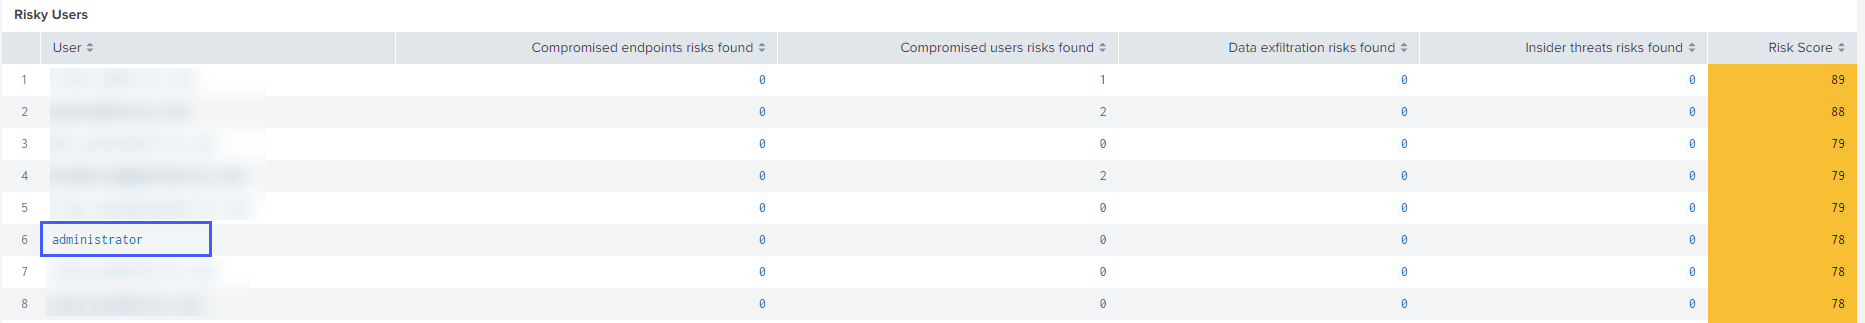
User risk score overview
This dashboard provides a consolidated view of the risky users in your organization. The users are categorized by the risk levels- high, medium, and low. The risk levels are based on the anomalies in the user activities and accordingly a risk score is assigned. For more information about the types of risky users, see the Users dashboard.
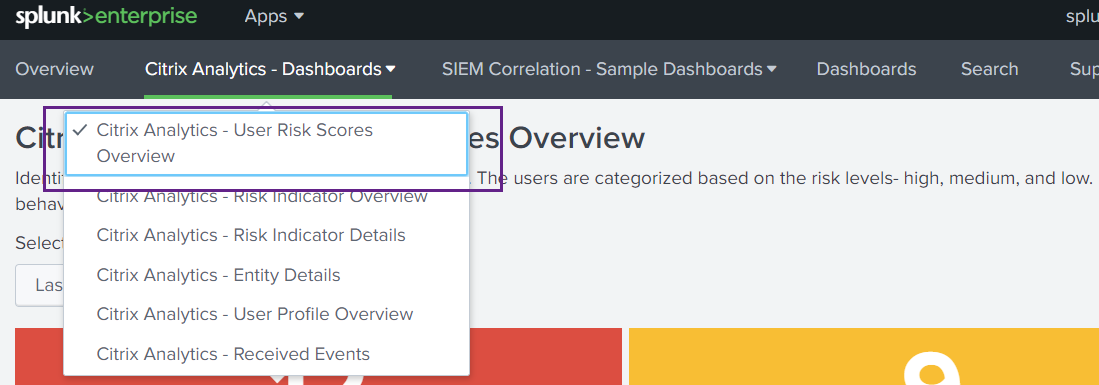
To view this dashboard, click Citrix Analytics- Dashboards > Citrix Analytics- User Risk Scores Overview.
Select a preset time range or a custom time range to view the timeline of the risky users and their details.
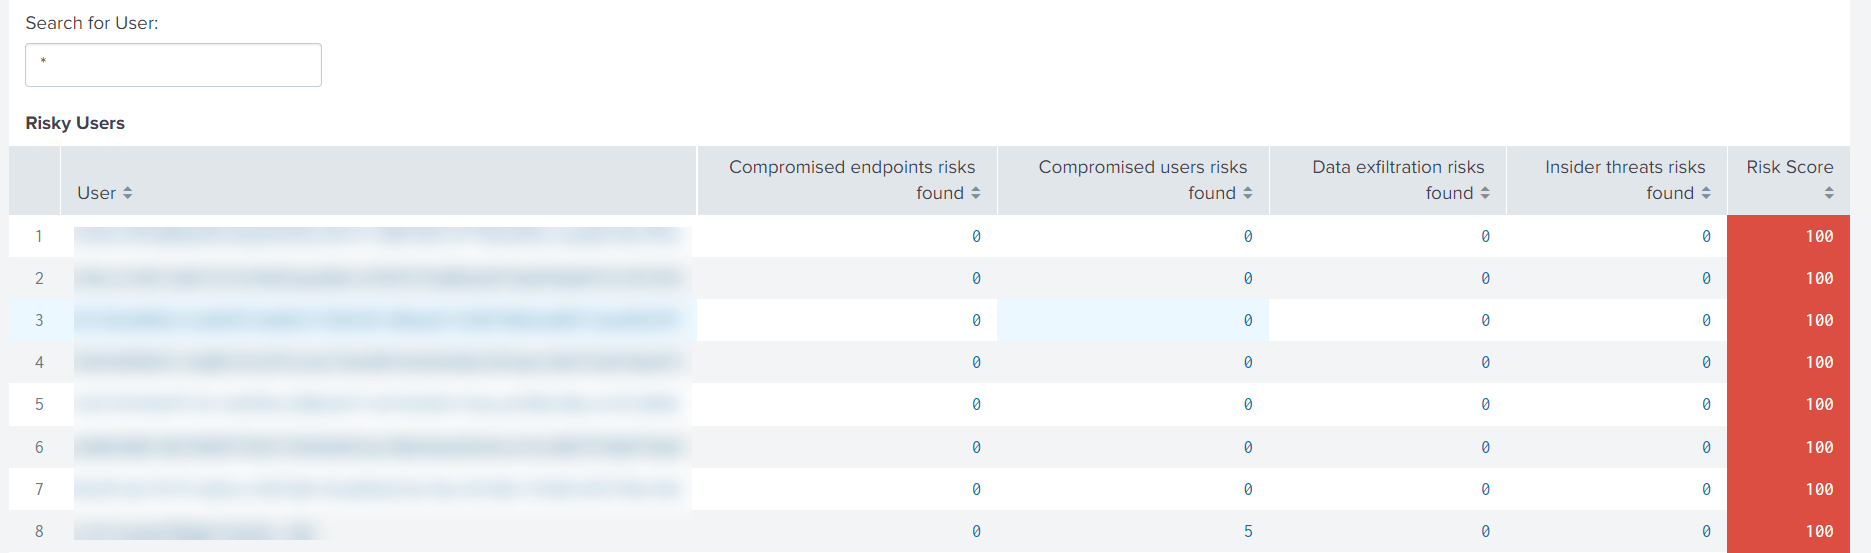
The Risky Users table provides the following information:
-
User: Indicates the user name. Click a user name to view the details about the user’s risky behavior on the Citrix Analytics - Entity Details dashboard.
-
Compromised endpoints risks found: Indicates the number of risk indicators triggered by the user that belongs to the compromised endpoints risk category.
-
Compromised users risks found: Indicates the number of risk indicators triggered by the user that belongs to the compromised users risk category.
-
Data exfiltration risks found: Indicates the number of risk indicators triggered by the user that belongs to the data exfiltration risk category.
-
Insider threats risks found: Indicates the number of risk indicators triggered by the user that belongs to the insider threats risk category.
-
Risk Score: Indicates the risk score of the user.
You can also search a user by the user name and get the required details.
For more information, see risk categories.
Risk indicator overview
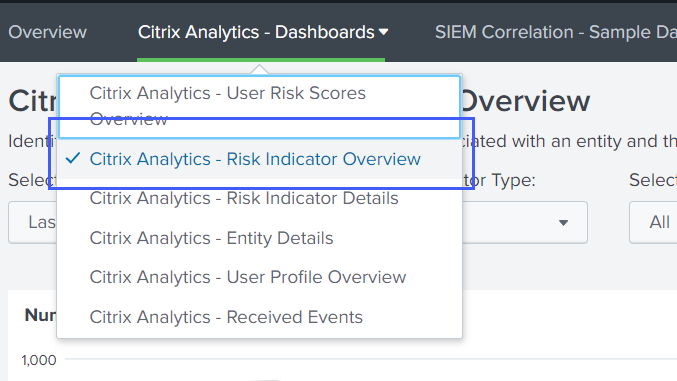
The dashboard provides a consolidated view of the risk indicators triggered by the users in your organization.
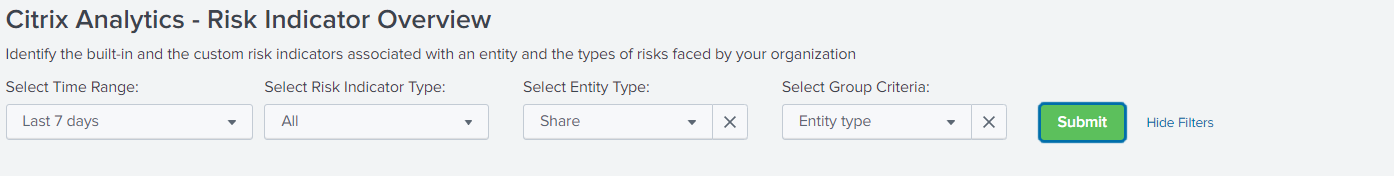
To view the dashboard, click Citrix Analytics- Dashboards > Citrix Analytics- Risk Indicator Overview.
Select category to view report
Search the risk indicators by selecting one or more categories:
-
Time range: Select a preset time range or a custom time range to view the triggered risk indicators for that period.
-
Risk indicator type: Select the type of risk indicator: built-in or custom.
-
Entity type: Select a user to view the associated risk indicators.
-
Group: Select a criteria to group the user events by data source, indicator category, indicator name, indicator type, or entity type and view the associated risk indicators.
View report
Use the following reports to view details about the risk indicators by selecting one or more categories:
-
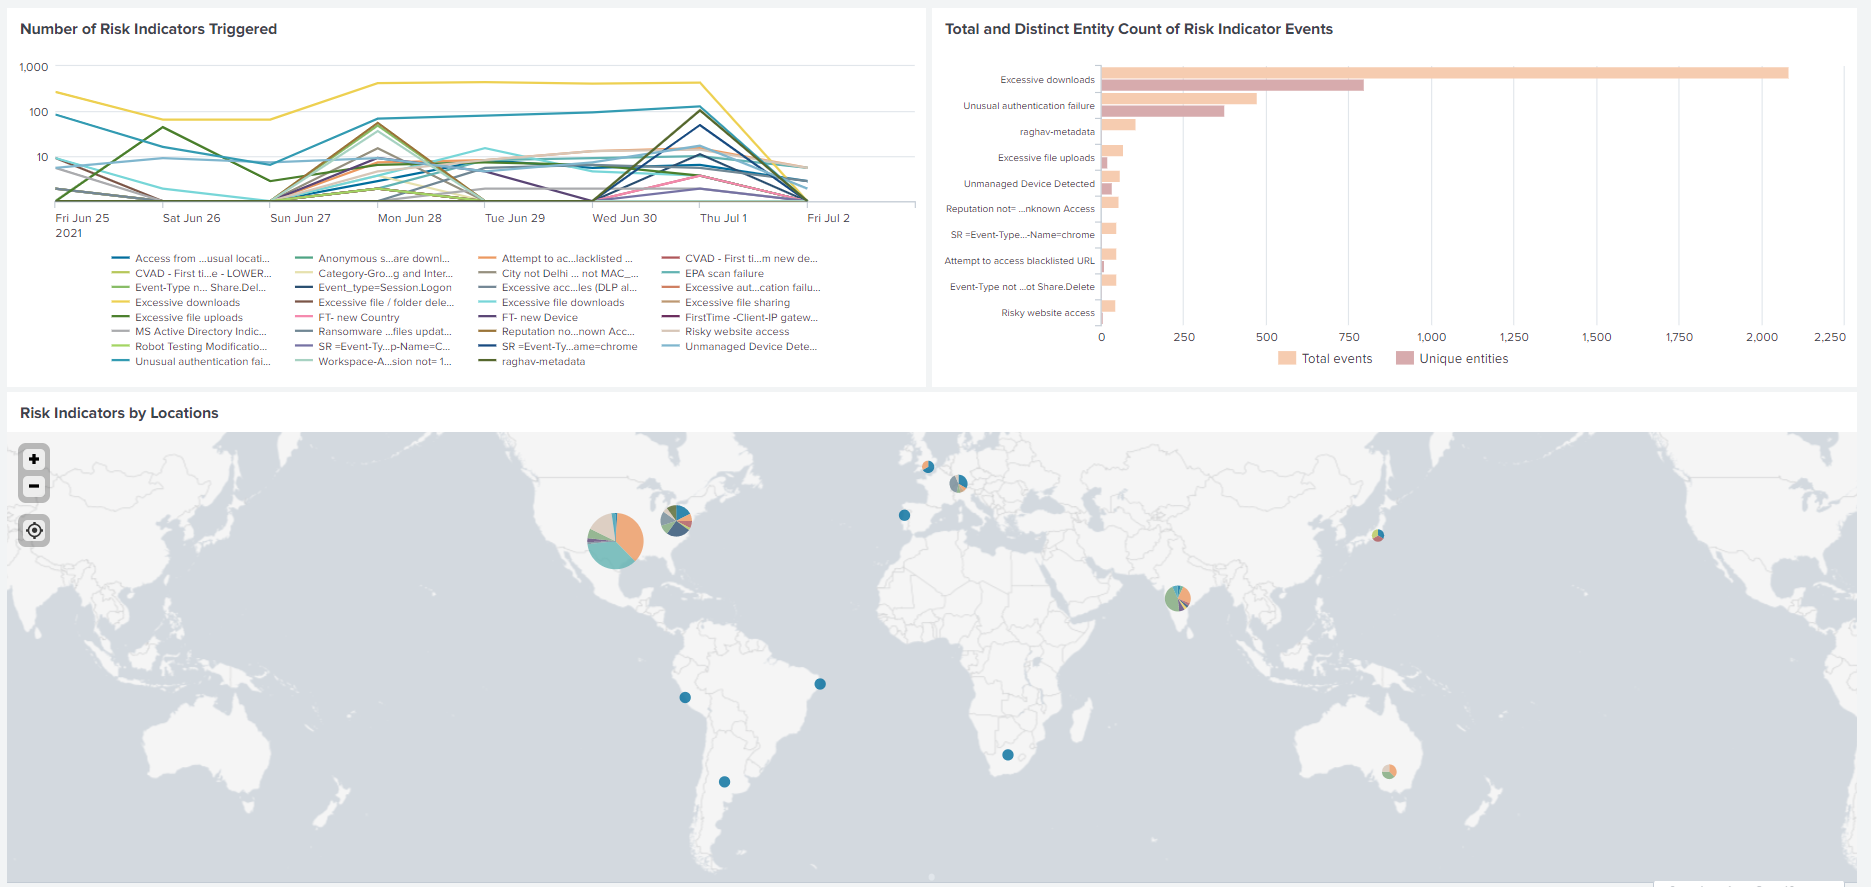
Number of risk indicators triggered: Displays the number of risk indicators triggered for the selected period. Use this report to identify the pattern and areas of risky activities. Also, identify the top risky activities in your organization.
-
Total and distinct entity count of risk indicator events: Displays the total events and the unique events corresponding to a risk indicator. Use this report to identify the occurrences of each risk indicator and the top risk indicators in your organization. You can also identify how many unique users triggered a particular risk indicator and check if the risk indicator is triggered by a larger or a smaller user group.
-
Risk indicators by locations: Displays the number of risk indicators triggered by the users across locations. Use this report to identify the locations that show more risky activities and check if the locations are outside the area of operation of your organization.
-
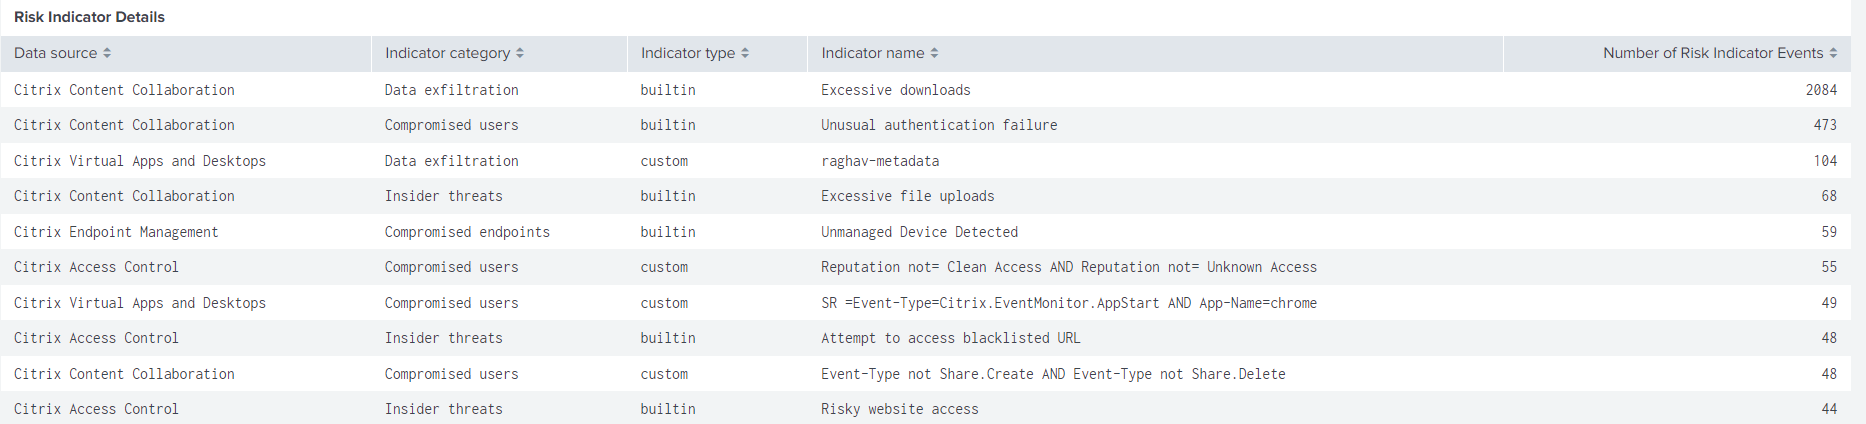
Risk indicator details: Displays the details about the risk indicator such as the associated data source, indicator category, indicator type, and number of occurrences.
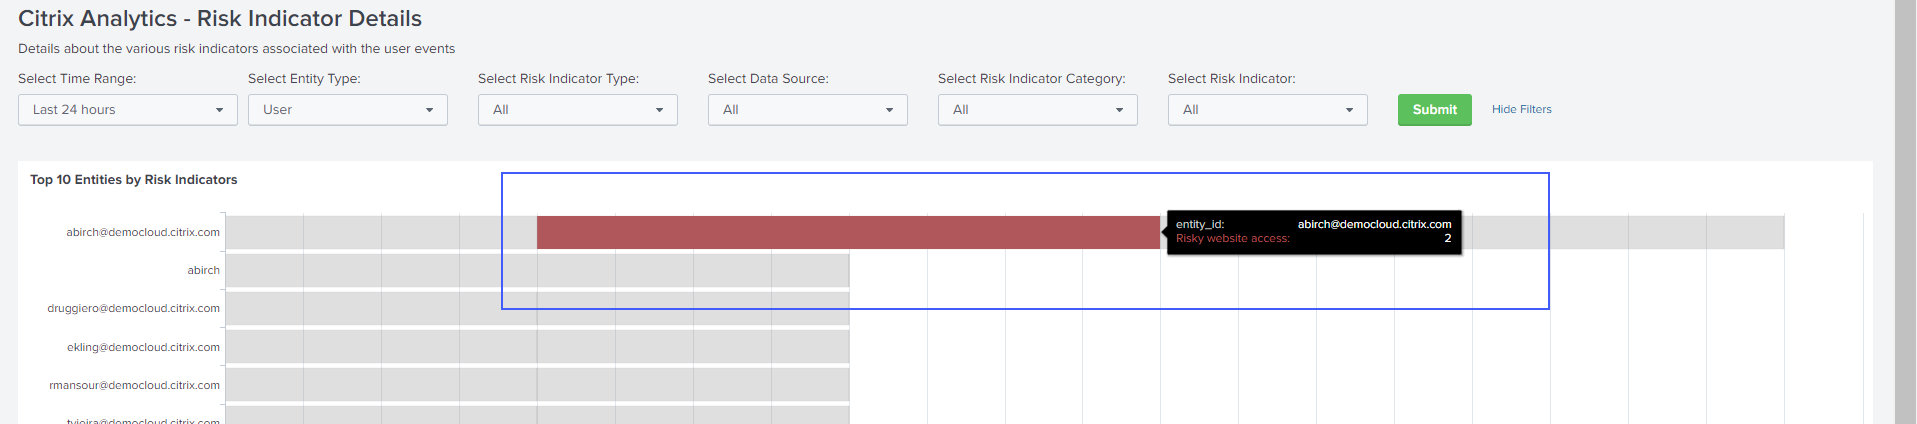
Risk indicator details
The dashboard provides the detailed information about the built-in and custom risk indicators triggered by the users. For more information, see Citrix user risk indicators and Custom risk indicators.
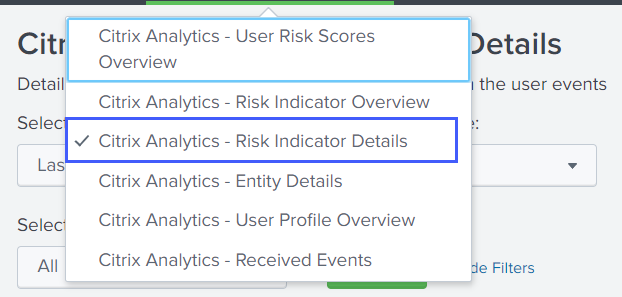
To view the dashboard, click Citrix Analytics- Dashboards > Citrix Analytics- Risk Indicator Details.
Select category to view the reports
View the details of the risk indicators by selecting one or more categories:
-
Time range: Select a preset time range or a custom time range to view the details of the triggered risk indicators for that period.
-
Entity type: Select a user to view the details of the associated risk indicators.
-
Risk Indicator type- Select the type of risk indicator-built-in or custom to view their details.
-
Data source- Select the data source to view the details of the associated risk indicators.
-
Risk indicator category- Select the risk category to view the details of the associated risk indicators.
-
Risk indicator- Select the risk indicator to view its details.
View the reports
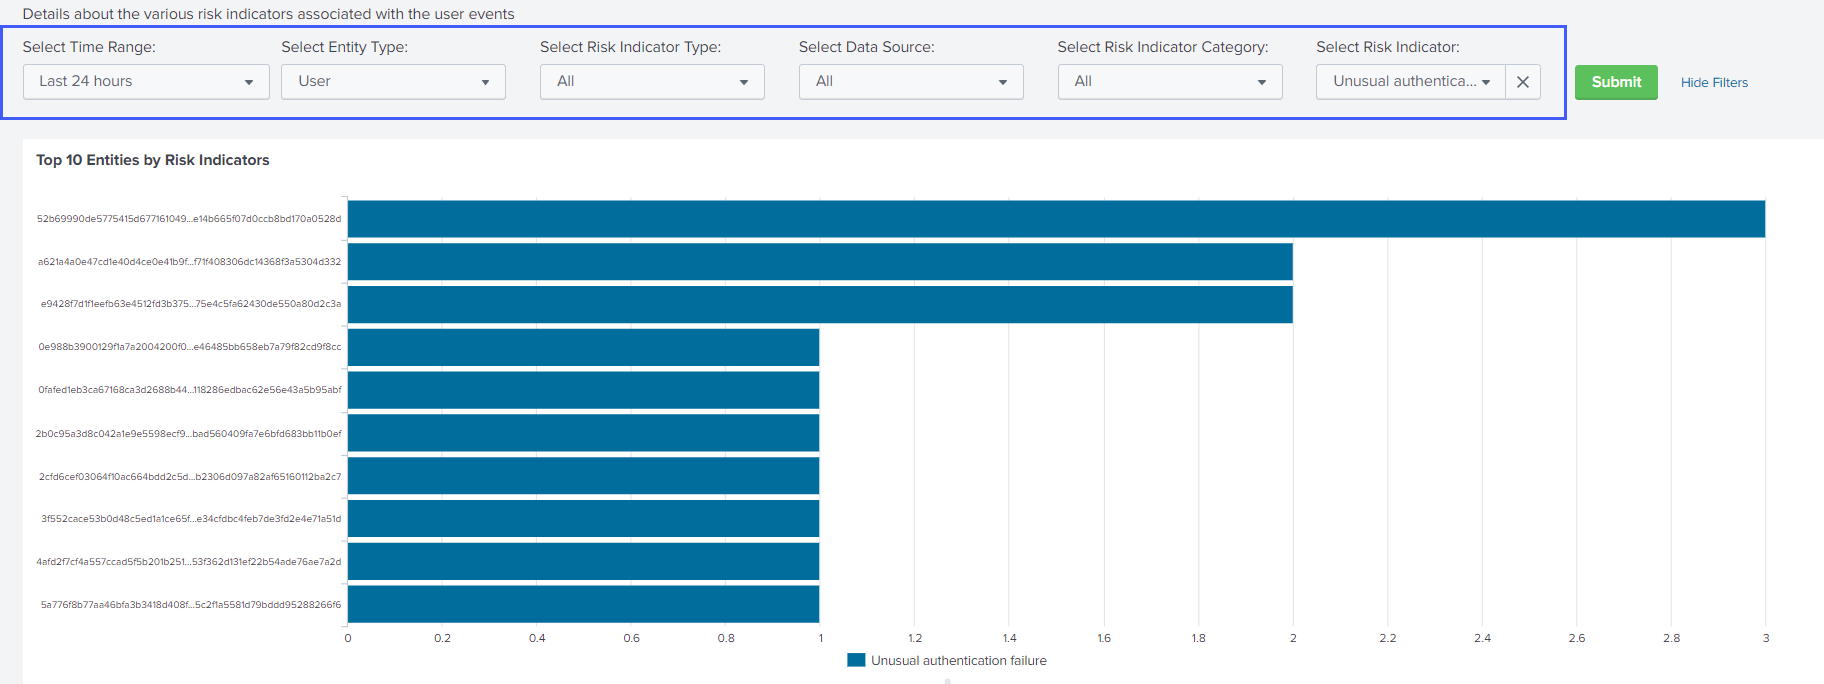
For example, from the Select Risk Indicator list, select Unusual authentication failure (Citrix Content Collaboration), click Submit, and view the following information:
-
Top 10 users associated with the risk indicator
-
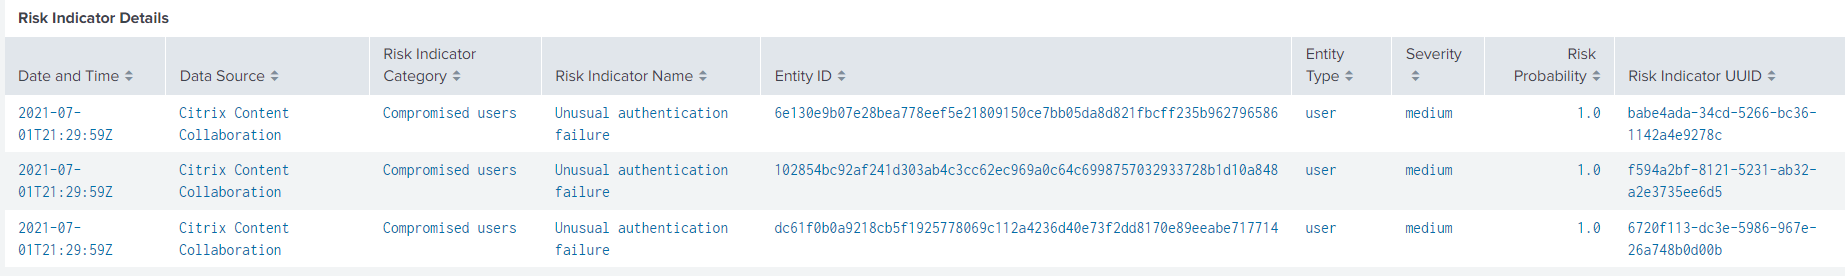
Details about the risk indicator such as
-
Date and time of trigger
-
Associated data source
-
Associated risk category
-
Associated entity ID and user entity type
-
Risk severity-high, medium, or low
-
Risk probability of the user event
-
Unique identity of the risk indicator (UUID)
-
On Top 10 Entities by Risk Indicators, click an entity to view its details on the Citrix Analytics- Entity Details dashboard.
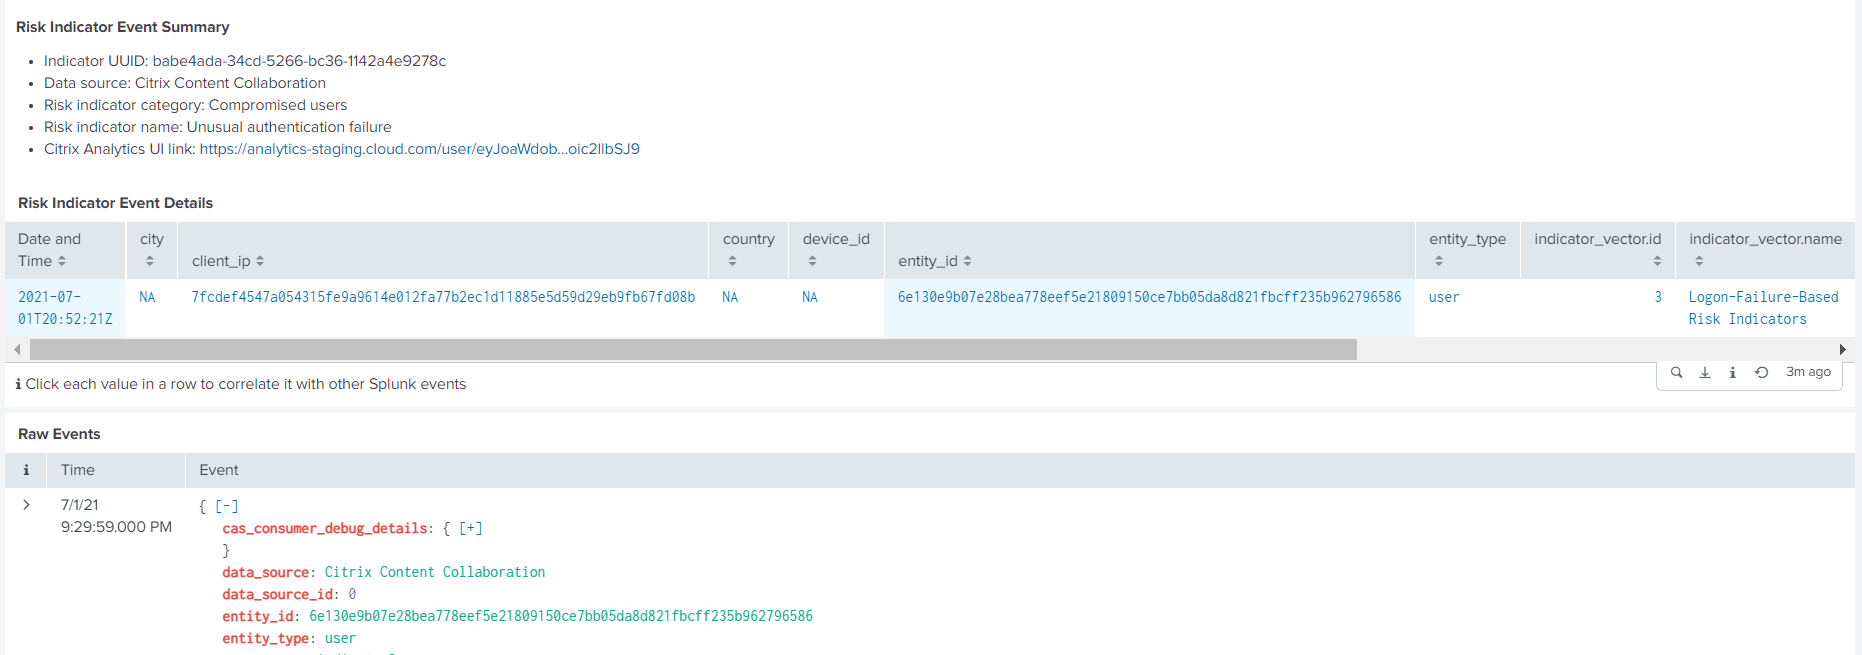
Click each row of the Risk Indicator Details table to view the event summary, event details, and raw events of the selected risk indicator.
On the Risk Indicator Event Summary section, click the Citrix Analytics UI link to go directly to the user timeline on Citrix Analytics for Security™ from your Splunk. On the user timeline, view the risk indicator, associated events, and any applied actions for the user.
For more information about event summary and event details, see Citrix Analytics data format for SIEM.
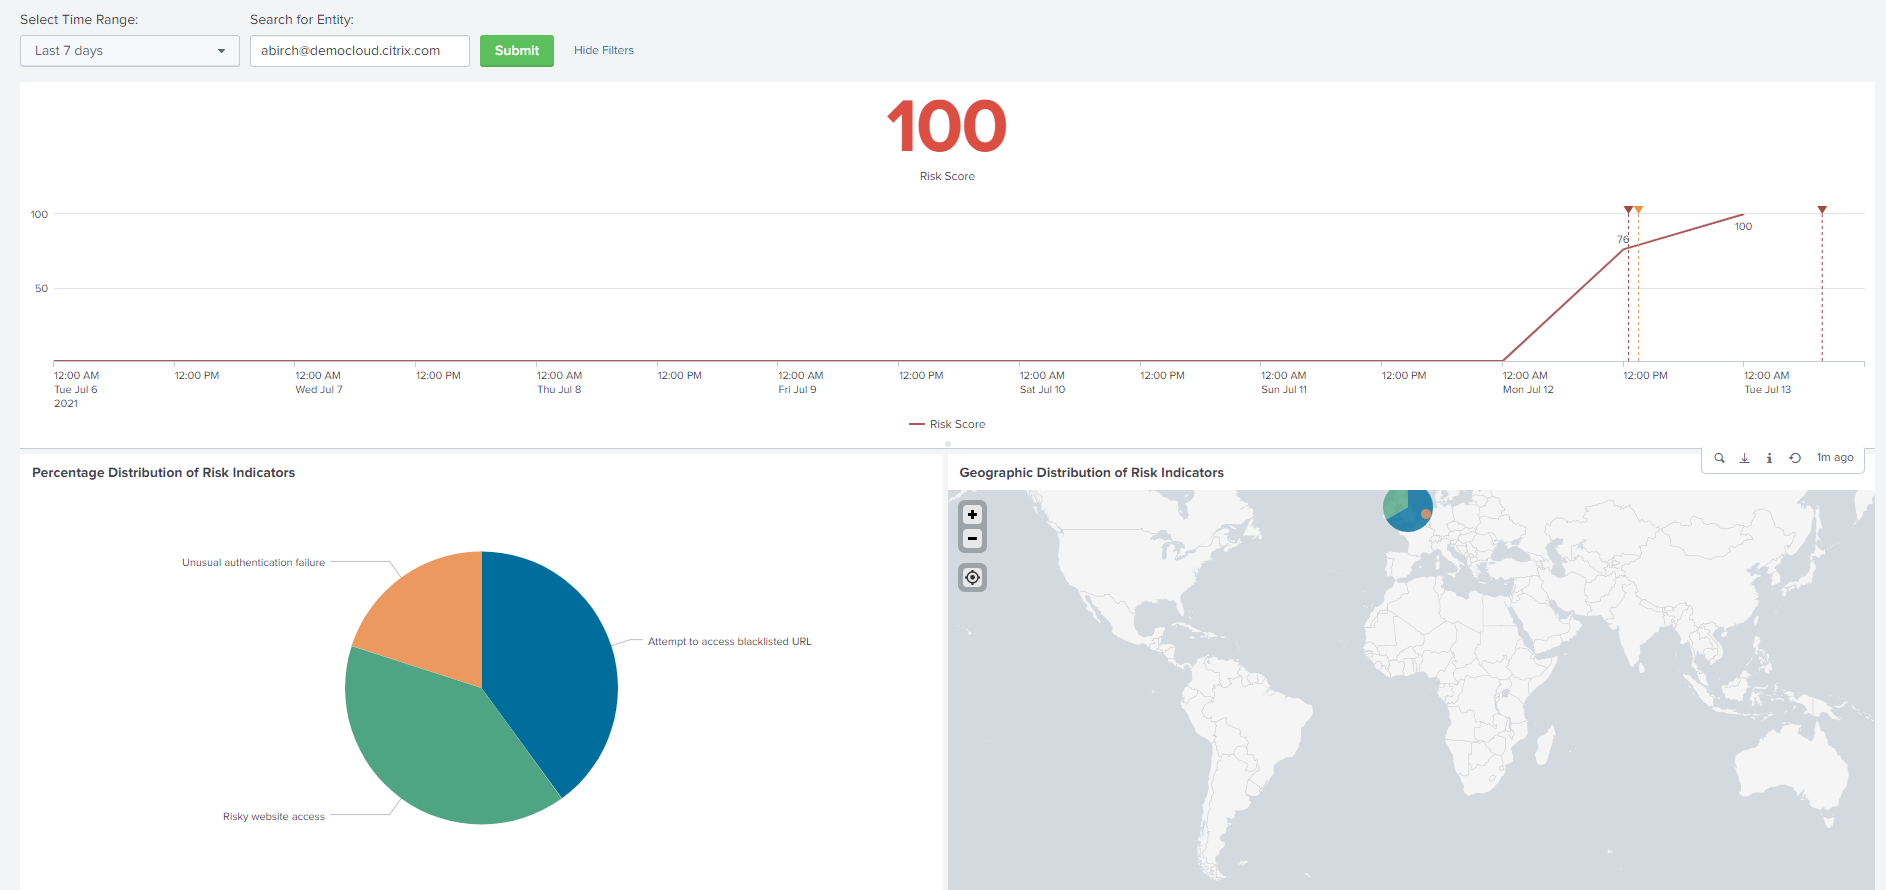
Entity details
Use the dashboard to view the details about a user entity user and its risky behavior.
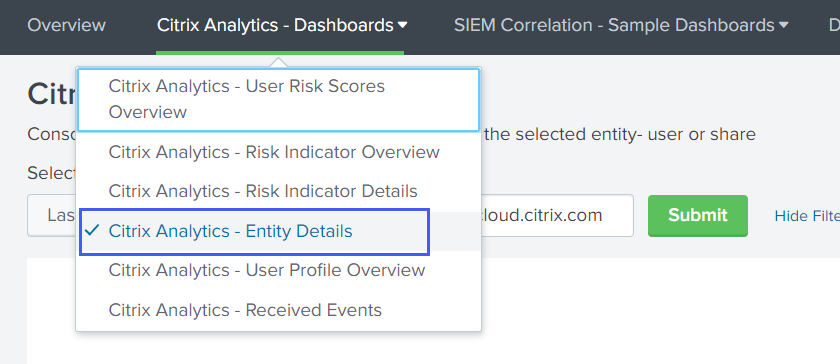
To view the dashboard, click Citrix Analytics- Dashboards > Citrix Analytics- Entity Details.
View the report
Enter a time range and the entity (user name) and click Submit to view the detailed information.
Alternatively, you can also view the detailed information about an entity from the following dashboards:
-
On Citrix Analytics- Risk Indicator Details, go to Top 10 Entities by Risk Indicators, and click an entity.
-
On Citrix Analytics- Risk Score Overview, go to Risky Users, and click a user name.
The following detailed information is displayed:
-
Current risk score and the risk score timeline for the selected time range.
-
Percentage distribution of the risk indicators. Helps you to analyze the pattern of risky activities of the entity.
-
Geographic distribution of the risk indicators. Helps you to identify the unusual and high-risk locations.
-
Client IP details associated with the risky activities.
-
User device details associated with the risky activities.
-
Risk indicator details such as associated data source, risk category, risk severity and so on.
Correlate the client IPs and user devices associated with risky activities with the events collected from other security sources that are connected to your Splunk. For example, click a row on the Client IP Details table.
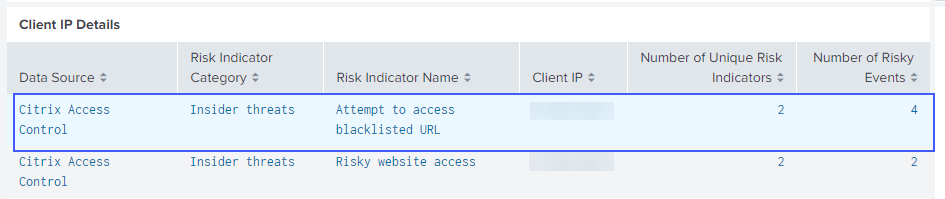
On the Citrix Analytics Event Correlation dashboard, you can view the events associated with the selected client IP that are correlated from your other security data sources (based on index and source type). These events provide deeper insights into the malicious activities associated with the client IP.

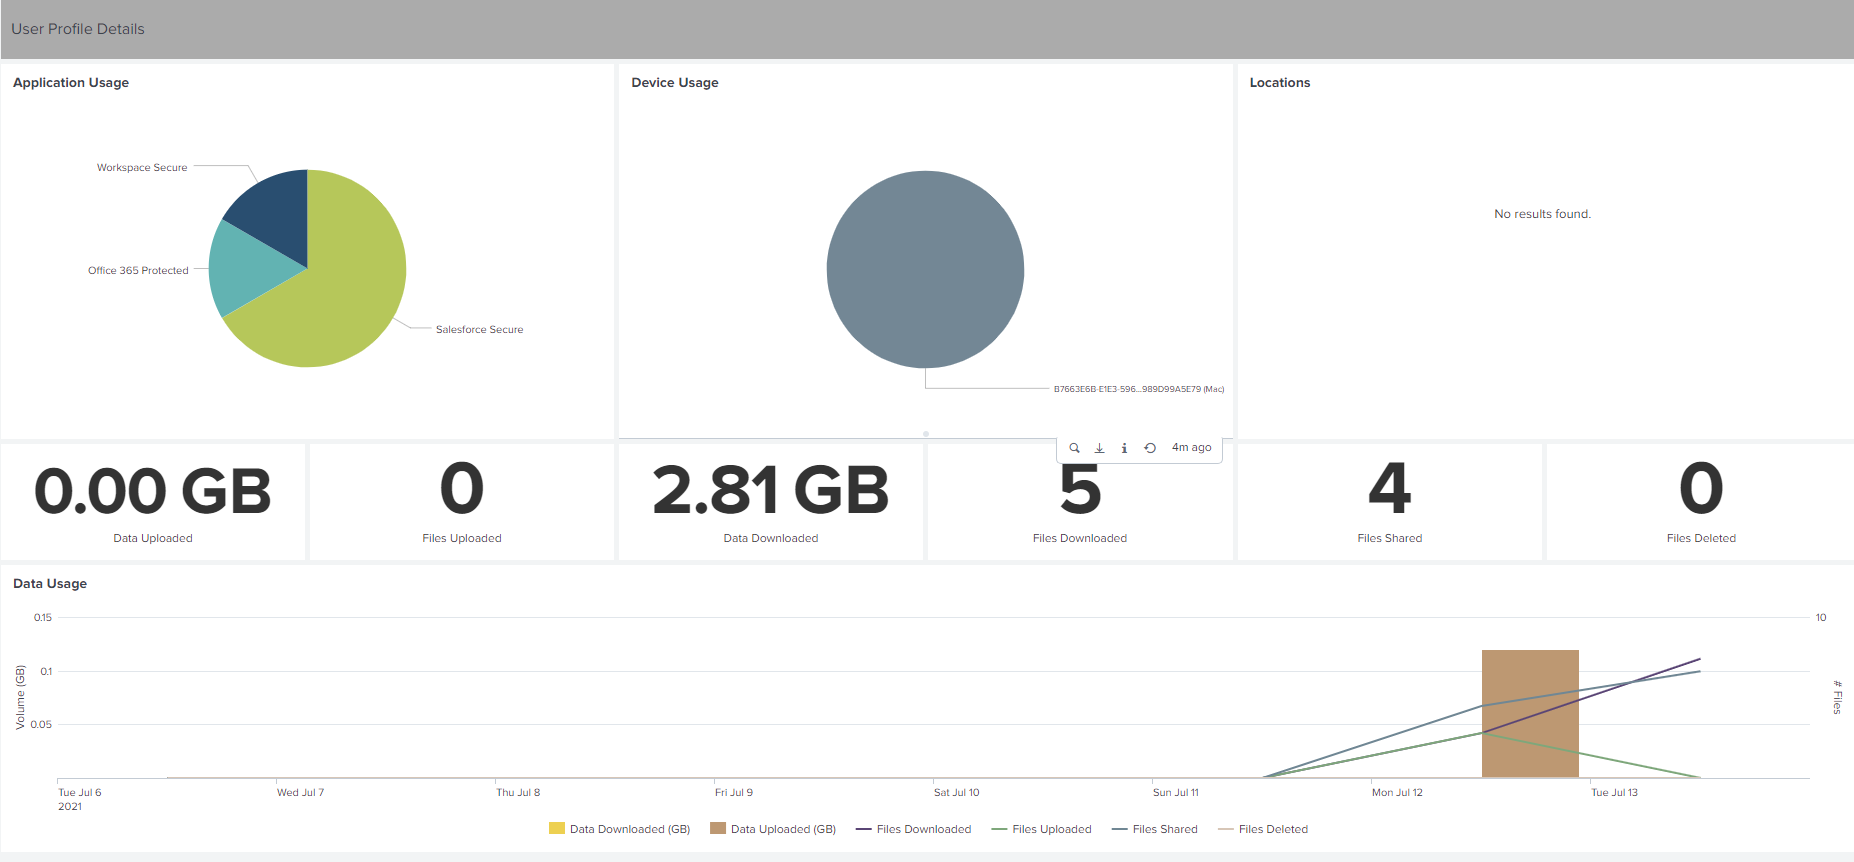
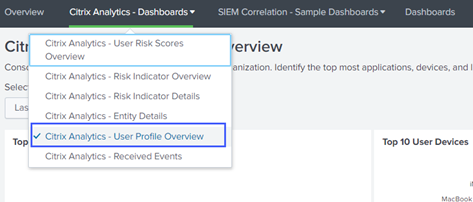
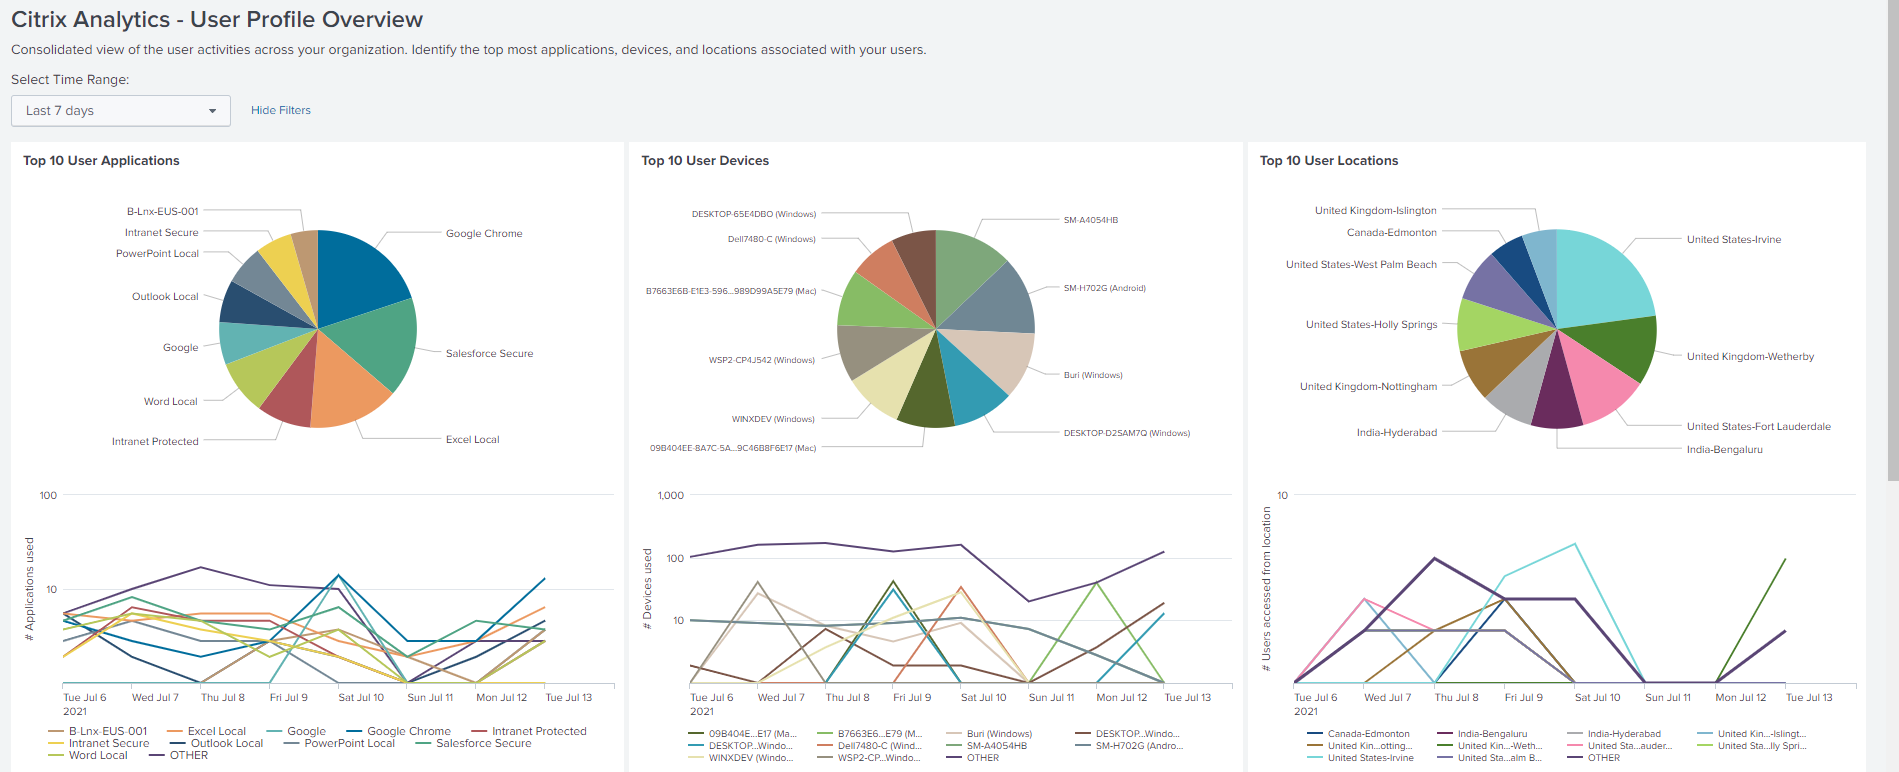
User profile overview
Use the dashboard to view the event metrics associated with the users in your organization.
To view the dashboard, click Citrix Analytics- Dashboards > Citrix Analytics- User Profile Overview.
View the events
Select a time range and view the following metrics:
-
Top 10 applications used by the users
-
Top 10 devices used by the users
-
Top 10 locations used by the users
-
Number of Web and SaaS applications used
-
Number of devices used
-
Number of users who have accessed across locations
-
Data usage metrics such as files uploaded, downloaded, shared
These metrics provide you insights into the user activities in your organization. You can identify the topmost applications and devices, usage patterns, non-compliant devices and applications, unusual locations, risky access, and unusual file activities.
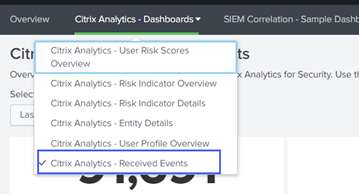
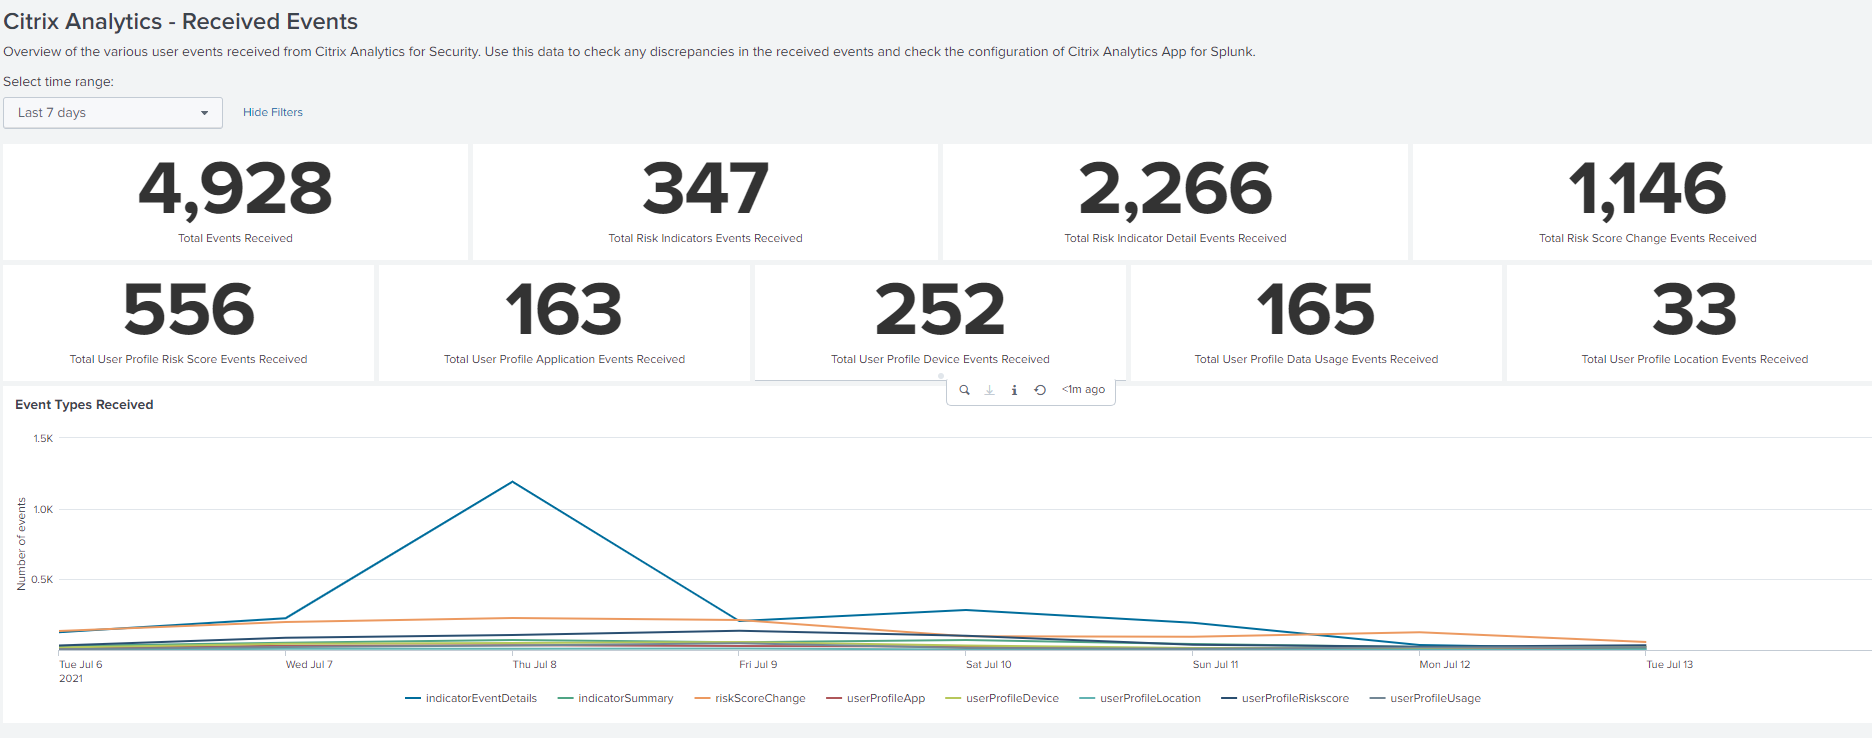
Received events
Use the dashboard to view the events received from Citrix Analytics for Security. An event indicates a type of user activity.
To view the dashboard, click Citrix Analytics- Dashboards > Citrix Analytics- Received Events.
View the reports
Select a time range to view and compare the various types of events received. The dashboard provides the following information:
-
Total events received: It is the aggregate of all the events received from Citrix Analytics for Security including the following:
-
Total risk indicator events: Indicates the events associated with the triggered risk indicators by the users.
-
Total risk indicator detail events: Indicates the events associated with the details of the triggered risk indicators.
-
Total risk score change events: Indicates the events associated with the user’s risk score change.
-
Total user profile risk score events: Indicates the events associated with users’ risk scores.
-
Total user profile application events: Indicates the events associated with the applications used by the users.
-
Total user profile device events: Indicates the events associated with the devices used by the users.
-
Total user profile data usage events: Indicates the events associated with the data usage of the users.
-
Total user profile location events: Indicates the events associated with the locations accessed by the users.
-
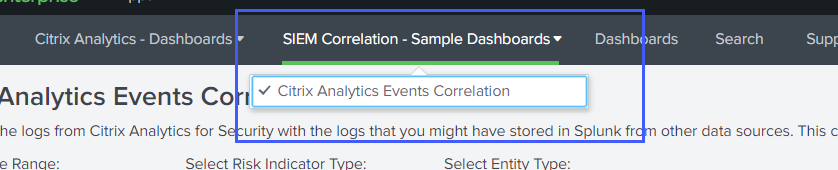
Sample event correlation
Use the dashboard to correlate events received from Citrix Analytics for Security with the events collected from other security data sources configured in your Splunk. You get deeper insights into the user’s risky activities collected from multiple data sources, find relations between the events, and identify any threats.
To view the dashboard, click SIEM Correlation- Sample Dashboards > Citrix Analytics Event Correlation.
Prerequisites
To perform correlation, ensure the following:
-
You must have events from your other security data sources to correlate. For example, events associated with users, devices, and client IP addresses received from other data sources configured in your Splunk.
-
You must have a correlation index already defined during configuration.
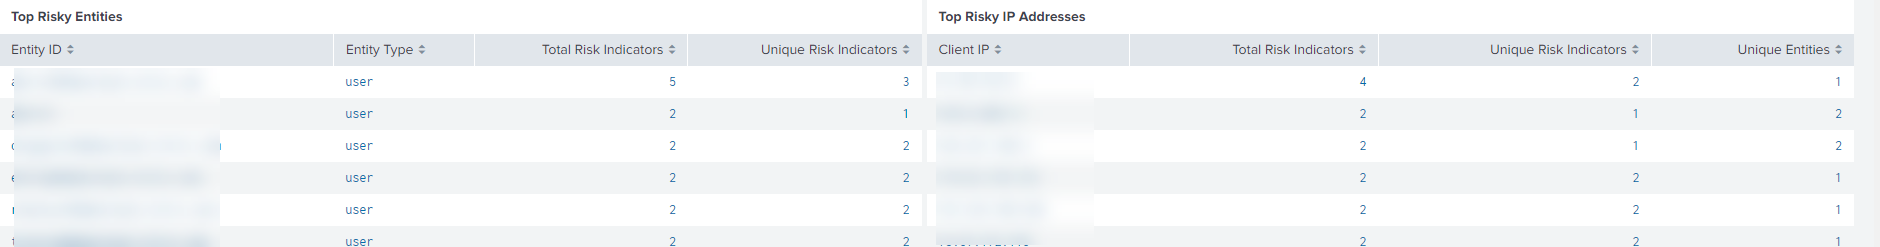
Correlate the events
You can view the top risky entities and the top risky IP addresses detected by Citrix Analytics for Security. To correlate these events with other data sources (defined in the index and the source type), click an entity or an IP address from the tables.
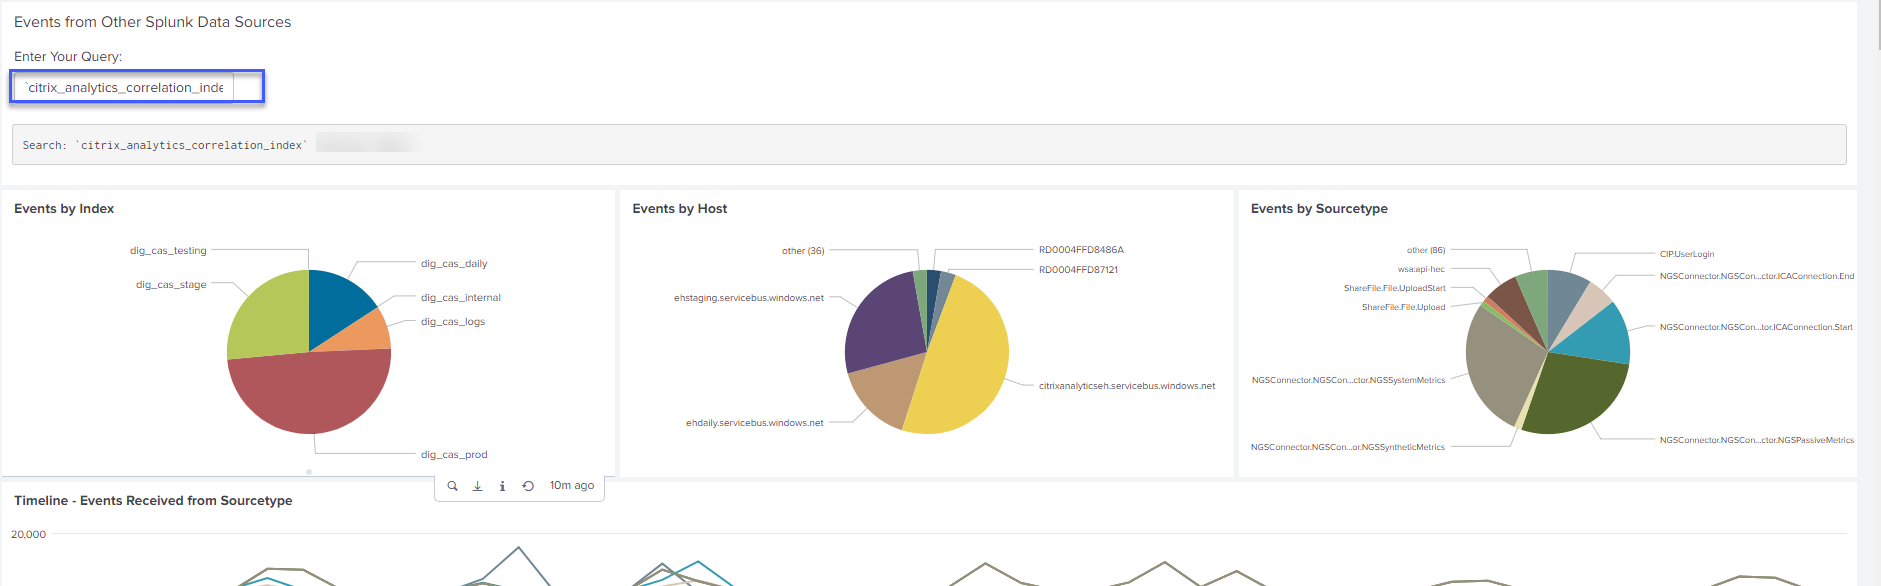
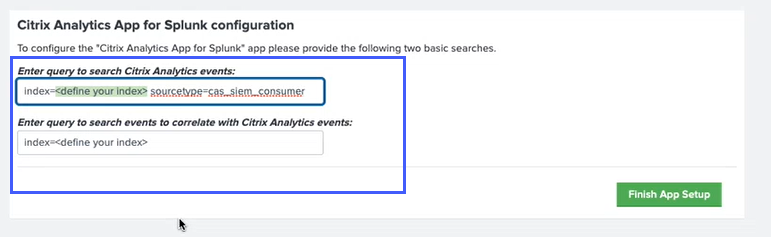
The index value shown in the query field is defined during the configuration of the app. You can change the index value to a different security data source based on your requirements.
Troubleshooting for no events
If you do not find any events on all the dashboards, it might be because of the configuration issues in Citrix Analytics App for Splunk and Citrix Analytics add-on for Splunk. In such scenario, verify the index value and the source type value. Ensure that the values of the index and source type are the same in both the app and the add-on.
To view the configuration settings of the Citrix Analytics App for Splunk:
-
Click Apps > Manage Apps.
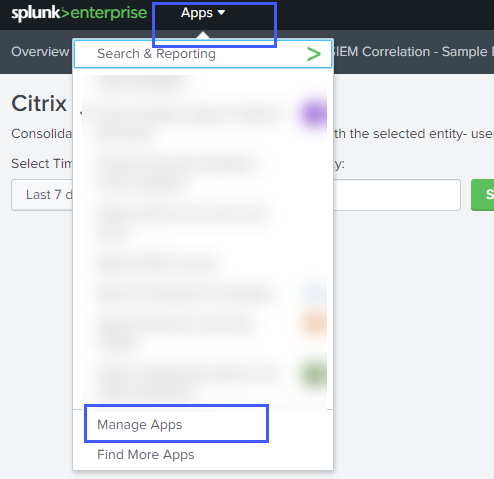
-
Locate Citrix Analytics App for Splunk from the list. Click Set up.
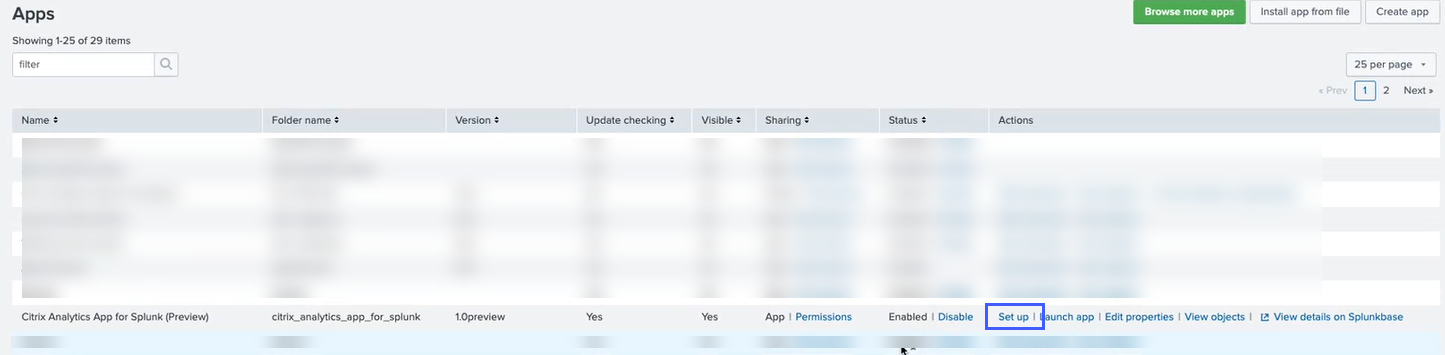
-
Check the source type and the index.
To view the configuration settings of the Citrix Analytics add-on for Splunk:
-
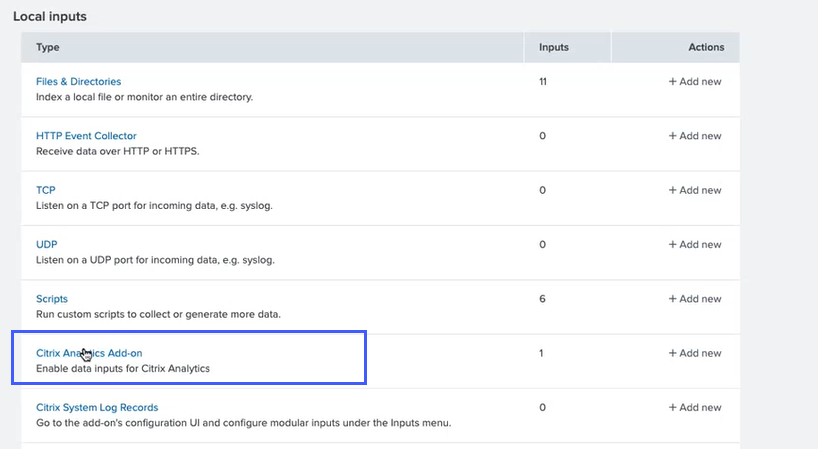
Click Settings > Data inputs.
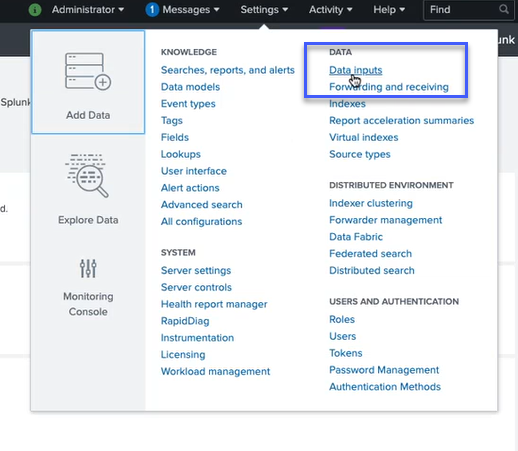
-
Click Citrix Analytics Add-on.
-
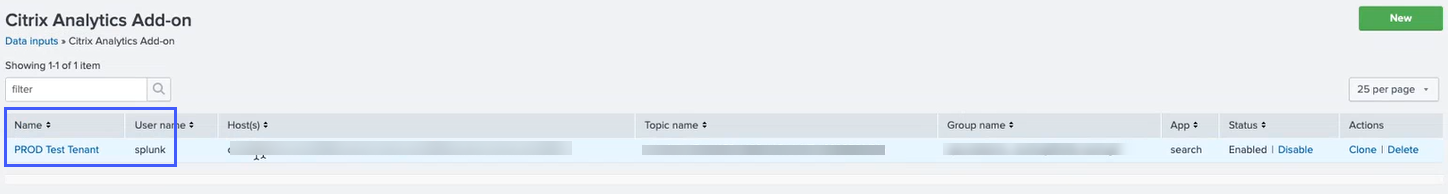
Click the tenant from which you get the events.
-
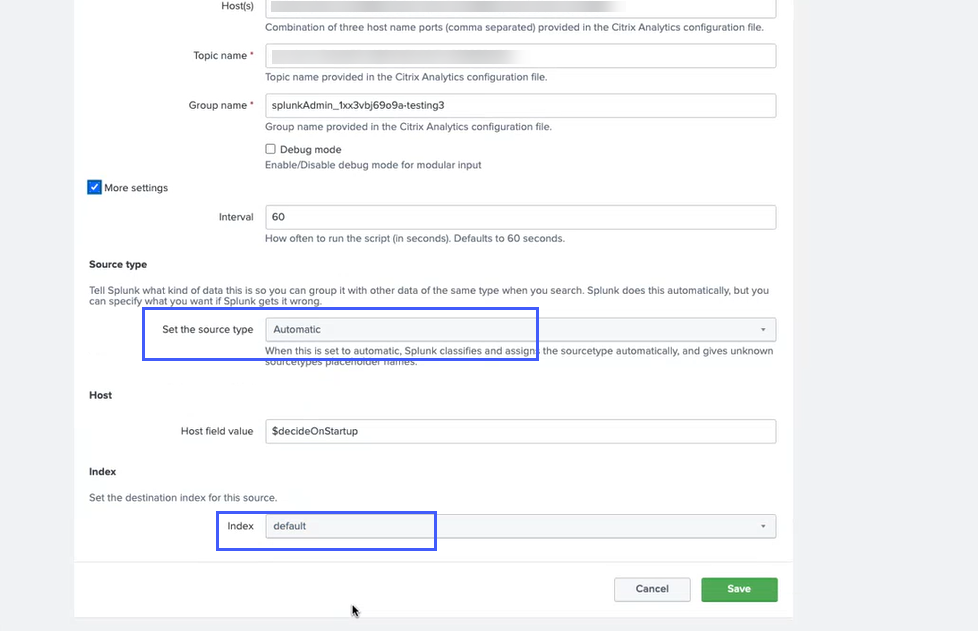
Select More settings.
-
Check the source type and the index.
For more information about configuration, see Configure Citrix Analytics add-on for Splunk.