-
Getting Started with NetScaler
-
Deploy a NetScaler VPX instance
-
Optimize NetScaler VPX performance on VMware ESX, Linux KVM, and Citrix Hypervisors
-
Apply NetScaler VPX configurations at the first boot of the NetScaler appliance in cloud
-
Configure simultaneous multithreading for NetScaler VPX on public clouds
-
Install a NetScaler VPX instance on Microsoft Hyper-V servers
-
Install a NetScaler VPX instance on Linux-KVM platform
-
Prerequisites for installing NetScaler VPX virtual appliances on Linux-KVM platform
-
Provisioning the NetScaler virtual appliance by using OpenStack
-
Provisioning the NetScaler virtual appliance by using the Virtual Machine Manager
-
Configuring NetScaler virtual appliances to use SR-IOV network interface
-
Configure a NetScaler VPX on KVM hypervisor to use Intel QAT for SSL acceleration in SR-IOV mode
-
Configuring NetScaler virtual appliances to use PCI Passthrough network interface
-
Provisioning the NetScaler virtual appliance by using the virsh Program
-
Provisioning the NetScaler virtual appliance with SR-IOV on OpenStack
-
Configuring a NetScaler VPX instance on KVM to use OVS DPDK-Based host interfaces
-
-
Deploy a NetScaler VPX instance on AWS
-
Deploy a VPX high-availability pair with elastic IP addresses across different AWS zones
-
Deploy a VPX high-availability pair with private IP addresses across different AWS zones
-
Protect AWS API Gateway using the NetScaler Web Application Firewall
-
Configure a NetScaler VPX instance to use SR-IOV network interface
-
Configure a NetScaler VPX instance to use Enhanced Networking with AWS ENA
-
Deploy a NetScaler VPX instance on Microsoft Azure
-
Network architecture for NetScaler VPX instances on Microsoft Azure
-
Configure multiple IP addresses for a NetScaler VPX standalone instance
-
Configure a high-availability setup with multiple IP addresses and NICs
-
Configure a high-availability setup with multiple IP addresses and NICs by using PowerShell commands
-
Deploy a NetScaler high-availability pair on Azure with ALB in the floating IP-disabled mode
-
Configure a NetScaler VPX instance to use Azure accelerated networking
-
Configure HA-INC nodes by using the NetScaler high availability template with Azure ILB
-
Configure a high-availability setup with Azure external and internal load balancers simultaneously
-
Configure a NetScaler VPX standalone instance on Azure VMware solution
-
Configure a NetScaler VPX high availability setup on Azure VMware solution
-
Configure address pools (IIP) for a NetScaler Gateway appliance
-
Deploy a NetScaler VPX instance on Google Cloud Platform
-
Deploy a VPX high-availability pair on Google Cloud Platform
-
Deploy a VPX high-availability pair with external static IP address on Google Cloud Platform
-
Deploy a single NIC VPX high-availability pair with private IP address on Google Cloud Platform
-
Deploy a VPX high-availability pair with private IP addresses on Google Cloud Platform
-
Install a NetScaler VPX instance on Google Cloud VMware Engine
-
-
Solutions for Telecom Service Providers
-
Load Balance Control-Plane Traffic that is based on Diameter, SIP, and SMPP Protocols
-
Provide Subscriber Load Distribution Using GSLB Across Core-Networks of a Telecom Service Provider
-
Authentication, authorization, and auditing application traffic
-
Basic components of authentication, authorization, and auditing configuration
-
Web Application Firewall protection for VPN virtual servers and authentication virtual servers
-
On-premises NetScaler Gateway as an identity provider to Citrix Cloud
-
Authentication, authorization, and auditing configuration for commonly used protocols
-
Troubleshoot authentication and authorization related issues
-
-
-
-
-
-
Configure DNS resource records
-
Configure NetScaler as a non-validating security aware stub-resolver
-
Jumbo frames support for DNS to handle responses of large sizes
-
Caching of EDNS0 client subnet data when the NetScaler appliance is in proxy mode
-
Use case - configure the automatic DNSSEC key management feature
-
Use Case - configure the automatic DNSSEC key management on GSLB deployment
-
-
-
Persistence and persistent connections
-
Advanced load balancing settings
-
Gradually stepping up the load on a new service with virtual server–level slow start
-
Protect applications on protected servers against traffic surges
-
Retrieve location details from user IP address using geolocation database
-
Use source IP address of the client when connecting to the server
-
Use client source IP address for backend communication in a v4-v6 load balancing configuration
-
Set a limit on number of requests per connection to the server
-
Configure automatic state transition based on percentage health of bound services
-
-
Use case 2: Configure rule based persistence based on a name-value pair in a TCP byte stream
-
Use case 3: Configure load balancing in direct server return mode
-
Use case 6: Configure load balancing in DSR mode for IPv6 networks by using the TOS field
-
Use case 7: Configure load balancing in DSR mode by using IP Over IP
-
Use case 10: Load balancing of intrusion detection system servers
-
Use case 11: Isolating network traffic using listen policies
-
Use case 12: Configure Citrix Virtual Desktops for load balancing
-
Use case 13: Configure Citrix Virtual Apps and Desktops for load balancing
-
Use case 14: ShareFile wizard for load balancing Citrix ShareFile
-
Use case 15: Configure layer 4 load balancing on the NetScaler appliance
-
-
-
-
Authentication and authorization for System Users
-
-
Configuring a CloudBridge Connector Tunnel between two Datacenters
-
Configuring CloudBridge Connector between Datacenter and AWS Cloud
-
Configuring a CloudBridge Connector Tunnel Between a Datacenter and Azure Cloud
-
Configuring CloudBridge Connector Tunnel between Datacenter and SoftLayer Enterprise Cloud
-
Configuring a CloudBridge Connector Tunnel Between a NetScaler Appliance and Cisco IOS Device
-
CloudBridge Connector Tunnel Diagnostics and Troubleshooting
This content has been machine translated dynamically.
Dieser Inhalt ist eine maschinelle Übersetzung, die dynamisch erstellt wurde. (Haftungsausschluss)
Cet article a été traduit automatiquement de manière dynamique. (Clause de non responsabilité)
Este artículo lo ha traducido una máquina de forma dinámica. (Aviso legal)
此内容已经过机器动态翻译。 放弃
このコンテンツは動的に機械翻訳されています。免責事項
이 콘텐츠는 동적으로 기계 번역되었습니다. 책임 부인
Este texto foi traduzido automaticamente. (Aviso legal)
Questo contenuto è stato tradotto dinamicamente con traduzione automatica.(Esclusione di responsabilità))
This article has been machine translated.
Dieser Artikel wurde maschinell übersetzt. (Haftungsausschluss)
Ce article a été traduit automatiquement. (Clause de non responsabilité)
Este artículo ha sido traducido automáticamente. (Aviso legal)
この記事は機械翻訳されています.免責事項
이 기사는 기계 번역되었습니다.책임 부인
Este artigo foi traduzido automaticamente.(Aviso legal)
这篇文章已经过机器翻译.放弃
Questo articolo è stato tradotto automaticamente.(Esclusione di responsabilità))
Translation failed!
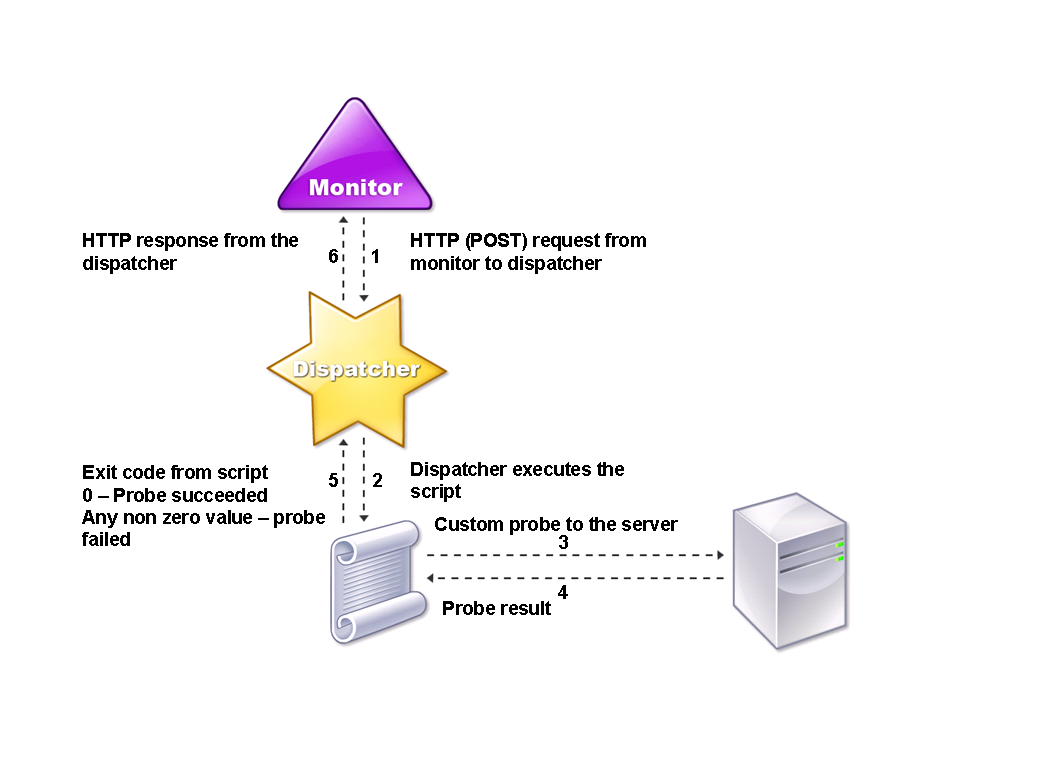
Understand user monitors
User monitors extend the scope of custom monitors. You can create user monitors to track the health of customized applications and protocols that the NetScaler appliance does not support. The following diagram illustrates how a user monitor works.
Figure 1. User Monitors
A user monitor requires the following components.
Dispatcher. A process, on the appliance, that listens to monitoring requests. A dispatcher can be on the loopback IP address (127.0.0.1) and port 3013. Dispatchers are also known as internal dispatchers. A dispatcher can also be a web server that supports the Common Gateway Interface (CGI). Such dispatchers are also known as external dispatchers. They are used for custom scripts that do not run on the FreeBSD environment, such as .NET scripts.
Note:
You can configure the monitor and the dispatcher to use HTTPS instead of HTTP by enabling the “secure” option on the monitor, and configure it as an external dispatcher. However, an internal dispatcher understands only HTTP, and cannot use HTTPS.
In a HA setup, the dispatcher runs on both the primary and secondary NetScaler appliances. The dispatcher remains inactive on the secondary appliance.
Script. The script is a program that sends custom probes to the load balanced server and returns the response code to the dispatcher. The script can return any value to the dispatcher, but if a probe succeeds, the script must return a value of zero (0). The dispatcher considers any other value as probe failure.
The NetScaler appliance is bundled with sample scripts for commonly used protocols. The scripts exist in the /nsconfig/monitors directory. If you want to add a script, add it there. To customize an existing script, create a copy with a new name and modify it.
Important:
-
Starting with NetScaler release 13.0 build 41.20, you can use the
nsntlm-lwp.plscript to create a monitor for monitoring a secure NTLM server. -
Starting with release 10.1 build 122.17, the script files for user monitors are in a new location.
If you upgrade an MPX or VPX virtual appliance to release 10.1 build 122.17 or later, the changes are as follows:
- A new directory named conflicts is created in /nsconfig/monitors/ and all the built-in scripts of the previous builds are moved to this directory.
- All new built-in scripts are available in the /netscaler/monitors/ directory. All custom scripts are available in the /nsconfig/monitors/ directory.
- Save a new custom script in the /nsconfig/monitors/ directory.
- After the upgrade is completed, if a custom script is created and saved in the /nsconfig/monitors/ directory, with the same name as the built-in script, the script in the /netscaler/monitors/ directory takes priority. The custom script does not run.
If you provision a virtual appliance with release 10.1 build 122.17 or later, the changes are as follows:
- All built-in scripts are available in the /netscaler/monitors/ directory.
- The /nsconfig/monitors/ directory is empty.
- If you create a custom script, you must save it in the /nsconfig/monitors/ directory.
For the scripts to function correctly:
- The maximum number of characters in the name of the script must not exceed 63.
- The maximum number of script arguments that can be provided to a script must not exceed 512.
- The maximum number of characters that can be provided in the parameter script arguments must not exceed 639.
To debug the script, you must run it by using the nsumon-debug.pl script from the CLI. You use the script name (with its arguments), IP address, and the port as the arguments of the nsumon-debug.pl script. Users must use the script name, IP address, port, time-out, and the script arguments for the nsumon-debug.pl script.
At the CLI, type:
nsumon-debug.pl <scriptname> <IP> <port> <timeout> <partitionID> [scriptarguments][is_secure]
<!--NeedCopy-->
Important: Starting with release 10.5 build 57.x, the 11.0 script files for user monitors support IPv6 addresses and include the following changes:
-
For the following protocols, new
pm fileshave been included for IPv6 support.- RADIUS
- NNTP
- POP3
- SMTP
-
The following sample scripts in /netscaler/monitors/ has been updated for IPv6 support:
-
nsbmradius.pl
-
nsldap.pl
-
nsnntp.pl
-
nspop3 nssf.pl
-
nssnmp.pl
-
nswi.pl
-
nstftp.pl
-
nssmtp.pl
-
nsrdp.pl
-
nsntlm-lwp.pl
-
nsftp.pl
-
nsappc.pl
After upgrading to release 10.5 build 57.x, or 11.0, if you want to use your existing custom scripts with IPv6 services, make sure that you update the existing custom scripts with the changes provided in the updated sample scripts in /netscaler/monitors/.
-
Note:
The sample script nsmysql.pl does not support the IPv6 address. If an IPv6 service is bound to a user monitor that uses nsmysql.pl, the probe fails.
-
The following LB monitor types have been updated to support IPv6 addresses:
-
USER
-
SMTP
-
NNTP
-
LDAP
-
SNMP
-
POP3
-
FTP_EXTENDED
-
StoreFront
-
APPC
-
CITRIX_WI_EXTENDED
If you are creating a custom script that uses one of these LB monitors types, ensure to include IPv6 support in the custom script. Refer to the associated sample script in /netscaler/monitors/ for the changes that you have to make in the custom script for IPv6 support.
-
To track the status of the server, the monitor sends an HTTP POST request to the configured dispatcher. This POST request contains the IP address and port of the server, and the script that must be run. The dispatcher runs the script as a child process, with user-defined parameters (if any). Then, the script sends a probe to the server. The script sends the status of the probe (response code) to the dispatcher. The dispatcher converts the response code to an HTTP response and sends it to the monitor. Based on the HTTP response, the monitor marks the service as up or down.
The NetScaler appliance logs the error messages to the /var/nslog/nsumond.log file when user monitor probes fail. These detailed error messages are displayed in the GUI, and in the CLI for the show service/service group commands.
The following table lists the user monitors and the possible reasons for failure.
| User monitor type | Probe failure reasons |
|---|---|
| SMTP | Monitor fails to establish a connection to the server. |
| NNTP | Monitor fails to establish a connection to the server. |
| Missing or invalid script arguments, which can include an invalid number of arguments or argument format. | |
| Monitor fails to find the NNTP group. | |
| LDAP | Monitor fails to establish a connection to the server. |
| Missing or invalid script arguments, which can include an invalid number of arguments or argument format. | |
| Monitor fails to bind to the LDAP server. | |
| Monitor fails to locate an entry for the target entity in the LDAP server. | |
| FTP | The connection to the server times out. |
| Missing or invalid script arguments, which can include an invalid number of arguments or argument format. | |
| Logon fails. | |
| Monitor fails to find the file on the server. | |
| POP3 | Monitor fails to establish a connection to the database. |
| Missing or invalid script arguments, which can include an invalid number of arguments or argument format. | |
| Logon fails. | |
| Preparation of the SQL query fails. | |
| Execution of the SQL query fails. | |
| SNMP | Monitor fails to establish a connection to the database. |
| Missing or invalid script arguments, which can include an invalid number of arguments or argument format. | |
| Logon fails. | |
| Monitor fails to create the SNMP session. | |
| Monitor fails to find the object identifier. | |
| The monitor threshold value setting is greater than or equal to the actual threshold of the monitor. | |
| RDP (Windows Terminal Server) | Missing or invalid script arguments, which can include an invalid number of arguments or argument format. |
| Monitor fails to create a socket. | |
| Mismatch in versions. | |
| Monitor fails to confirm connection. |
You can view the log file from the CLI by using the following commands:
> shell
root@ns# cat /var/nslog/nsumond.log
root@ns# exit
>
<!--NeedCopy-->
The command opens a BSD shell, displays the log file on the screen, closes the BSD shell, and returns you to the CLI.
Before NetScaler release 13.0 build 52.X, the show service/service group command displayed a generic error message saying “probe failed” as the cause for the user monitor probe failure.
Example:
show service ftp

Monitor Name: mon2
State: UNKNOWN  Weight: 1   Passive: 0
Probes: 3    Failed [Total: 0 Current: 0]
Last response: Failure - Probe failed.
Response Time: 1071.838 millisec
<!--NeedCopy-->
From NetScaler release 13.0 build 52.X onwards, the show service/service group command displays the actual cause for the user monitor probe failure.
Example:
show service ftp

Monitor Name: mon2
State: DOWN   Weight: 1   Passive: 0
Probes: 729   Failed [Total: 726 Current: 726]
Last response: Failure - Login failed.
Response Time: 8000.0 millisec
<!--NeedCopy-->
User monitors also have a time-out value and a retry count for probe failures. You can use user monitors with non-user monitors. During high CPU utilization, a non-user monitor enables faster detection of a server failure.
If the user monitor probe times out during high CPU usage, the state of the service remains unchanged.
Example1:
add lb monitor <name> USER –scriptname <script-name> -resptimeout 5 seconds
<!--NeedCopy-->
Note
For scriptable monitors, the response timeout must be configured to a value equal to the expected timeout + 1 second. For example, if you expect the timeout to be 4 seconds, configure the response timeout as 5 seconds.
Example2:
add lb monitor <name> USER –scriptname <script-name> -scriptargs <Arguments> -secureargs <Arguments>
<!--NeedCopy-->
Note:
We recommend that you use the
secureargsparameter instead of thescriptargsparameter for any sensitive data that is related to the scripts.
Share
Share
In this article
This Preview product documentation is Cloud Software Group Confidential.
You agree to hold this documentation confidential pursuant to the terms of your Cloud Software Group Beta/Tech Preview Agreement.
The development, release and timing of any features or functionality described in the Preview documentation remains at our sole discretion and are subject to change without notice or consultation.
The documentation is for informational purposes only and is not a commitment, promise or legal obligation to deliver any material, code or functionality and should not be relied upon in making Cloud Software Group product purchase decisions.
If you do not agree, select I DO NOT AGREE to exit.