-
Getting Started with NetScaler
-
Deploy a NetScaler VPX instance
-
Optimize NetScaler VPX performance on VMware ESX, Linux KVM, and Citrix Hypervisors
-
Apply NetScaler VPX configurations at the first boot of the NetScaler appliance in cloud
-
Configure simultaneous multithreading for NetScaler VPX on public clouds
-
Install a NetScaler VPX instance on Microsoft Hyper-V servers
-
Install a NetScaler VPX instance on Linux-KVM platform
-
Prerequisites for installing NetScaler VPX virtual appliances on Linux-KVM platform
-
Provisioning the NetScaler virtual appliance by using OpenStack
-
Provisioning the NetScaler virtual appliance by using the Virtual Machine Manager
-
Configuring NetScaler virtual appliances to use SR-IOV network interface
-
Configure a NetScaler VPX on KVM hypervisor to use Intel QAT for SSL acceleration in SR-IOV mode
-
Configuring NetScaler virtual appliances to use PCI Passthrough network interface
-
Provisioning the NetScaler virtual appliance by using the virsh Program
-
Provisioning the NetScaler virtual appliance with SR-IOV on OpenStack
-
Configuring a NetScaler VPX instance on KVM to use OVS DPDK-Based host interfaces
-
-
Deploy a NetScaler VPX instance on AWS
-
Deploy a VPX high-availability pair with elastic IP addresses across different AWS zones
-
Deploy a VPX high-availability pair with private IP addresses across different AWS zones
-
Protect AWS API Gateway using the NetScaler Web Application Firewall
-
Configure a NetScaler VPX instance to use SR-IOV network interface
-
Configure a NetScaler VPX instance to use Enhanced Networking with AWS ENA
-
Deploy a NetScaler VPX instance on Microsoft Azure
-
Network architecture for NetScaler VPX instances on Microsoft Azure
-
Configure multiple IP addresses for a NetScaler VPX standalone instance
-
Configure a high-availability setup with multiple IP addresses and NICs
-
Configure a high-availability setup with multiple IP addresses and NICs by using PowerShell commands
-
Deploy a NetScaler high-availability pair on Azure with ALB in the floating IP-disabled mode
-
Configure a NetScaler VPX instance to use Azure accelerated networking
-
Configure HA-INC nodes by using the NetScaler high availability template with Azure ILB
-
Configure a high-availability setup with Azure external and internal load balancers simultaneously
-
Configure a NetScaler VPX standalone instance on Azure VMware solution
-
Configure a NetScaler VPX high availability setup on Azure VMware solution
-
Configure address pools (IIP) for a NetScaler Gateway appliance
-
Deploy a NetScaler VPX instance on Google Cloud Platform
-
Deploy a VPX high-availability pair on Google Cloud Platform
-
Deploy a VPX high-availability pair with external static IP address on Google Cloud Platform
-
Deploy a single NIC VPX high-availability pair with private IP address on Google Cloud Platform
-
Deploy a VPX high-availability pair with private IP addresses on Google Cloud Platform
-
Install a NetScaler VPX instance on Google Cloud VMware Engine
-
-
Solutions for Telecom Service Providers
-
Load Balance Control-Plane Traffic that is based on Diameter, SIP, and SMPP Protocols
-
Provide Subscriber Load Distribution Using GSLB Across Core-Networks of a Telecom Service Provider
-
Authentication, authorization, and auditing application traffic
-
Basic components of authentication, authorization, and auditing configuration
-
Web Application Firewall protection for VPN virtual servers and authentication virtual servers
-
On-premises NetScaler Gateway as an identity provider to Citrix Cloud
-
Authentication, authorization, and auditing configuration for commonly used protocols
-
Troubleshoot authentication and authorization related issues
-
-
-
-
-
-
Configure DNS resource records
-
Configure NetScaler as a non-validating security aware stub-resolver
-
Jumbo frames support for DNS to handle responses of large sizes
-
Caching of EDNS0 client subnet data when the NetScaler appliance is in proxy mode
-
Use case - configure the automatic DNSSEC key management feature
-
Use Case - configure the automatic DNSSEC key management on GSLB deployment
-
-
-
Persistence and persistent connections
-
Advanced load balancing settings
-
Gradually stepping up the load on a new service with virtual server–level slow start
-
Protect applications on protected servers against traffic surges
-
Retrieve location details from user IP address using geolocation database
-
Use source IP address of the client when connecting to the server
-
Use client source IP address for backend communication in a v4-v6 load balancing configuration
-
Set a limit on number of requests per connection to the server
-
Configure automatic state transition based on percentage health of bound services
-
-
Use case 2: Configure rule based persistence based on a name-value pair in a TCP byte stream
-
Use case 3: Configure load balancing in direct server return mode
-
Use case 6: Configure load balancing in DSR mode for IPv6 networks by using the TOS field
-
Use case 7: Configure load balancing in DSR mode by using IP Over IP
-
Use case 10: Load balancing of intrusion detection system servers
-
Use case 11: Isolating network traffic using listen policies
-
Use case 12: Configure Citrix Virtual Desktops for load balancing
-
Use case 13: Configure Citrix Virtual Apps and Desktops for load balancing
-
Use case 14: ShareFile wizard for load balancing Citrix ShareFile
-
Use case 15: Configure layer 4 load balancing on the NetScaler appliance
-
-
NetScaler advanced analytics
-
-
-
Authentication and authorization for System Users
-
-
Configuring a CloudBridge Connector Tunnel between two Datacenters
-
Configuring CloudBridge Connector between Datacenter and AWS Cloud
-
Configuring a CloudBridge Connector Tunnel Between a Datacenter and Azure Cloud
-
Configuring CloudBridge Connector Tunnel between Datacenter and SoftLayer Enterprise Cloud
-
Configuring a CloudBridge Connector Tunnel Between a NetScaler Appliance and Cisco IOS Device
-
CloudBridge Connector Tunnel Diagnostics and Troubleshooting
This content has been machine translated dynamically.
Dieser Inhalt ist eine maschinelle Übersetzung, die dynamisch erstellt wurde. (Haftungsausschluss)
Cet article a été traduit automatiquement de manière dynamique. (Clause de non responsabilité)
Este artículo lo ha traducido una máquina de forma dinámica. (Aviso legal)
此内容已经过机器动态翻译。 放弃
このコンテンツは動的に機械翻訳されています。免責事項
이 콘텐츠는 동적으로 기계 번역되었습니다. 책임 부인
Este texto foi traduzido automaticamente. (Aviso legal)
Questo contenuto è stato tradotto dinamicamente con traduzione automatica.(Esclusione di responsabilità))
This article has been machine translated.
Dieser Artikel wurde maschinell übersetzt. (Haftungsausschluss)
Ce article a été traduit automatiquement. (Clause de non responsabilité)
Este artículo ha sido traducido automáticamente. (Aviso legal)
この記事は機械翻訳されています.免責事項
이 기사는 기계 번역되었습니다.책임 부인
Este artigo foi traduzido automaticamente.(Aviso legal)
这篇文章已经过机器翻译.放弃
Questo articolo è stato tradotto automaticamente.(Esclusione di responsabilità))
Translation failed!
NetScaler advanced analytics
NetScaler advanced analytics examines the data gathered by NetScaler and extracts valuable insights about its performance. By leveraging the power of advanced analytics, the administrators gain insights into the network’s performance and can take proactive measures to enhance overall network reliability, performance, and security.
Analytics typically involves examining historical data to gain insights into past events and behavior. Advanced analytics uses more sophisticated techniques to gain insights into past events and also forecast future trends and potential outcomes.
Advantages of NetScaler advanced analytics
NetScaler advanced analytics provide you the following benefits:
- Early identification of abnormal network behavior
- Improved security posture
- Optimized resource allocation
- Deeper understanding of application-level traffic patterns
NetScaler advanced analytics on Splunk
NetScaler advanced analytics collects and analyzes network traffic data using third-party observation tools, such as Splunk. NetScaler advanced analytics aims at developing a robust system capable of continuously monitoring network traffic, analyzing transactions at the application layer, and flagging instances where transaction bytes surpass predefined thresholds (upload and download transaction bytes).
NetScaler adopts anomaly detection techniques that include statistical methods to identify any abnormal behavior. These techniques utilize the past 21 days’ data to establish a reliable baseline for what is considered normal behavior. NetScaler keeps a close eye on incoming traffic, in real-time. It employs advanced algorithms to define thresholds for normal transactions. These thresholds are dynamic, which means they are adjusted continuously based on the historical data and domain knowledge. Whenever a transaction exceeds the predefined threshold, the system immediately flags it for further investigation.
When anomalies are detected, the NetScaler notifies administrators to investigate and take action. This notification ensures that any potentially fraudulent or suspicious activity is identified and dealt with promptly, allowing a safer and more secure environment for all users. You can notify using email or any of the notification options that Splunk supports. To know more about notification options, see Configure alert actions.
Configure NetScaler advanced analytics on Splunk
To configure NetScaler advanced analytics app on Splunk, perform the following steps:
Prerequisites
-
Ensure that NetScaler is exporting the metrics and transactions data to Splunk.
-
Transaction data: For information on how to configure exporting data from NetScaler to Splunk, see Export transaction logs directly from NetScaler to Splunk. Along with this configuration, you must enable the following arguments to export UserAgent and URL variables in the analytics profile:
 -httpURL ENABLED -httpUserAgent ENABLED
 <!--NeedCopy-->
Sample command
 set analytics profile <http analytics profile name> -collectors <splunk hec endpoint service name> -type webinsight -httpURL ENABLED -httpUserAgent ENABLED -httpContentType ENABLED -analyticsAuthToken "Splunk <HEC_TOKEN HERE>" -analyticsEndpointUrl "/services/collector/event" -analyticsEndpointContentType "application/json"
 <!--NeedCopy-->
Enable export of Useragent and URL in existing analytics profile :
set analytics profile <http analytics profile name> --httpClientSideMeasurements ENABLED -httpURL ENABLED -httpUserAgent ENABLED <!--NeedCopy--> -
Metrics: For information on how to export metrics directly from NetScaler to Splunk, see Export metrics directly from NetScaler to Splunk.
-
-
Ensure that the Python for Scientific computing app is installed on Splunk. To install this app, navigate to Apps > Manage Apps, click Browse for more apps, search for the Python for Scientific computing app and click Install.
-
Download the
.splfile from https://www.citrix.com/downloads/citrix-adc/splunk-apps/list-of-apps.html. -
Ensure that an index that can store 21 days of data exists on Splunk. You can use an existing index or create a new index of type Events. For information on how to create an index, see Splunk documentation.
Configuration
- Log in to Splunk.
- Navigate to Apps > Manage Apps and click Install from file.
-
Click Choose file and upload the
.splfile.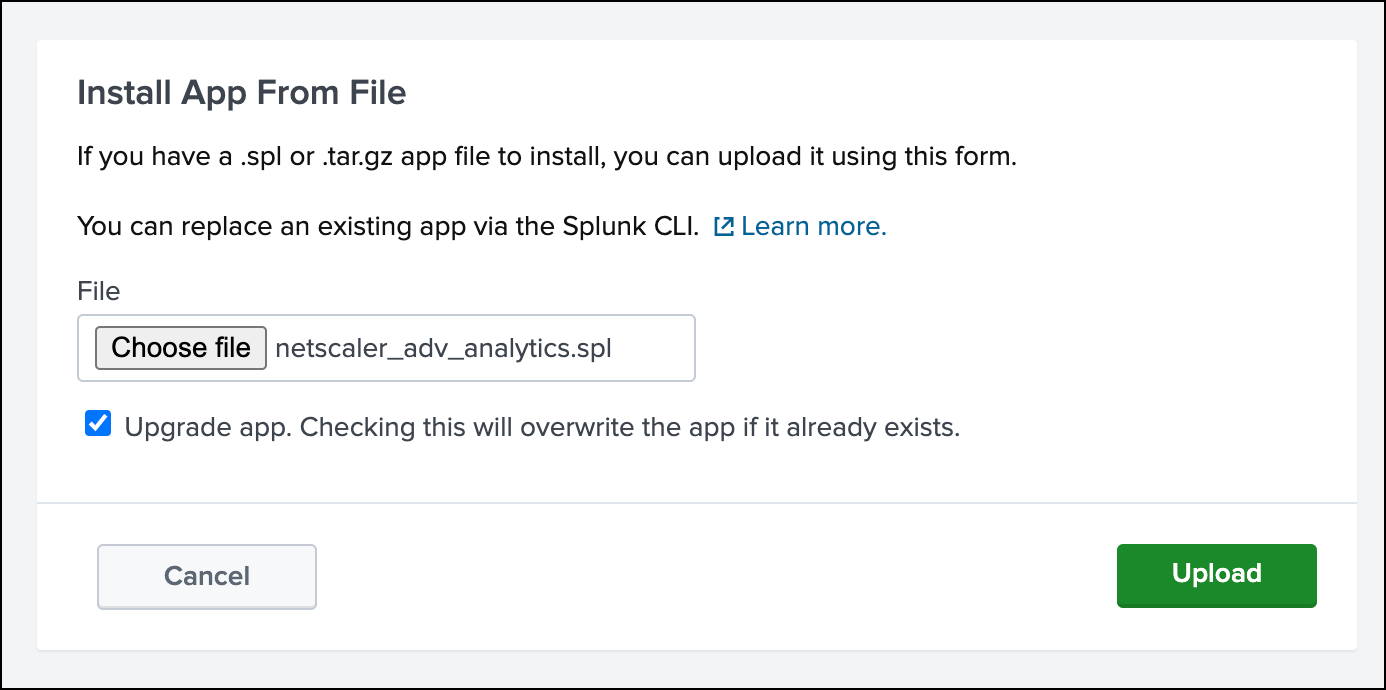
- Click Upload and then click Continue to App setup page.
- On the NetScaler Advanced Analytics App for Splunk configuration page, enter data in the following fields:
- Enter the name of the index into which NetScaler events are ingested: The index where the data from NetScaler is stored.
- Enter the name of the index to save results generated from NetScaler Advanced Analytics app: The index where the data generated from the Splunk app is saved. The index must store a minimum of 21 days of data.
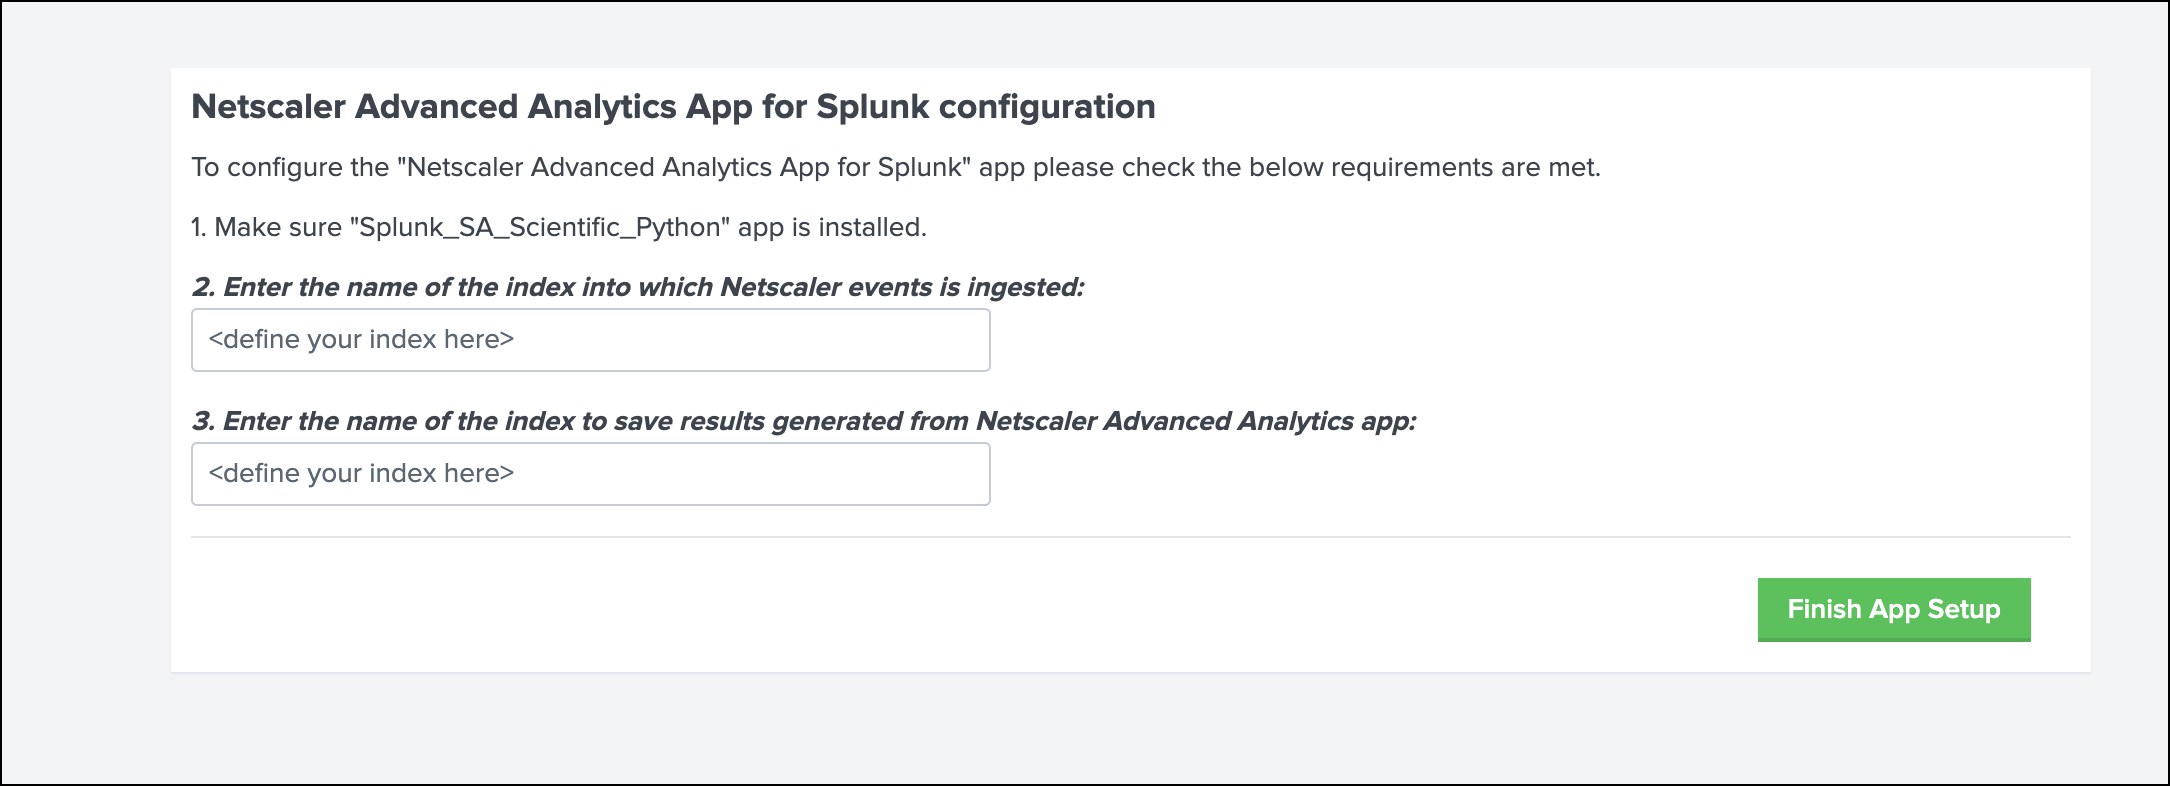
-
Click Finish App Setup.
- Once the upload is complete, navigate to Apps and click NetScaler advanced analytics.
Note:
It takes a minimum of 20 days for the apps to start forecasting the anomalies.
NetScaler advanced analytics dashboards on Splunk
NetScaler advanced analytics insights consist of several dashboards that provide data on various use cases.
Unusually large download transactions
You can use the Unusually large download transactions dashboard to analyze the transactions that have unusually high data downloaded from the applications.
Example: If an attacker manages to break into an application and attempts to download a large database containing sensitive information, then this scenario is captured as an anomaly in the Unusually large download transactions dashboard. Using the dashboard you can get the details of the transaction, such as client IP address, event time, request URL, and user agent.
You can filter the data based on the following categories:
- Time
- NetScaler IP address
- Application name
For a selected time frame, the dashboard displays the top client IP addresses, top UserAgents, and the top URL with anomalies. You can drill down further on the anomaly by filtering the data based on the NetScaler IP address and application name.
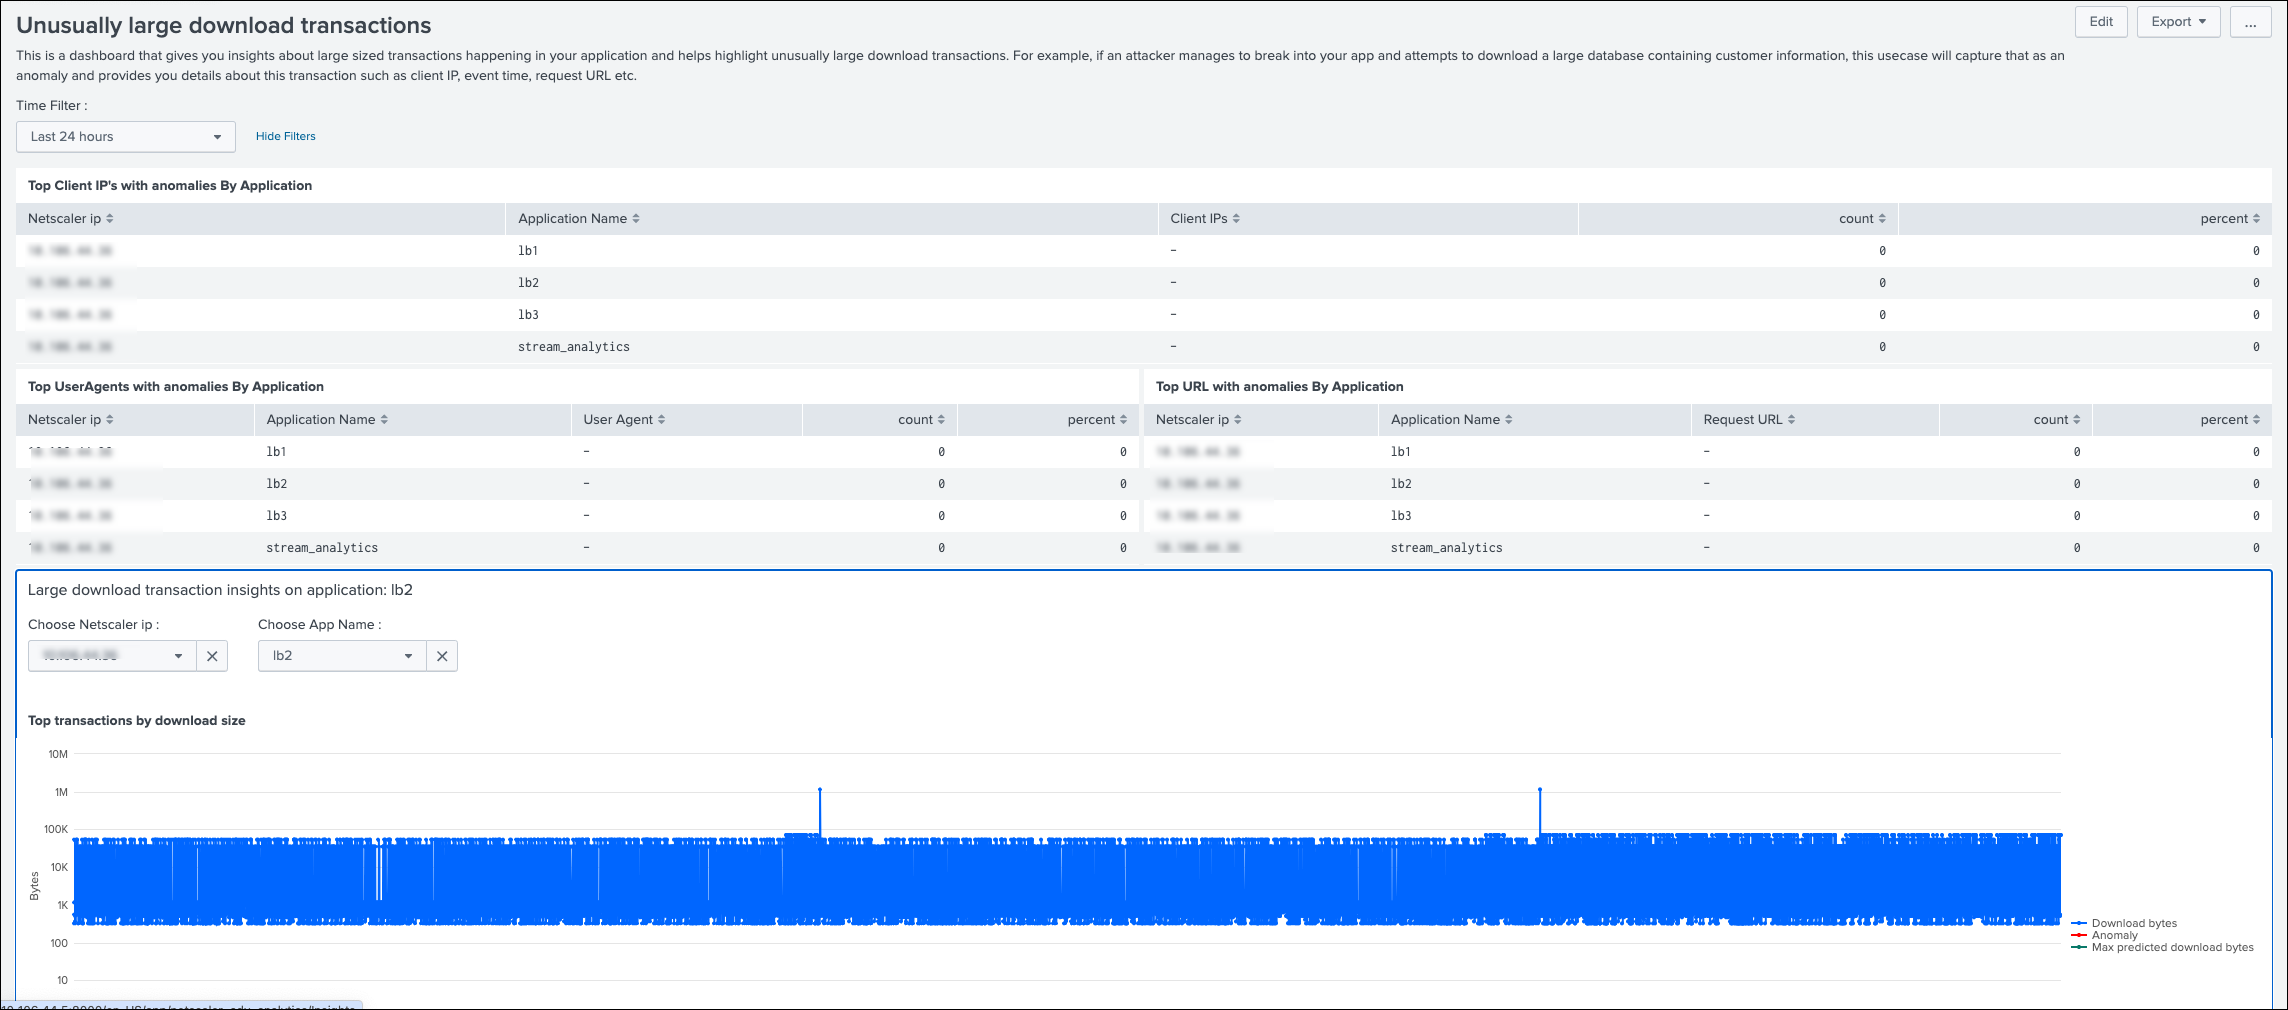
For a selected NetScaler IP address and application name, a graph is displayed that shows all transactions including the ones with high download size. The graph contains the details of downloaded bytes, maximum predicted downloaded bytes, and the anomalies.

You can export the data to PDF, clone the dashboard, and set the dashboard as the home dashboard.
Unusually large upload transactions
You can use the Unusually large upload transactions dashboard to analyze the transactions that have unusually high data upload to the application.
Example: If an attacker manages to break into an application and attempts to upload huge files hoping to exhaust storage, then this scenario is reported as an anomaly in the Unusually large upload transactions dashboard. Using this dashboard you can get the details of the anomalous transaction, such as client IP address, event time, request URL, and user agent.
You can filter the data based on the following categories:
- Time
- NetScaler IP address
- Application name
For a selected time frame, the dashboard displays the top client IP addresses, top User agents, and the top URL with anomalies. You can drill down further on the anomaly by filtering the data based on NetScaler IP address and application name.
For a selected NetScaler IP address and application name, a graph is displayed that shows all transactions including the ones with high upload size. The graph contains the details of uploaded bytes, maximum predicted uploaded bytes, and the anomalies.
You can export the data to PDF, clone the dashboard, and set the dashboard as the home dashboard.
Traffic surge - download volume
You can use the Traffic surge - download volume dashboard to analyze abnormal scenarios of data download from the application through bots. The dashboard highlights if there is an unusual increase in the download rate.
Example: If a user or a bot attempts to download a high volume of data quicker than the usual download rate, then this scenario is considered as a traffic surge and reported as an anomaly. Consider that the average download data per day is 500 MB and if a bot tries to download 2 GB data, then this scenario is considered as unusually high download data volume.
You can filter the data based on the following categories:
- Time
- NetScaler IP address
- Application name
For a selected time frame, the dashboard displays the list of NetScaler IP addresses and application names that have reported anomalies. You can drill down further on the anomaly by filtering the data based on the NetScaler IP address and application name.
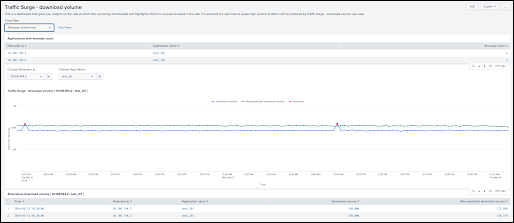
For a selected NetScaler IP address and application name, a graph is displayed that shows the data download, maximum predicted data download, and the anomalies.
You can export the data to PDF, clone the dashboard, and set the dashboard as the home dashboard.
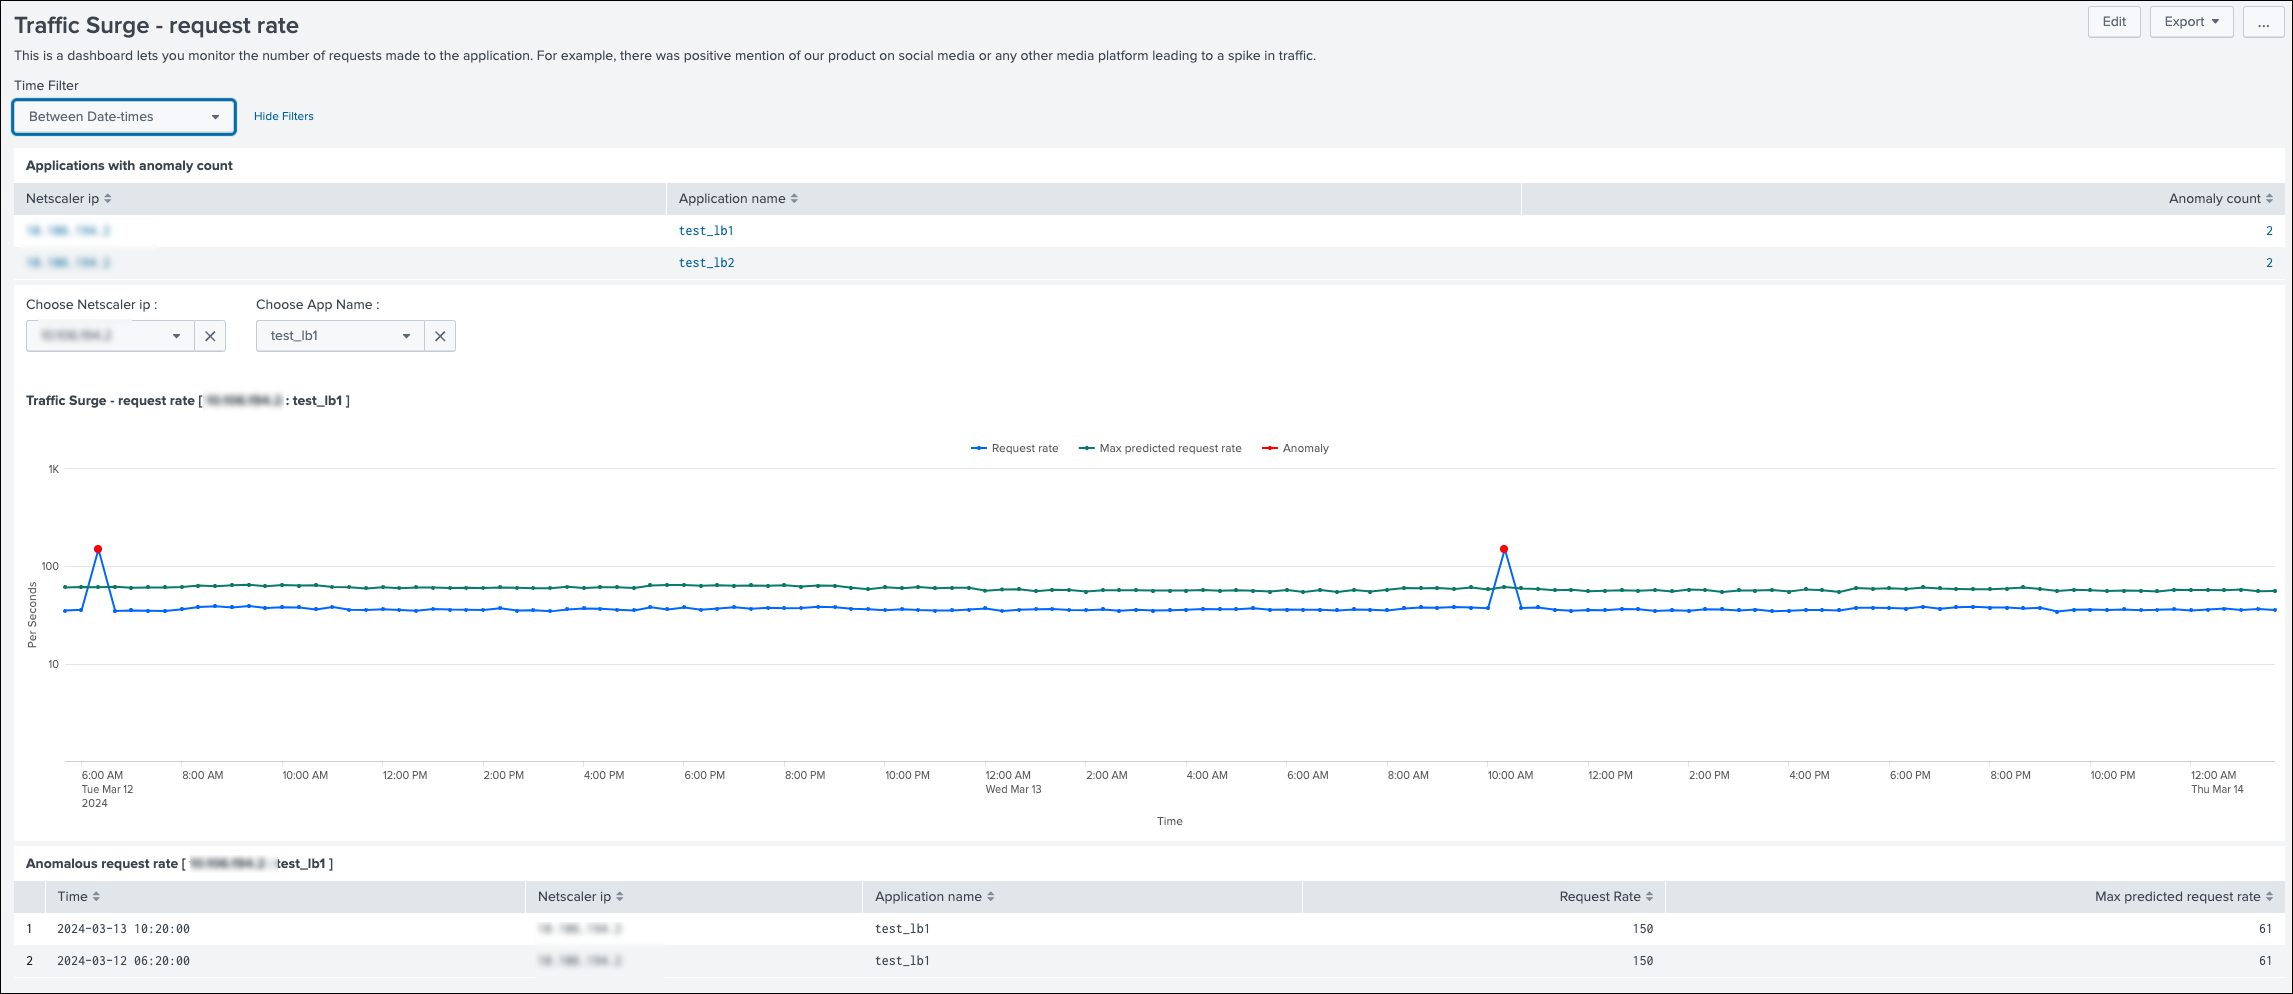
Traffic surge - request rate
You can use the Traffic surge - request rate dashboard to analyze the unusual request rates received by an application. You can control the incoming and outgoing traffic from or to an application. A bot attack can perform an unusual high request rate.
Example: If you configure an application to allow 100 requests per minute and if you observe 350 requests per minute, then this scenario is considered as a possible bot attack and reported as an anomaly.
You can filter the data based on the following categories:
- Time
- NetScaler IP address
- Application name
You can drill down further on the anomaly by filtering the data based on the NetScaler IP address and application name.
For a selected NetScaler IP address and application name, a graph is displayed that shows the request rate, maximum predicted request rate, and the anomalies.
You can export the data to PDF, clone the dashboard, and set the dashboard as the home dashboard.
Share
Share
This Preview product documentation is Cloud Software Group Confidential.
You agree to hold this documentation confidential pursuant to the terms of your Cloud Software Group Beta/Tech Preview Agreement.
The development, release and timing of any features or functionality described in the Preview documentation remains at our sole discretion and are subject to change without notice or consultation.
The documentation is for informational purposes only and is not a commitment, promise or legal obligation to deliver any material, code or functionality and should not be relied upon in making Cloud Software Group product purchase decisions.
If you do not agree, select I DO NOT AGREE to exit.