-
Getting Started with NetScaler
-
Deploy a NetScaler VPX instance
-
Optimize NetScaler VPX performance on VMware ESX, Linux KVM, and Citrix Hypervisors
-
Apply NetScaler VPX configurations at the first boot of the NetScaler appliance in cloud
-
Configure simultaneous multithreading for NetScaler VPX on public clouds
-
Install a NetScaler VPX instance on Microsoft Hyper-V servers
-
Install a NetScaler VPX instance on Linux-KVM platform
-
Prerequisites for installing NetScaler VPX virtual appliances on Linux-KVM platform
-
Provisioning the NetScaler virtual appliance by using OpenStack
-
Provisioning the NetScaler virtual appliance by using the Virtual Machine Manager
-
Configuring NetScaler virtual appliances to use SR-IOV network interface
-
Configure a NetScaler VPX on KVM hypervisor to use Intel QAT for SSL acceleration in SR-IOV mode
-
Configuring NetScaler virtual appliances to use PCI Passthrough network interface
-
Provisioning the NetScaler virtual appliance by using the virsh Program
-
Provisioning the NetScaler virtual appliance with SR-IOV on OpenStack
-
Configuring a NetScaler VPX instance on KVM to use OVS DPDK-Based host interfaces
-
-
Deploy a NetScaler VPX instance on AWS
-
Deploy a VPX high-availability pair with elastic IP addresses across different AWS zones
-
Deploy a VPX high-availability pair with private IP addresses across different AWS zones
-
Protect AWS API Gateway using the NetScaler Web Application Firewall
-
Configure a NetScaler VPX instance to use SR-IOV network interface
-
Configure a NetScaler VPX instance to use Enhanced Networking with AWS ENA
-
Deploy a NetScaler VPX instance on Microsoft Azure
-
Network architecture for NetScaler VPX instances on Microsoft Azure
-
Configure multiple IP addresses for a NetScaler VPX standalone instance
-
Configure a high-availability setup with multiple IP addresses and NICs
-
Configure a high-availability setup with multiple IP addresses and NICs by using PowerShell commands
-
Deploy a NetScaler high-availability pair on Azure with ALB in the floating IP-disabled mode
-
Configure a NetScaler VPX instance to use Azure accelerated networking
-
Configure HA-INC nodes by using the NetScaler high availability template with Azure ILB
-
Configure a high-availability setup with Azure external and internal load balancers simultaneously
-
Configure a NetScaler VPX standalone instance on Azure VMware solution
-
Configure a NetScaler VPX high availability setup on Azure VMware solution
-
Configure address pools (IIP) for a NetScaler Gateway appliance
-
Deploy a NetScaler VPX instance on Google Cloud Platform
-
Deploy a VPX high-availability pair on Google Cloud Platform
-
Deploy a VPX high-availability pair with external static IP address on Google Cloud Platform
-
Deploy a single NIC VPX high-availability pair with private IP address on Google Cloud Platform
-
Deploy a VPX high-availability pair with private IP addresses on Google Cloud Platform
-
Install a NetScaler VPX instance on Google Cloud VMware Engine
-
-
Solutions for Telecom Service Providers
-
Load Balance Control-Plane Traffic that is based on Diameter, SIP, and SMPP Protocols
-
Provide Subscriber Load Distribution Using GSLB Across Core-Networks of a Telecom Service Provider
-
Authentication, authorization, and auditing application traffic
-
Basic components of authentication, authorization, and auditing configuration
-
Web Application Firewall protection for VPN virtual servers and authentication virtual servers
-
On-premises NetScaler Gateway as an identity provider to Citrix Cloud
-
Authentication, authorization, and auditing configuration for commonly used protocols
-
Troubleshoot authentication and authorization related issues
-
-
-
-
-
-
Configure DNS resource records
-
Configure NetScaler as a non-validating security aware stub-resolver
-
Jumbo frames support for DNS to handle responses of large sizes
-
Caching of EDNS0 client subnet data when the NetScaler appliance is in proxy mode
-
Use case - configure the automatic DNSSEC key management feature
-
Use Case - configure the automatic DNSSEC key management on GSLB deployment
-
-
-
Persistence and persistent connections
-
Advanced load balancing settings
-
Gradually stepping up the load on a new service with virtual server–level slow start
-
Protect applications on protected servers against traffic surges
-
Retrieve location details from user IP address using geolocation database
-
Use source IP address of the client when connecting to the server
-
Use client source IP address for backend communication in a v4-v6 load balancing configuration
-
Set a limit on number of requests per connection to the server
-
Configure automatic state transition based on percentage health of bound services
-
-
Use case 2: Configure rule based persistence based on a name-value pair in a TCP byte stream
-
Use case 3: Configure load balancing in direct server return mode
-
Use case 6: Configure load balancing in DSR mode for IPv6 networks by using the TOS field
-
Use case 7: Configure load balancing in DSR mode by using IP Over IP
-
Use case 10: Load balancing of intrusion detection system servers
-
Use case 11: Isolating network traffic using listen policies
-
Use case 12: Configure Citrix Virtual Desktops for load balancing
-
Use case 13: Configure Citrix Virtual Apps and Desktops for load balancing
-
Use case 14: ShareFile wizard for load balancing Citrix ShareFile
-
Use case 15: Configure layer 4 load balancing on the NetScaler appliance
-
-
-
-
-
Authentication and authorization for System Users
-
-
-
Configuring a CloudBridge Connector Tunnel between two Datacenters
-
Configuring CloudBridge Connector between Datacenter and AWS Cloud
-
Configuring a CloudBridge Connector Tunnel Between a Datacenter and Azure Cloud
-
Configuring CloudBridge Connector Tunnel between Datacenter and SoftLayer Enterprise Cloud
-
Configuring a CloudBridge Connector Tunnel Between a NetScaler Appliance and Cisco IOS Device
-
CloudBridge Connector Tunnel Diagnostics and Troubleshooting
This content has been machine translated dynamically.
Dieser Inhalt ist eine maschinelle Übersetzung, die dynamisch erstellt wurde. (Haftungsausschluss)
Cet article a été traduit automatiquement de manière dynamique. (Clause de non responsabilité)
Este artículo lo ha traducido una máquina de forma dinámica. (Aviso legal)
此内容已经过机器动态翻译。 放弃
このコンテンツは動的に機械翻訳されています。免責事項
이 콘텐츠는 동적으로 기계 번역되었습니다. 책임 부인
Este texto foi traduzido automaticamente. (Aviso legal)
Questo contenuto è stato tradotto dinamicamente con traduzione automatica.(Esclusione di responsabilità))
This article has been machine translated.
Dieser Artikel wurde maschinell übersetzt. (Haftungsausschluss)
Ce article a été traduit automatiquement. (Clause de non responsabilité)
Este artículo ha sido traducido automáticamente. (Aviso legal)
この記事は機械翻訳されています.免責事項
이 기사는 기계 번역되었습니다.책임 부인
Este artigo foi traduzido automaticamente.(Aviso legal)
这篇文章已经过机器翻译.放弃
Questo articolo è stato tradotto automaticamente.(Esclusione di responsabilità))
Translation failed!
How to record a packet trace on NetScaler
You can record a packet trace using the NetScaler GUI. The trace is stored in nstrace.cap.
- Navigate to System > Diagnostics.
- Click Start new trace under Technical Support Tools.
-
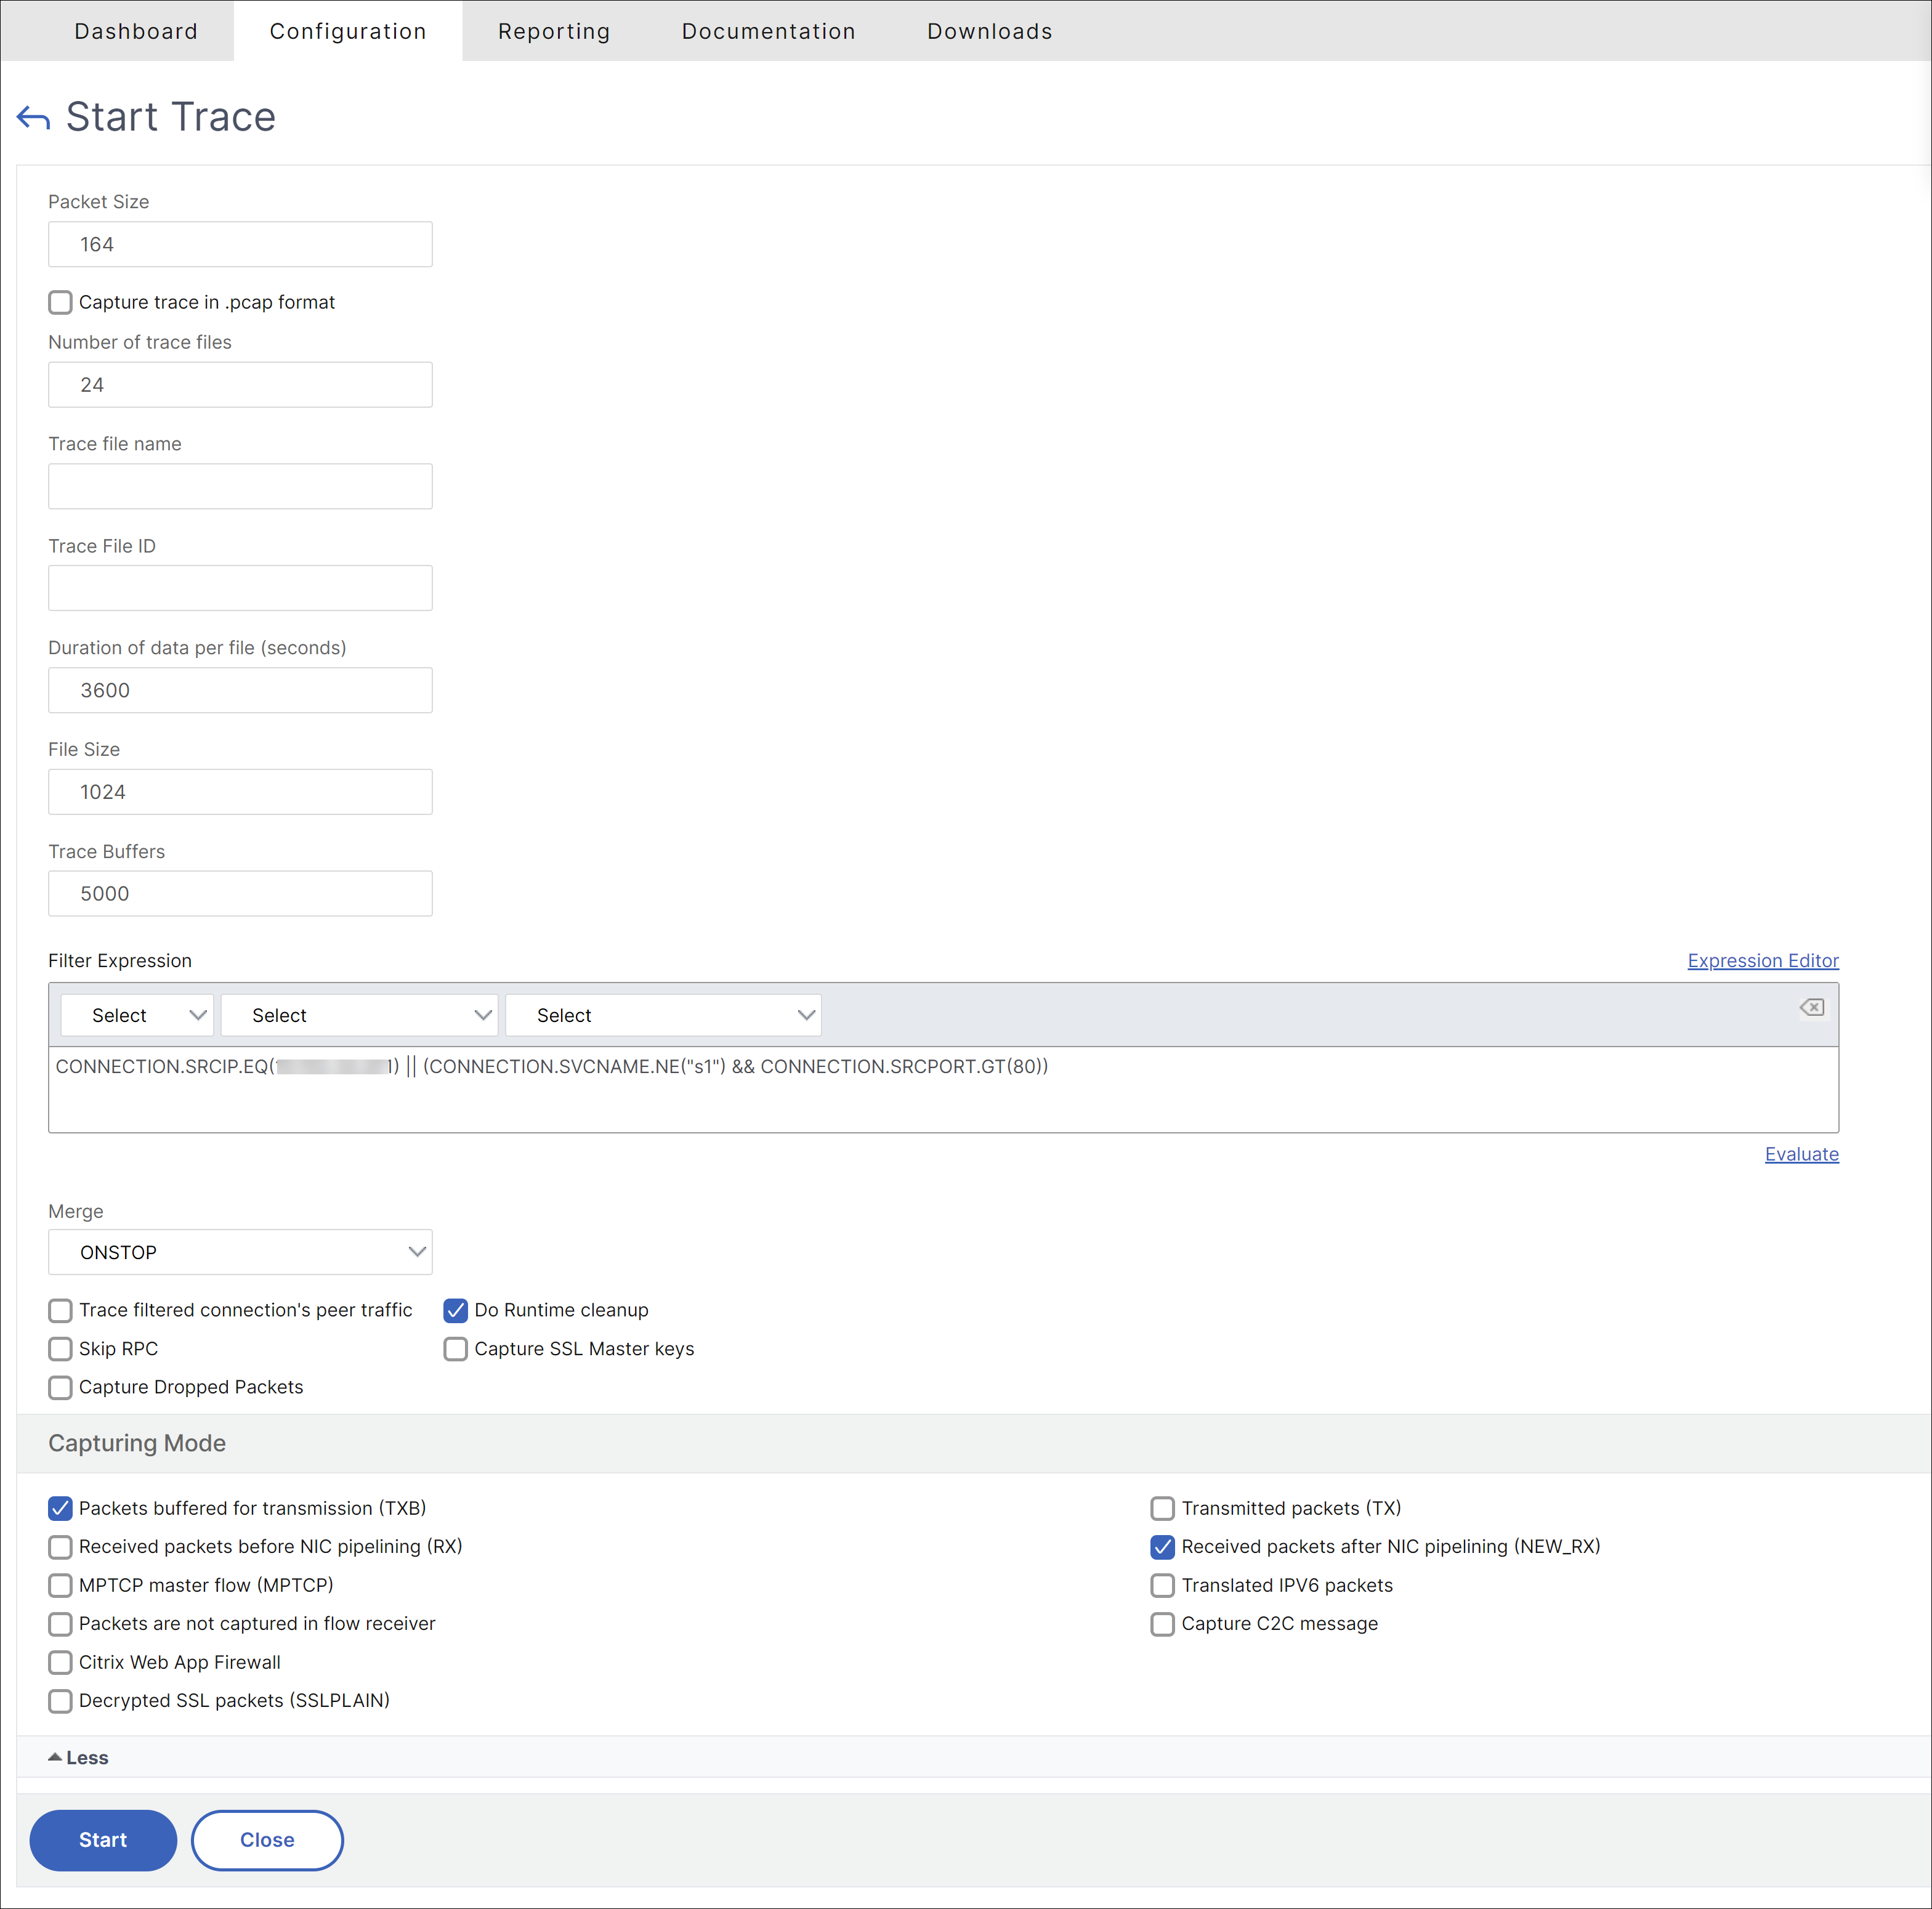
In the Start Trace page update the following fields:
-
Packet Size - Enter the size of the packet to capture during the trace. Enter 0 for full packet trace.
- Default value: 164
- Minimum value: 0
- Maximum value: 1514
-
Capture trace in .pcap format - You have the option to capture a packet trace in nstrace (.cap) or TCP dump (.pcap) format. By default, the packet trace is captured in nstrace format (.cap) and it is the recommended format. To capture trace in TCP dump format, select Capture trace in .pcap format.
-
Capture SSL Master keys - To analyze the traces better, enable the Capture SSL Master keys option. This setting captures SSL keys for the current session, which are necessary to decrypt encrypted data. The SSL keys are stored in a file named
nstrace.sslkeys.- When you click Start to initiate the trace with the Capture SSL Master keys option enabled, a security warning message is displayed. Acknowledge this warning to proceed.
- The SSL session keys generated are an alternative to the private key and can be used when the private key is either unavailable or cannot be shared. You can use these keys to decrypt only the NS trace. This method can decrypt RSA and Diffie-Hellman-based key exchanges (such as DHE or ECDHE).
-
Number of trace files - Enter the number of trace files to be generated during the trace.
- Default value: 24
- Minimum value: 1
- Maximum value: 100
- Trace File name - Enter the name for the trace file.
- Trace File ID - Enter the file ID for the trace file.
-
Duration of data per file (seconds) - Enter the time (in seconds) to capture the data for each trace file.
- Default value: 3600
- Minimum value: 1
-
File size - Enter the file size (in MB) for each trace file.
- Default value: 1024
- Minimum value: 0
- Maximum value: 10240
When the trace reaches the specified file size, a new trace starts. If the free disk space is less than 2 GB, the trace stops.
-
Trace Buffers - Enter the number of trace buffers (temporary storage) to store the packet capture. Each buffer is about 16 KB.
- Default value: 5000
- Minimum value: 1000
-
-
Enter the Filter Expression.
Adding filter expressions for IP address, port, VLAN, or interface ensures capturing only the relevant traffic and reduces the load on NetScaler during the packet trace.
-
Select the Merge option from the list.
- ONSTOP - The temporary trace files are merged into a single trace file.
- NOMERGE - The trace files are not merged.
- ONTHEFLY - The trace files are merged without creating any temporary file.
Default value: ONSTOP
-
Select the relevant option from the additional packet capture options available.
Default value: Do Runtime cleanup
-
Select the required options in Capturing Mode.
By default, Packets buffered for Transmission (TXB) and Receive packets after NIC pipelining (NEW_RX) are selected. To decrypt the trace without a private key, select Decrypted SSL packets (SSLPLAIN).
-
Click Start to start recording the network packet trace.
-
In the Stop Trace page, click Stop and Download to stop recording the network packet trace after the test is complete.
-
In the Delete/Download Trace files page, select the file, click Download, and then click Close.
Open the trace file with the Wireshark utility to display the content of the file.
We recommend you to use the recent Wireshark version from the automated build section available in the following webpage: http://www.wireshark.org/download/automated.
Use case to capture a packet trace with virtual server IP filter (both front-end and back end)
Using a filter of the virtual server IP address and enabling the option “–link” in CLI or selecting the option Trace filtered connection’s peer traffic in the GUI, you can capture both the front-end and back-end traffic for the IP address.
start nstrace -size 0 -filter "CONNECTION.IP.EQ(1.1.1.1)" -link ENABLED

show nstrace
        State:  RUNNING          Scope:  LOCAL            TraceLocation:  "/var/nstrace/24Mar2017_16_00_19/..." Nf:  24                  Time:  3600              Size:  0                 Mode:  TXB NEW_RX
        Traceformat:  NSCAP      PerNIC:  DISABLED        FileName:  24Mar2017_16_00_19 Filter:  "CONNECTION.IP.EQ(1.1.1.1)" Link:  ENABLED           Merge:  ONSTOP           Doruntimecleanup:  ENABLED
        TraceBuffers:  5000      SkipRPC:  DISABLED       Capsslkeys:  DISABLED    InMemoryTrace:  DISABLED
Capturing cyclic traces
It is always challenging to troubleshoot an intermittent issue. Cyclic tracing is best suited for issues which are intermittent. The traces can be run over a span of few hours or days before the issue occurs. Also, you can use a specific filter and evaluate the size of the trace files that are generated before you run it for a longer time.
Run the following command from the CLI:
start nstrace -nf 60 -time 30 -size 0
This particular trace will create 60 files each of them for 30 sec. This means the files will start getting overwritten after 60 trace files or 30 mins

show nstrace - To check the status of the nstrace
stop nstrace - To stop the nstrace.
Best Practices
On a unit handling GB of traffic per second, capturing traffic is a very resource intensive process. The impact to resources is mainly in terms of the CPU and the disk space. Disk space impact can be reduced by using filtering expressions. However, the impact on the CPU remains and sometimes causes a slight increase as the appliance now needs to process packets according to the filter before capturing them.
The best practice about tracing is:
- The duration for which the trace is run must be as limited as possible when you still ensure that the relevant packets are captured.
- Schedule the tracing activity to happen at a time when the number of users (and hence the traffic) is greatly reduced, such as during off hours.
This Preview product documentation is Cloud Software Group Confidential.
You agree to hold this documentation confidential pursuant to the terms of your Cloud Software Group Beta/Tech Preview Agreement.
The development, release and timing of any features or functionality described in the Preview documentation remains at our sole discretion and are subject to change without notice or consultation.
The documentation is for informational purposes only and is not a commitment, promise or legal obligation to deliver any material, code or functionality and should not be relied upon in making Cloud Software Group product purchase decisions.
If you do not agree, select I DO NOT AGREE to exit.