Diagnose Session Performance issues
The Session Performance tab on the User Details Page has enhanced troubleshooting workflows to help identify issues within HDX™ user sessions. The Session Topology and Performance Metrics panels help correlate the component view and multiple performance metrics of a session in a single view and reduces the mean time for resolution of session experience issues.
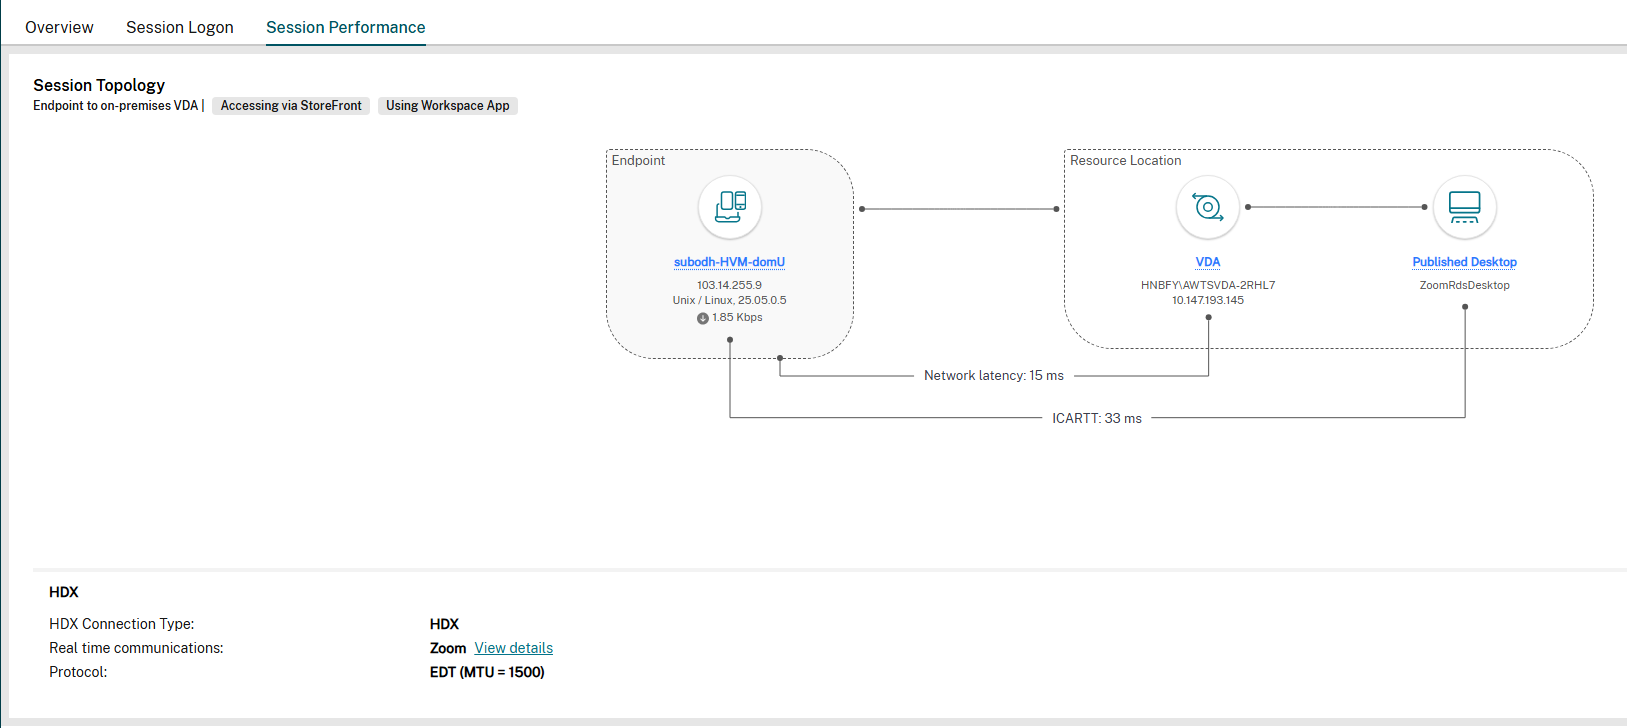
End-to-end Network Hop view
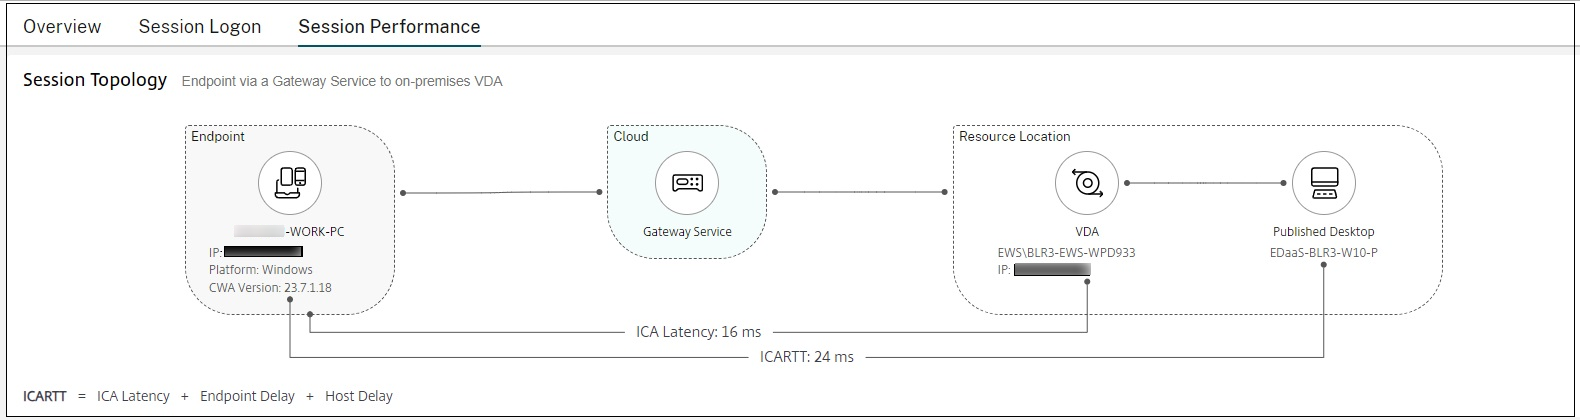
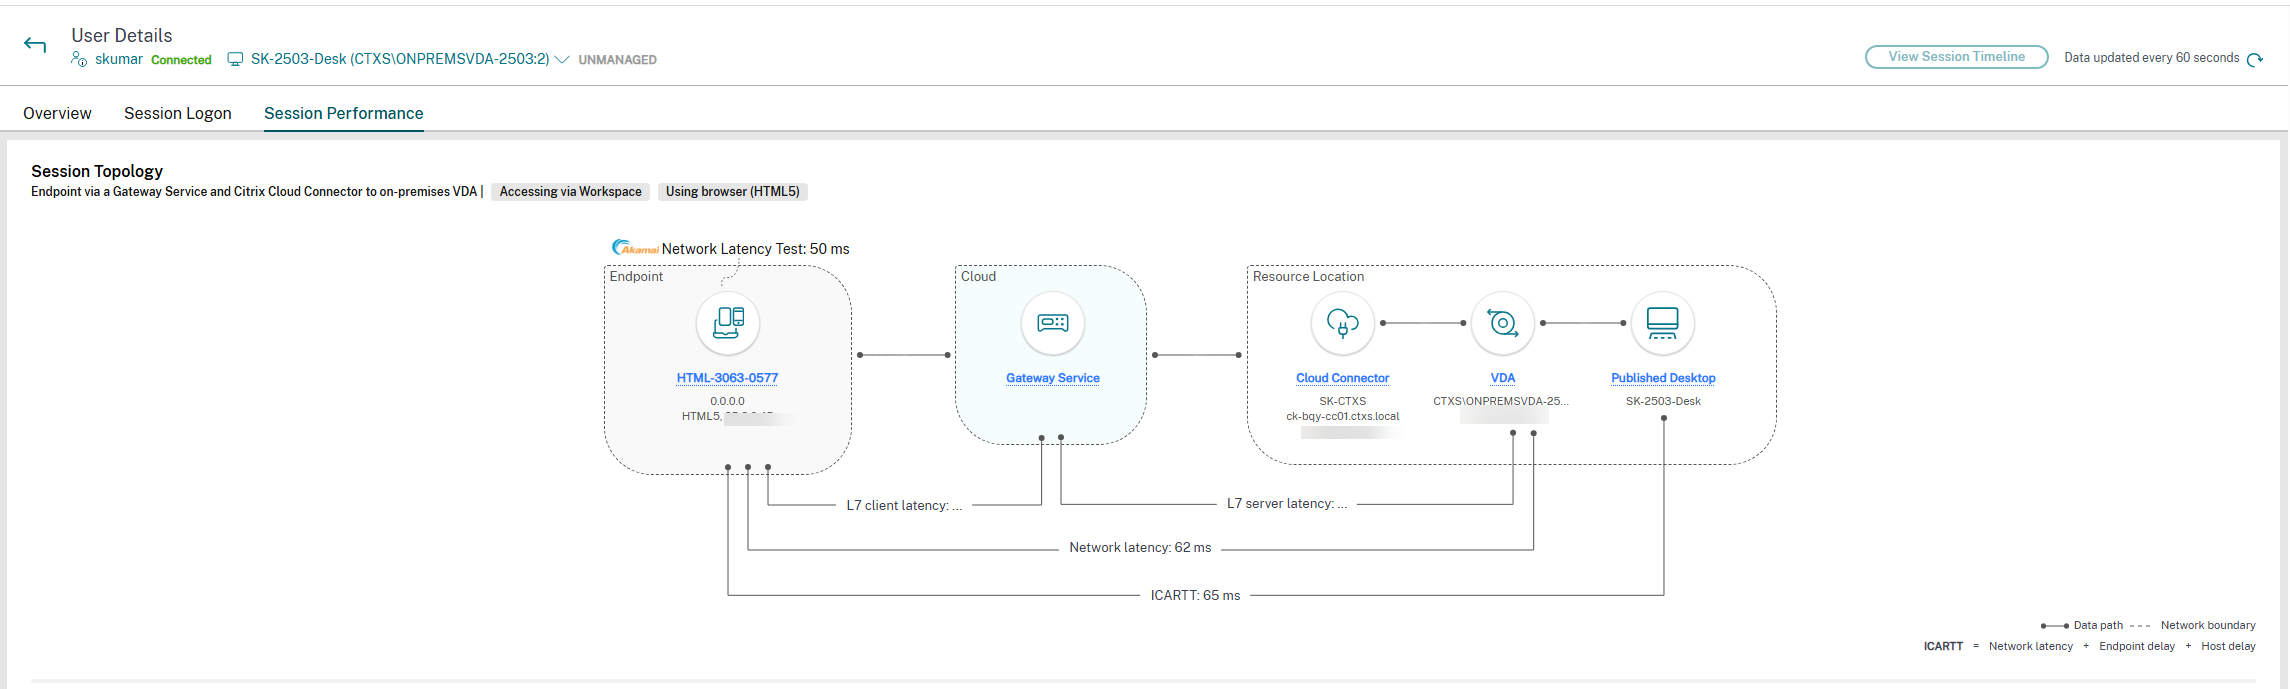
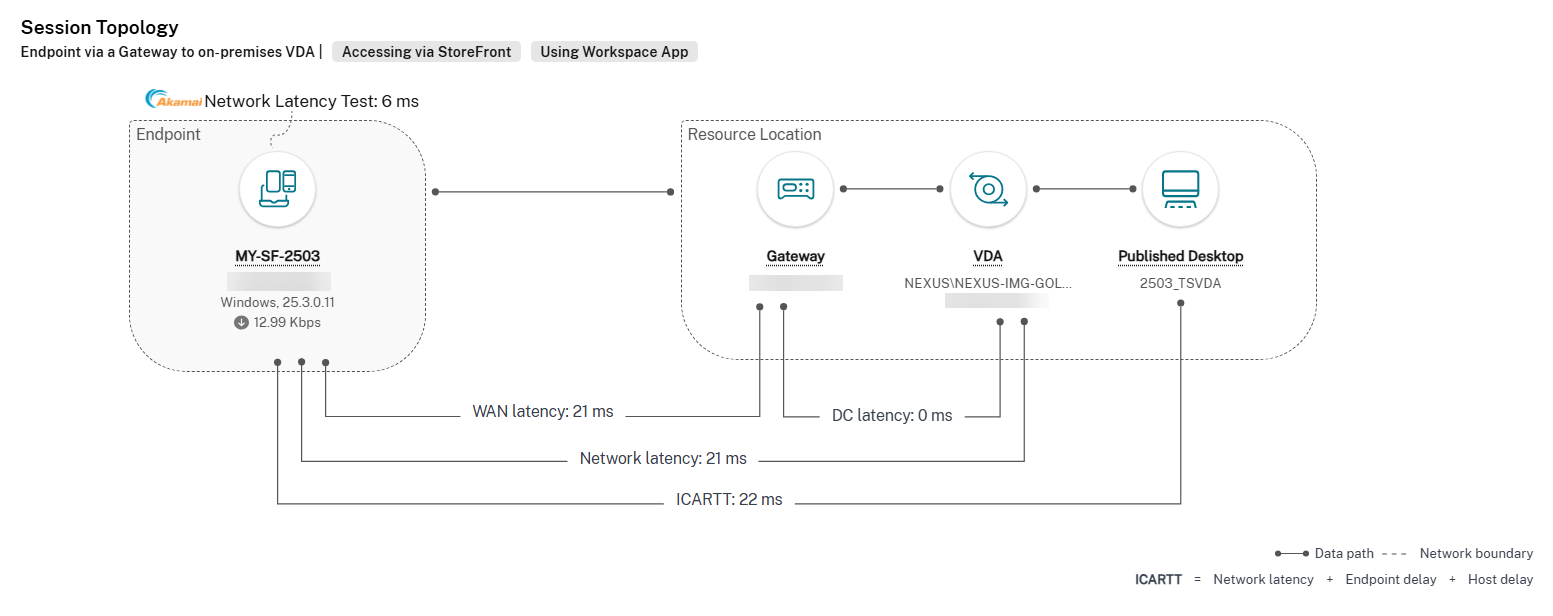
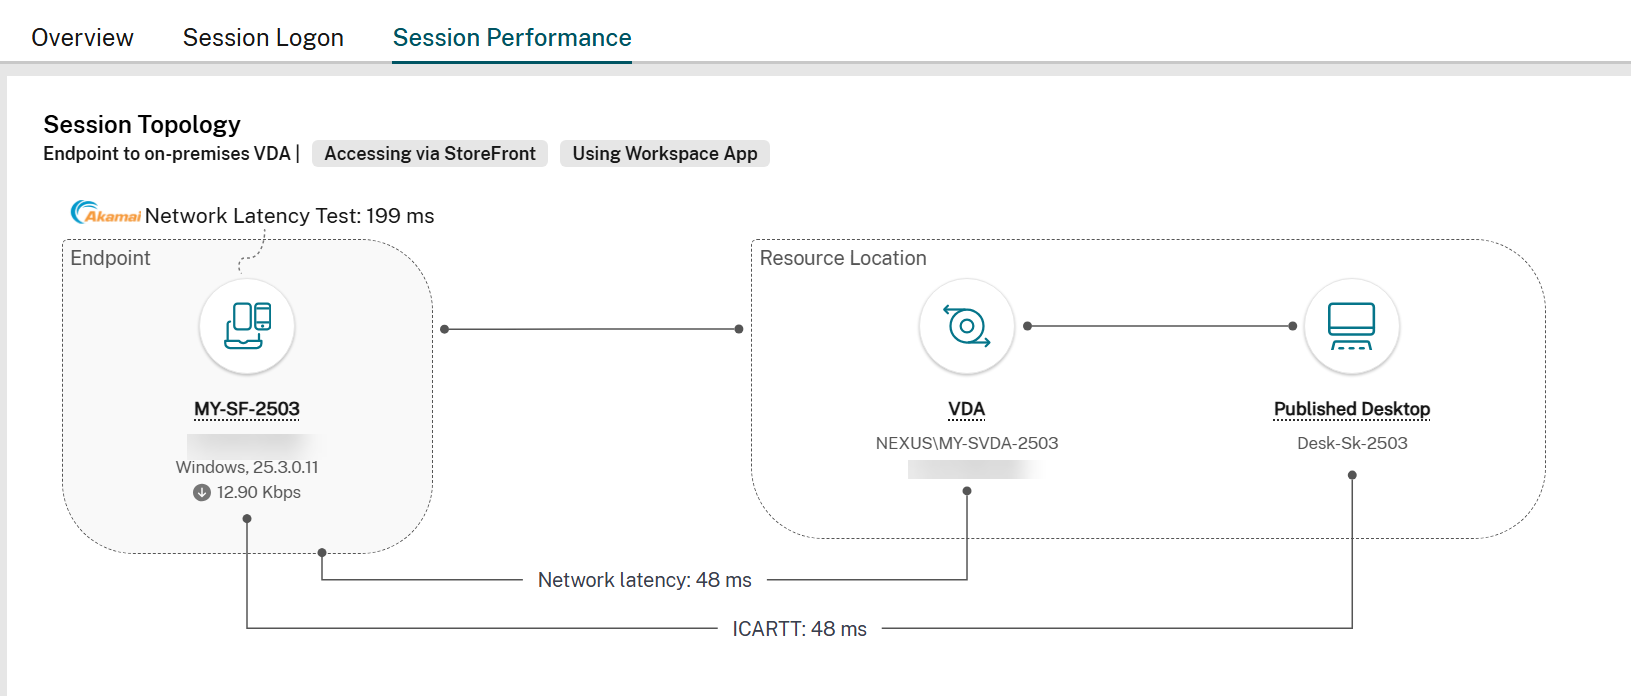
The end-to-end network hop view offers a visual representation of the complete session path, significantly aiding in troubleshooting. You can access this view from User Details > Session Performance > Session Topology. The end-to-end network hop view displays components, metadata, links, and published applications for connected HDX sessions.
This view helps administrators to:
- Understand session data flow.
- Identify performance bottlenecks at specific hops.
Session Performance metrics
The following metrics are available contextually to help administrators understand the performance of the given session. The metrics presented in the end-to-end network hop view are available in near real-time and refresh periodically based on the intervals shown in the UI.
Endpoint metrics
Endpoint metrics are vital for troubleshooting Citrix® session performance as they provide insights into the “last mile” of the user experience and reveal details about the user’s immediate environment. These metrics help identify local bottlenecks, such as poor Wi-Fi, low network throughput, endpoint device limitations, distinguishing between server-side and client-side problems. By offering a holistic view when combined with metrics in the session topology, endpoint data enables faster root cause identification and quicker resolution of performance issues, improving the user experience.
Use the policies in Citrix Studio to enable or disable collection of listed endpoint metrics based on your requirements. The policies provide Citrix administrators granular controls to report metrics in adherence to your compliance requirements.
| Policy name | Policy Description | UI metrics | Default value | Value options | Virtual Delivery Agent version |
|---|---|---|---|---|---|
| Endpoint statistics interval | Allows the collection of endpoint network details from the user endpoint. Enabling this policy is a pre-requisite for other endpoint related policies to take effect. | Wi-Fi signal strength, Network interface type, Throughput incoming or outgoing, Link speed, Workspace type, Endpoint CPU, Endpoint memory, Endpoint GPU | Enabled | Enabled or Disabled. Option to modify the frequency between 60s - 3600s. 60s is suggested value | 2407 or later |
| Endpoint location data collection | Allows the collection of endpoint location and ISP details from the user endpoint using the Locus service - https://locus.analytics.cloud.com | Public IP address, Country, City, and Internet Service Provider. | Disabled | Enabled or Disabled | 2411 or later |
| Endpoint network latency measurement interval | Allows the measurement and collection of network latency between the endpoint and the beacon host - https://downloadplugins.citrix.com | Network latency (under Endpoint network details) | Disabled | Enabled or Disabled. Option to modify the frequency between 60s - 3600s. 60s is suggested value | 2411 or later |
Note:
From Citrix Virtual Apps and Desktops™ 2507 or later, Endpoint location data collection policy and Endpoint network latency measurement interval policy are disabled by default. Consequently, the related data is unavailable in Director unless these policies are manually enabled in Studio.
Endpoint metrics that are readily available are listed below:
- Endpoint name
- Endpoint IP
- Endpoint OS
- Citrix Workspace™ app version
The following table lists metrics dependent on supported product versions:
| Feature name | UI parameters | VDA Windows version | VDA Mac version | VDA Linux version | Citrix Workspace app for Windows version | Citrix Workspace app for Mac version | Citrix Workspace app for Linux version | Citrix Workspace app for HTML5 version | Citrix Workspace app for ChromeOS version |
|---|---|---|---|---|---|---|---|---|---|
| Endpoint network details | Network interface type | 2407 or later | NA | NA | 2405.10 or later | 2409 or later | 2408 or later | 2411 or later | 2411 or later |
| Signal strength | 2407 or later | NA | NA | 2405.10 or later | 2409 or later | 2408 or later | Not applicable | Not applicable | |
| Endpoint throughput (incoming, outgoing) | 2407 or later | NA | NA | 2405.10 or later | 2409 or later | 2408 or later | Not applicable | Not applicable | |
| Link speed | 2407 or later | NA | NA | 2405.10 or later | 2409 or later | 2408 or later | 2411 or later | 2411 or later | |
| Endpoint public IP address | 2411 or later | NA | NA | 2409 or later | 2409 or later | 2408 or later | 2411 or later | 2411 or later | |
| Endpoint City, Endpoint country | 2411 or later | NA | NA | 2409 or later | 2409 or later | 2408 or later | 2411 or later | 2411 or later | |
| Internet service provider | 2411 or later | NA | NA | 2409 or later | 2409 or later | 2408 or later | 2411 or later | 2411 or later | |
| Workspace type | 2411 or later | NA | NA | 2409 or later | 2409 or later | 2408 or later | 2411 or later | 2411 or later | |
| Access type (via Workspace / StoreFront) | 2411 or later | NA | NA | 2409 or later | 2409 or later | 2408 or later | 2411 or later | 2411 or later | |
| Endpoint CPU | 2411 or later | NA | NA | 2409 or later | 2409 or later | 2408 or later | Not applicable | 2411 or later | |
| Endpoint memory | 2411 or later | NA | NA | 2409 or later | 2409 or later | 2408 or later | Not applicable | 2411 or later | |
| Endpoint GPU | 2411 or later | NA | NA | 2409 or later | 2409 or later | 2408 or later | Not applicable | Not applicable | |
| Network latency | 2411 or later | NA | NA | 2409 or later | 2409 or later | 2408 or later | 2411 or later | 2411 or later |
Data definitions:
| UI parameter | Description |
|---|---|
| Endpoint name | Name of the user’s endpoint device used for the session. |
| Endpoint IP | IP address of the endpoint as available to the Virtual Delivery Agent (VDA). It might contain private or public IP addresses of the endpoint device. |
| Endpoint OS | Operating system of the endpoint device |
| Citrix Workspace App version | Installed Citrix Workspace app version |
| Signal strength | Displays the quality and strength of the wireless signal. |
| Endpoint throughput (incoming, outgoing) | Indicates the rate of data transfer into and out of the network interface. Analogous to the upload and download internet speed observed on the endpoint. |
| Link speed | Specifies the type of network connection, such as Ethernet, Wi-Fi, or cellular. |
| Network interface type | Represents the maximum data transfer rate of the network connection. |
| Endpoint public IP address | The external IP address assigned to your device by your internet service provider. |
| Endpoint City, Endpoint country | The geographical location, including country and city, of the device. |
| Internet service provider | The name of the company that provides internet access to the end user device. |
| Workspace type | The type of workspace being used, either Citrix Workspace app or a web browser. |
| Access type (via Workspace / StoreFront) | The method of accessing resources, either through Citrix Workspace or StoreFront. |
| Endpoint CPU | The percentage of CPU resources currently being used. |
| Endpoint memory | The percentage of memory resources currently being used. |
| Endpoint GPU | The percentage of GPU resources currently being used. |
| Network latency test | The time delay experienced in the network, measured in milliseconds. |
Network metrics
Network metrics are critical for Citrix session troubleshooting because the performance and stability of a Citrix session are heavily dependent on the underlying network conditions. Unlike a local application, a Citrix session involves streaming an interactive desktop or application experience over a network, meaning any network instability or bottleneck will directly impact the user’s perception of performance.
Use the policies in Citrix Studio to enable or disable collection of listed network metrics based on your requirements. The policies provide Citrix administrators granular controls to report metrics in adherence to your compliance requirements.
| Policy name | Policy Description | UI metrics | Default value | Value options | Virtual Delivery Agent version |
|---|---|---|---|---|---|
| Network telemetry | Allows the collection of network details between the user endpoint and the backend components. | All HDX insights metrics for Citrix Gateway and Citrix Gateway service | Disabled | Enabled or Disabled. Option to modify the frequency between 60s - 3600s. 60s is suggested value | 2411 or later for Gateway service. 2503 or later for Citrix Gateway |
Citrix Gateway Service
The following table lists metrics dependent on supported product versions:
| Feature name | UI parameters | Windows VDA version | Mac VDA version | Linux VDA version | Citrix Workspace app for Windows version | Citrix Workspace app for Mac version | Citrix Workspace app for Linux version | Citrix Workspace app for HTML5 version | Citrix Workspace app for ChromeOS version |
|---|---|---|---|---|---|---|---|---|---|
| Network metrics
|
L7 Server latency | 2411 or above | 2507 or later | 2507 or later | 2409 or later | 2505 or later | 2505 or later | NA | NA |
| L7 Client latency | 2411 or above | 2507 or later | 2507 or later | 2409 or later | 2505 or later | 2505 or later | NA | NA | |
| Client Side Retransmits Note: Available only for TCP sessions | 2411 or above | 2507 or later | 2507 or later | 2409 or later | 2505 or later | 2505 or later | NA | NA | |
| Throughput | 2411 or above | NA | NA | 2409 or later | 2505 or later | 2505 or later | NA | NA |
Citrix Gateway
The following table lists metrics dependent on supported product versions:
| Feature name | UI parameters | Citrix Gateway version | Windows VDA version | Mac version | Linux version | Citrix Workspace app for Windows version | Citrix Workspace app for Mac version | Citrix Workspace app for Linux version | Citrix Workspace app for HTML5 version | Citrix Workspace app for ChromeOS version |
|---|---|---|---|---|---|---|---|---|---|---|
| Network metrics
|
WAN latency | Netscaler 14.1-47.46 or above | 2503 or later | 2507 or later | 2507 or later | 2503 or later | 2505 or later | 2505 or later | NA | NA |
| DC latency | Netscaler 14.1-47.46 or above | 2503 or later | 2507 or later | 2507 or later | 2503 or later | 2505 or later | 2505 or later | NA | NA | |
| Server Side Retransmits | Netscaler 14.1-47.46 or above | 2503 or later | 2507 or later | 2507 or later | 2503 or later | 2505 or later | 2505 or later | NA | NA | |
| Client Side Retransmits | Netscaler 14.1-47.46 or above | 2503 or later | 2507 or later | 2507 or later | 2503 or later | 2505 or later | 2505 or later | NA | NA | |
| L7 server latency | Netscaler 14.1-47.46 or above | 2503 or later | 2507 or later | 2507 or later | 2503 or later | 2505 or later | 2505 or later | NA | NA | |
| L7 Client latency | Netscaler 14.1-47.46 or above | 2503 or later | 2507 or later | 2507 or later | 2503 or later | 2505 or later | 2505 or later | NA | NA | |
| Client side Zero Window size event | Netscaler 14.1-47.46 or above | 2503 or later | 2507 or later | 2507 or later | 2503 or later | 2505 or later | 2505 or later | NA | NA | |
| Client side fast RTO | Netscaler 14.1-47.46 or above | 2503 or later | 2507 or later | 2507 or later | 2503 or later | 2505 or later | 2505 or later | NA | NA | |
| Server side Zero Window size event | Netscaler 14.1-47.46 or above | 2503 or later | 2507 or later | 2507 or later | 2503 or later | 2505 or later | 2505 or later | NA | NA | |
| Server side fast RTO | Netscaler 14.1-47.46 or above | 2503 or later | 2507 or later | 2507 or later | 2503 or later | 2505 or later | 2505 or later | NA | NA |
Data definitions:
| UI parameter | Description |
|---|---|
| WAN latency | Latency caused by the client side of the network, from NetScaler® to the end user. |
| DC latency | Latency caused by the server side of the network, from NetScaler to backend servers. |
| L7 Client latency | The average L7 latency observed between the ICA® client and the NetScaler instance. This metric is useful in non-Citrix devices that are present in the delivery path. |
| L7 Server latency | The average L7 latency observed between the NetScaler device and the Citrix Virtual App. This metric is useful when non-Citrix devices are present in the delivery path. |
| Client retransmits | The number of packets retransmitted on the connection between NetScaler and the end user. A high value of this metric indicates high bandwidth utilization due to retransmits but does not necessarily mean a poor user experience. Note: For sessions using Gateway service, Client retransmits are only available for TCP sessions. |
| Server side retransmits | The number of packets retransmitted on the connection between NetScaler and the back-end server. |
| Client side zero window count | The number of times the client advertised a zero TCP window. |
| Server side zero window count | The number of times the server advertised a zero TCP window. |
HDX metrics
HDX metrics are fundamental to understanding and troubleshooting the quality of the user’s virtual experience. These metrics directly measure the performance of the ICA/HDX protocol that delivers the virtual session.
| Feature name | UI parameters | Citrix Workspace app for Windows version | Virtual Delivery Agent version |
|---|---|---|---|
| ICA metrics
|
ICA RTT | Citrix Workspace app for Windows version 2405.10 or later
|
Citrix Virtual Apps and Desktops 2407 or later
|
| ICA® Latency |
Note:
ICA metrics are available starting with Citrix Workspace app for Windows version 2405.10 or later, and Citrix Virtual Apps and Desktops 2407 or later. However, updates and fixes to the data are available in recent versions. Refer to the following table for the recommended versions for each data point:
| Feature name | UI parameters | Windows VDA version | Mac VDA version | Linux VDA version | Citrix Workspace app for Windows version | Citrix Workspace app for Mac version | Citrix Workspace app for Linux version | Citrix Workspace app for HTML5 version |
|---|---|---|---|---|---|---|---|---|
| ICA metrics
|
ICA RTT | 2507 or later | NA | NA | 2503 or later | 2503 or later | 2503 or later | 2503 or later |
| Network latency | 2507 or later | NA | NA | 2503 or later | 2503 or later | 2503 or later | 2503 or later | |
| HDX connection type | 2411 or later | NA | NA | 2411 or later | 2411 or later | 2411 or later | 2411 or later | |
| Protocol | 2411 or later | NA | NA | 2411 or later | 2411 or later | 2411 or later | 2411 or later | |
| EDT MTU | 2411 or later | NA | NA | 2411 or later | 2411 or later | 2411 or later | 2411 or later |
Data definitions:
| UI parameter | Description |
|---|---|
| ICA RTT | Measures the time between user action and screen response. Thinwire RTT counter represents this metric starting with Citrix Virtual Apps and Desktops version 2507. Previous versions continue to use the EUEM RTT. |
| Network latency | Indicates network latency and potential slowness. Defined as the sum of client and server side latency starting with Citrix Virtual Apps and Desktops version 2503. Previous versions continue to use HDX latency reported on the VDA. |
| HDX Connection type | Type of HDX connection for the user session. |
| Protocol | Underlying protocol used for the user session. Values can be TCP or EDT. |
| EDT MTU | MTU, referred to as Maximum Transmission Unit, is the largest size of a packet (in bytes) that a network interface can send without needing to fragment it. EDT MTU represents the MTU established for the EDT session of the user. |
Real-time communications optimization visibility
The session topology provides comprehensive visibility into the optimization status of real-time communication (RTC) applications like Microsoft Teams, Zoom, and WebEx within Citrix sessions. It pinpoints whether an application is optimized, and identifies any missing components (such as necessary plugins, plugin management, or platform-specific limitations) that prevent optimal performance.
Benefits:
- Customers get clear assurance regarding RTC application optimization, eliminating guesswork about whether a session is truly optimized.
- Direct insight into missing components to proactively address issues and achieve full optimization.
- Faster troubleshooting improves the user experience for important communication tools.
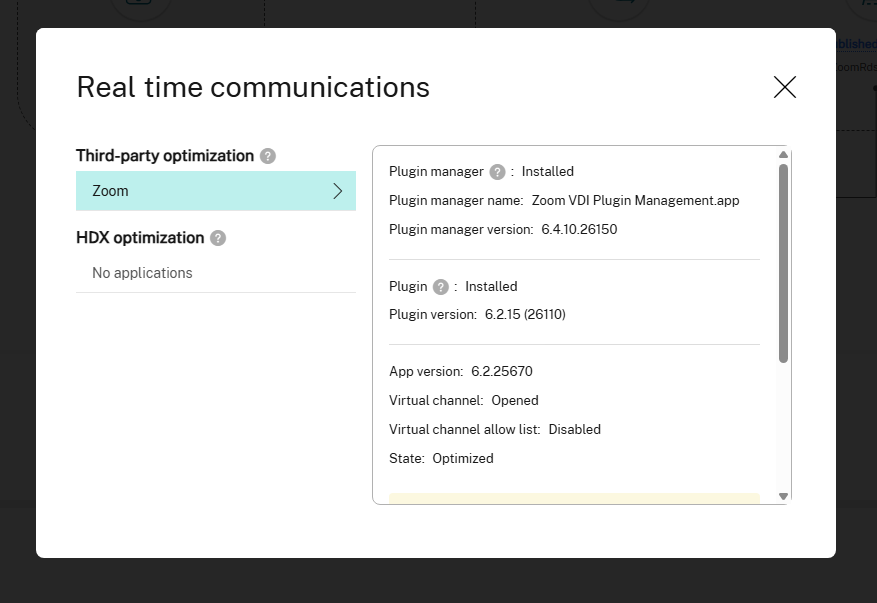
Use the Real time communications field in the Session Topology to view optimization details for each application.
Third-party optimized applications create a virtual channel using Citrix technology, but the application vendor manages other configurations and settings. The optimization relies on solutions owned by the vendor.
Click the View details link next to the Real time communications field in the Session Topology screen. The following screen appears:
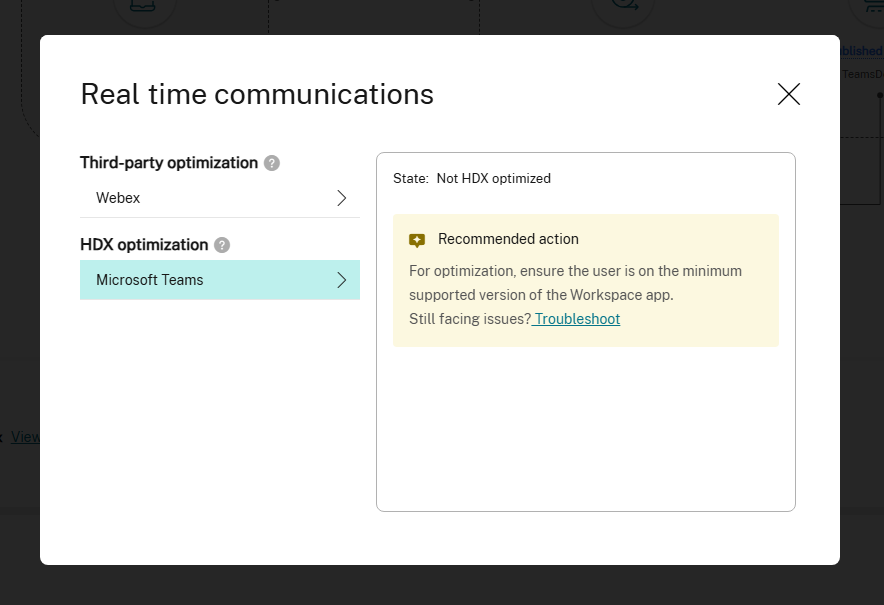
HDX-optimized applications use the Citrix virtual channel and are directly impacted by Citrix configurations and settings.
Click the HDX optimization section on the Real time communications screen. The following image appears:
The real time communications details are updated every 5 minutes. The following table lists available details for an application that relies on third-party optimization. Ensure you are using supported product versions to get full visibility.
Note:
- Microsoft Teams Slimcore Optimization is available only for published desktops and for New Teams as per vendor support.
- For Zoom, the vendor changes to fetch plug-in details and optimization states are available from version 6.3.10 onwards. For more information, see Zoom documentation.
The following table lists available details for an application that relies on Citrix HDX optimization. Ensure that you are using supported product versions to get full visibility.
| Feature name | UI parameters | Virtual Delivery Agent version | Citrix Workspace app for Windows version | Citrix Workspace app for Mac version | Citrix Workspace app for Linux version |
|---|---|---|---|---|---|
|
Microsoft Teams Slimcore
|
Plugin manager, Plugin manager name, Plugin manager version | 2503 | 2503 | Not supported by vendor | Not supported by vendor |
| App version, Virtual channel, Virtual channel allow list | 2503 | 2402 | Not supported by vendor | Not supported by vendor | |
| Plugin, Plugin version, State | 2507 | 2503 | Not supported by vendor | Not supported by vendor | |
|
Zoom
|
Plugin manager, Plugin manager name, Plugin manager version | 2507 | 2503 | 2505 | Plugin not Available |
| App version, Virtual channel, Virtual channel allow list | 2507 | 2402 | 2402 | 2402 | |
| Plugin, Plugin version, State | 2507 | 2503 | 2505 | Plugin Not Available | |
|
Webex
|
Plugin manager, Plugin manager name, Plugin manager version | 2507 | 2503 | Plugin Not Available | Plugin Not Available |
| App version, Virtual channel, Virtual channel allow list | 2507 | 2402 | 2402 | 2402 |
The following table lists available details for an application that relies on Citrix HDX optimization. Ensure that you are using supported product versions to get full visibility.
| Feature name | UI parameters | Virtual Delivery Agent version | Citrix Workspace app for Windows version | Citrix Workspace app for Mac version | Citrix Workspace app for Linux version |
|---|---|---|---|---|---|
| Microsoft Teams | State | 1906.2 | 2112 | 2203 | 2203 |
Data definitions:
| UI parameter | Description |
|---|---|
| Plugin manager | Shows whether the plugin manager is installed or not. The plug-in manager is a small management component that opens the Virtual channel and downloads the necessary media engine (plugin) for optimization. Note: Functionality might vary by vendor. |
| Plugin manager name | Name of the installed plugin manager. |
| Plugin manager version | Version of the installed plugin manager. |
| Plugin | Shows whether the plugin is installed or not. Plugin is the necessary media engine for optimization. Note: Functionality might vary by vendor. |
| Plugin version | Version of the installed plugin on the endpoint. |
| App version | Represents the version of the application on the virtual delivery agent (VDA). |
| Virtual channel | Represents if the virtual channel is open or closed for the real time communications app. |
| Virtual channel allow list | Shows the status of virtual channels. Values are Enabled or Disabled. |
| State | Shows the optimization state for the application for the specific user session |
Session Topology scenarios
Depending on the deployment scenario of the site, the components involved in a session are all or any of the following:
- Citrix Workspace app on Endpoint
- Gateway service/ on-premises Gateway
- Cloud Connector – Gateway is connected to DaaS via a Cloud Connector in the case of hybrid connections.
- VDAs
Accordingly, the possible network topologies are as follows:
- Citrix Workspace app on the endpoint connects via Citrix Workspace and Gateway Service to an on-premises VDA. No Cloud Connector is used to connect to VDA.
- Citrix Workspace app on the endpoint connects via Citrix Workspace and Gateway Service to an on-premises VDA via Cloud Connector.
- Citrix Workspace app on the endpoint connects via StoreFront™ and on-premises Gateway to on-premises VDA.
- Citrix Workspace app on the endpoint connects via StoreFront to on-premises VDA.
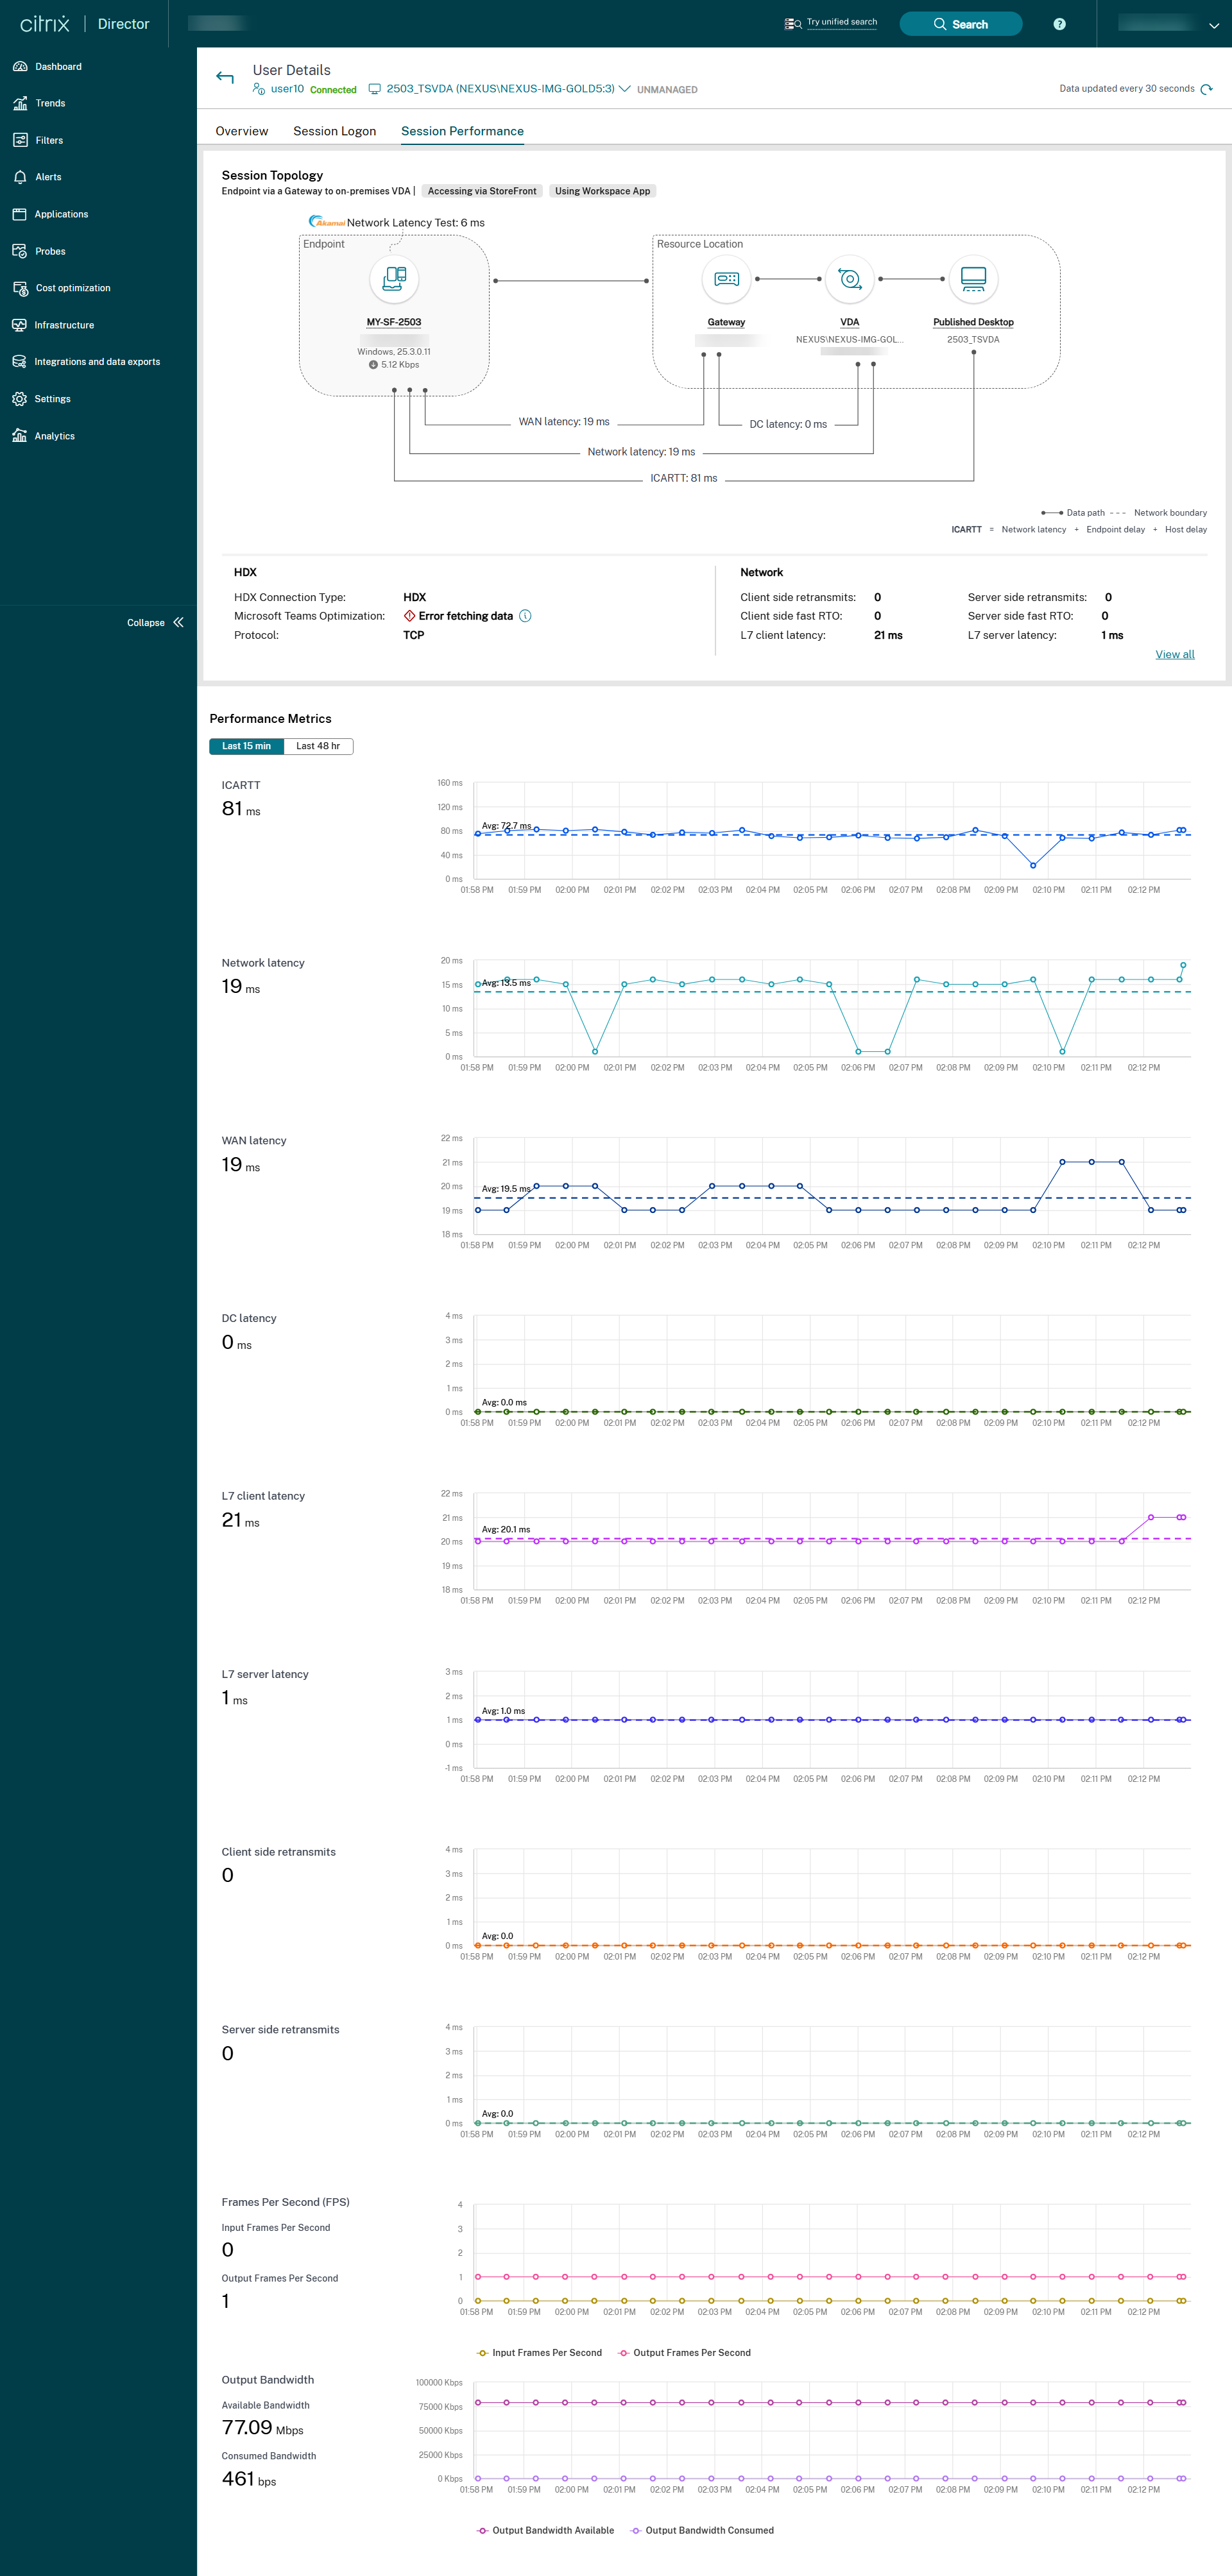
Performance Metrics
The Performance Metrics panel offers the ability to correlate real-time metrics in identifying issues within user sessions. Trends for the session metrics help indicate how these metrics have performed over time. When you click the Session Performance tab, along with the real-time data, you can view the last 15 minutes and 48 hours data. The plots help to correlate multiple component performance metrics in a single view.
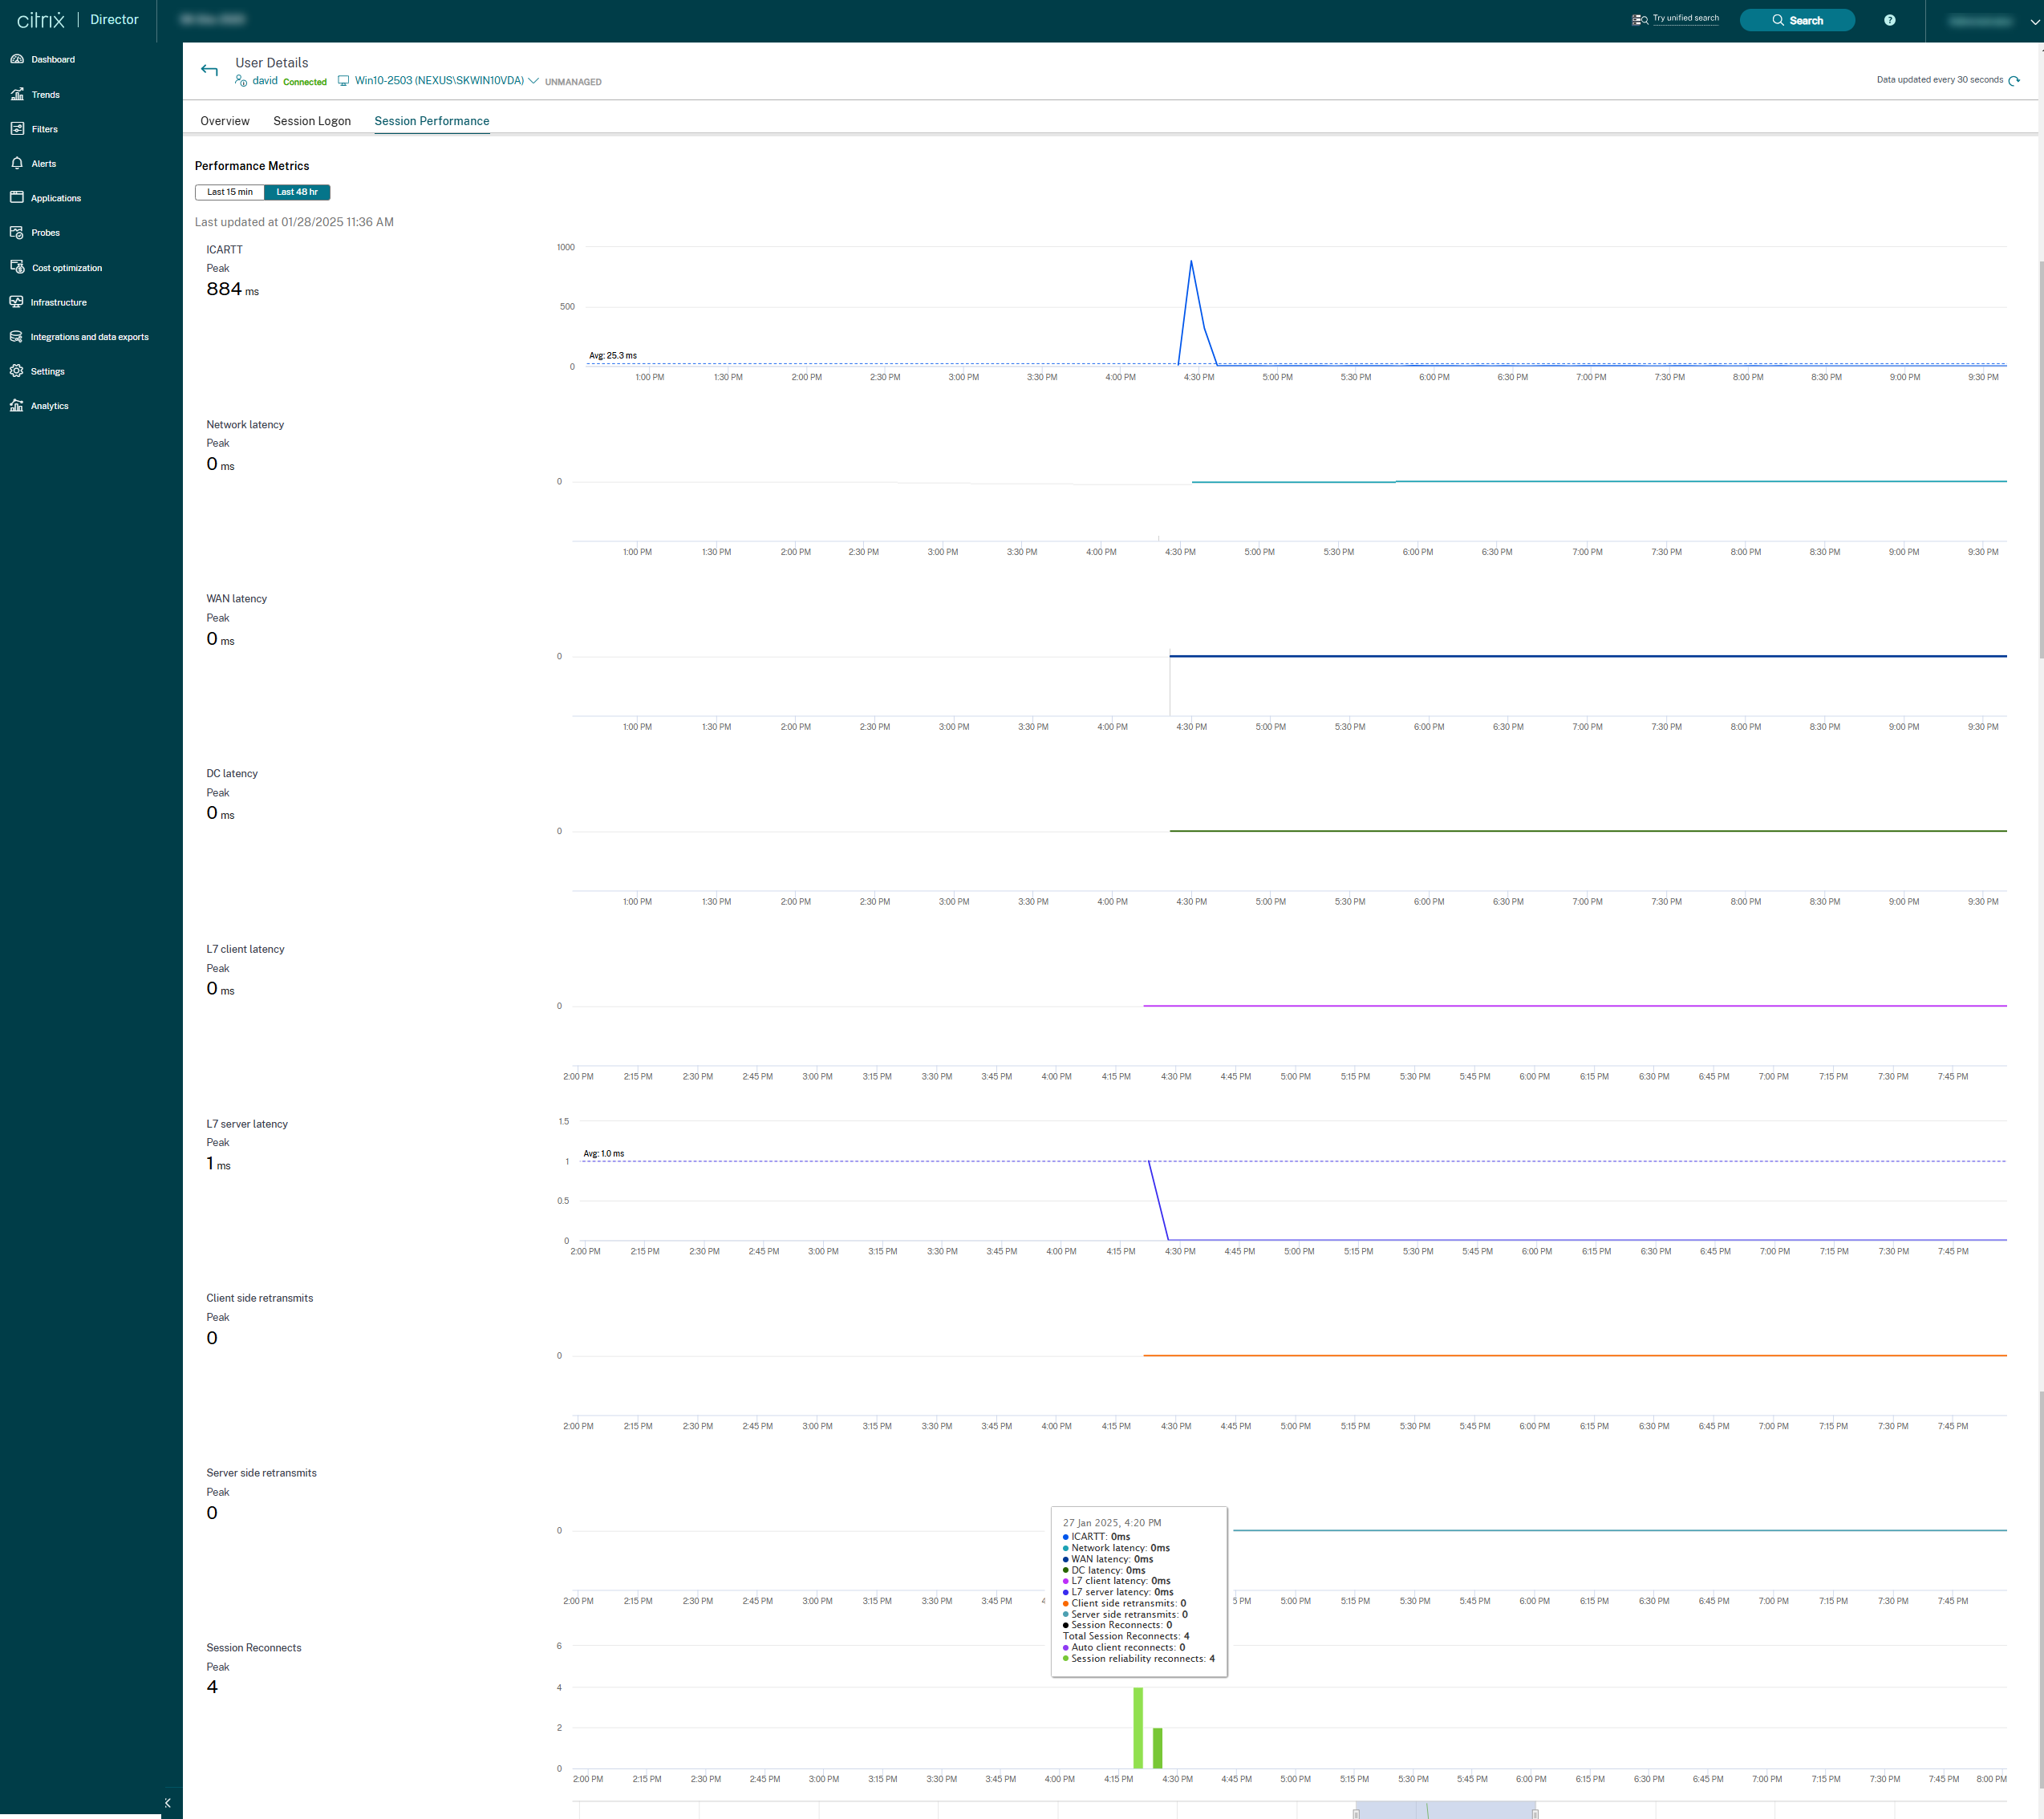
Note:
- With the trailing 15-minutes metrics support, the graph is plotted for the duration for which the session is connected and disconnected. The disconnected session’s metric is displayed with the value zero.
- With the trailing last 48 hours metrics support, the ICARTT, ICA Latency, and Session Reconnects plots are updated with the historical data metrics. The session reconnect information helps you to view and troubleshoot network connections having interruptions. It also analyzes networks having a seamless experience. The graph to see the number of Session Reconnects, Total Session Reconnects, Auto client reconnect, and Session reliability reconnects.
Apart from ICARTT and ICA Latency, the following metrics are available for real-time and last 15-minutes metrics:
- Frames Per Second - Frames Per Second is an important metric that indicates the session responsiveness.
- Output Bandwidth Available - Output Bandwidth Available is a measure of the total bandwidth available to transmit data from the VDA to the endpoint.
- Output Bandwidth Consumed - Output Bandwidth Consumed indicates the actual amount of data transmitted from the VDA to the endpoint to display sessions to users.
Analyzing Output Bandwidth Available and the Output Bandwidth Consumed helps check if sufficient bandwidth is available to serve sessions and to detect if a session is affected by insufficient bandwidth.
Troubleshoot when ICA RTT or Session Logon Duration data fails to populate
Previously, when EUEM service or Profile Management service failed to run, the reason for failure in getting the data related to ICA RTT or Session Logon Duration wasn’t displayed. With this new feature, you can get the reason for failure and the corresponding solution for that failure. The Learn more links provides the ICA RTT and Session Logon Duration errors, the reason for failure, and the solution as mentioned in the following table:
| Error type | Error | Error message | Solution |
|---|---|---|---|
| ICA RTT error
|
ICA RTT value is not displayed.
|
Citrix End User Experience Monitoring is not running.
|
1. Open the Services console. To open this console, click Start and then type Services. |
2. Make sure that the Citrix End User Experience Monitoring Service is running. |
|||
3. Reopen the desktop session and try. The ICA RTT value must be displayed. |
|||
4. If the issue persists, contact the Citrix administrator. |
|||
| ICA RTT error
|
ICA RTT value is not displayed.
|
Citrix End User Experience Monitoring is not installed.
|
1. Re-install the VDA. |
2. Open the Services console. To open this console, click Start and then type Services |
|||
3. Make sure that the Citrix End User Experience Monitoring Service is running. |
|||
4. Reopen the desktop session and try. The ICA RTT value must be displayed now. |
|||
5. If the issue persists, contact the Citrix administrator. |
|||
| ICA RTT error
|
ICA RTT value is not displayed.
|
Error fetching data.
|
1. Open the Services console. To open this console, click Start and then type Services. |
2. Ensure that the Windows Management Instrumentation Service is running. |
|||
3. Also, ensure that the WfShell.exe/PicaShell.exe process is running under Activity Manager > Process tab. If it is not running, reopen the desktop session. |
|||
4. If the preceding steps are not working, run the following command to ensure that the Citrix_Euem_RoundTrip instance is present: Get-CimInstance -Namespace 'ROOT\Citrix\Euem' -Query "select * from Citrix_Euem_RoundTrip"
|
|||
5. If the Citrix_Euem_RoundTrip instance is present, reopen the desktop session. |
|||
6. If the issue persists, contact the Citrix administrator. |
|||
| Session Logon Duration error
|
The graph is not loaded.
|
Citrix Profile Management is not running
|
1. Open the Services console. To open this console, click Start and then type Services. |
2. Ensure that the Citrix Profile Management Service is running. |
|||
3. Reopen the desktop session and try. The graph must be displayed. |
|||
4. If the issue persists, contact the Citrix administrator. |
|||
| Session Logon Duration error
|
The graph is not loaded.
|
Citrix Profile Management is not installed.
|
1. Install the Citrix Profile Management Service. |
2. Open the Services console. To open this console, click Start and then type Services. |
|||
3. Ensure that the Citrix Profile Management Service is running. |
|||
4. Reopen the desktop session and try. The graph must be displayed. |
|||
5. If the issue persists, contact the Citrix administrator. |
|||
| Session Logon Duration error
|
The graph is not loaded.
|
Error fetching data.
|
1. Open the Services console. To open this console, click Start and then type Services. |
2. Ensure that the Windows Management Instrumentation Service is running. |
|||
3. If the preceding service is already running, run the following command to ensure that the LogonTimings instance is present: Get-CimInstance -Namespace 'ROOT\Citrix\Profile\Metrics' -Query "select * from LogonTimings"
|
|||
4. If the issue persists, contact the Citrix administrator. |
|||
| ICA RTT error | ICA RTT value is not displayed. | Console isn’t supported. | Start a session using HDX. |
| ICA RTT error | ICA RTT value is not displayed. | Remote Desktop Protocol (RDP) isn’t supported. | Start a session using HDX. |
| ICA RTT error | ICA RTT value is not displayed. | Upgrade VDA to version 2402 or higher to get detailed error detection and access all the features. | Upgrade VDA to 2402 or higher. |
| Session Logon Duration error | The graph is not loaded. | Citrix Profile Management WMI plug-in isn’t installed. | Install Citrix Profile Management WMI plug-in. |