Data Export to Observability Platform (Preview)
Citrix Analytics for Performance™ is now integrated with the Splunk, Elasticsearch, and Grafana Observability platform. You can use the Data Export feature to export performance data and events from Citrix Analytics for Performance to Splunk, Elasticsearch, and Grafana.
Note:
You can export data to only one endpoint at a time.
The Observability platform gives you a holistic view of the performance metrics that belong to the on-premises Citrix Virtual Apps and Desktops™ sites and the DaaS cloud services that have been onboarded to your Citrix Analytics for Performance service. Further, you can combine and correlate performance metrics from Citrix Analytics for Performance data with data from external data sources that are connected within your Observability platform.
Data available in the Observability platform can be used to derive value through continuous monitoring. It helps get actionable business insights into the performance of your virtual apps and desktop sites. Some ways in which you can use the data in the Observability platform are as follows:
- Create dashboards and reports in a regular cadence. These dashboards and reports help analyze the performance of your environment over time.
- Extract information of specific interest to your organization’s KPIs and identify bottlenecks causing poor user performance.
- Identify machines in your sites that are underutilized and optimize consumption and usage to reduce overall costs.
- Triage and troubleshoot specific issues that users in your infrastructure are facing during connection and in-session.
- Easily root cause and pinpoint poor in-session experience to client-side network or end point device issues, or to issues on specific infrastructure components like the gateway or the connector.
- Identify patterns in session failures and high session latency to see if poor experience can be localized to a location or a specific service provider.
- Identify particular apps or processes that are causing a resource crunch.
To use this functionality, sign up and enroll to the Technical Preview using this form.
Integration with Observability Platform
Currently, the Observability platforms that Citrix Analytics for Performance support are Splunk, Elasticsearch, and Grafana. For more information on the features and usage of:
- Splunk, see the Splunk documentation.
- Elasticsearch, see the Elasticsearch documentation
- Grafana, see the Grafana documentation
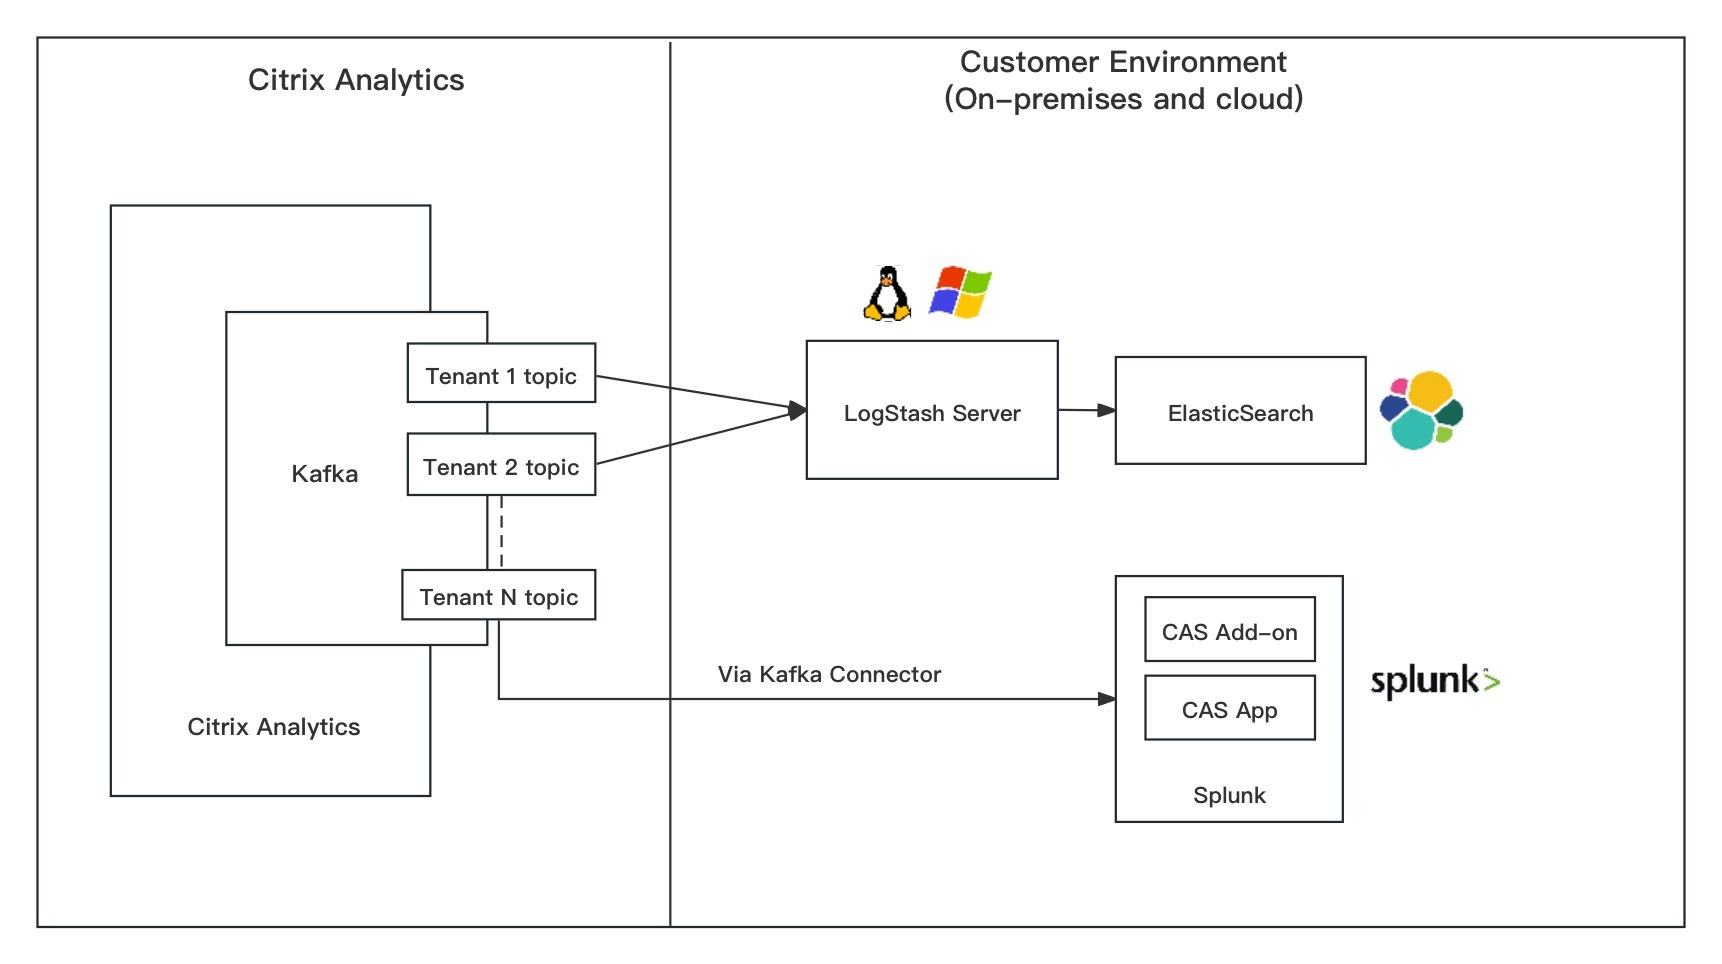
Splunk connects with the north-bound Kafka deployed on Citrix Analytics for Performance cloud using Kafka endpoints. Use the parameters provided by Citrix Analytics for Performance to integrate Citrix Analytics for Performance with Splunk. Using the Kafka endpoints, you can connect and pull the data into Splunk.
Elasticsearch connects with the Kafka deployed on Citrix Analytics for Performance cloud using the Logstash engine. Use the parameters provided by Citrix Analytics for Performance to integrate Citrix Analytics for Performance with Elasticsearch. Using the Kafka endpoints, you can connect and pull the data into Elasticsearch and get deeper insights into your organization’s performance posture.
The following architecture diagram explains how data flows from Citrix Analytics for Performance to Observability platform:
Getting Started with Data Export
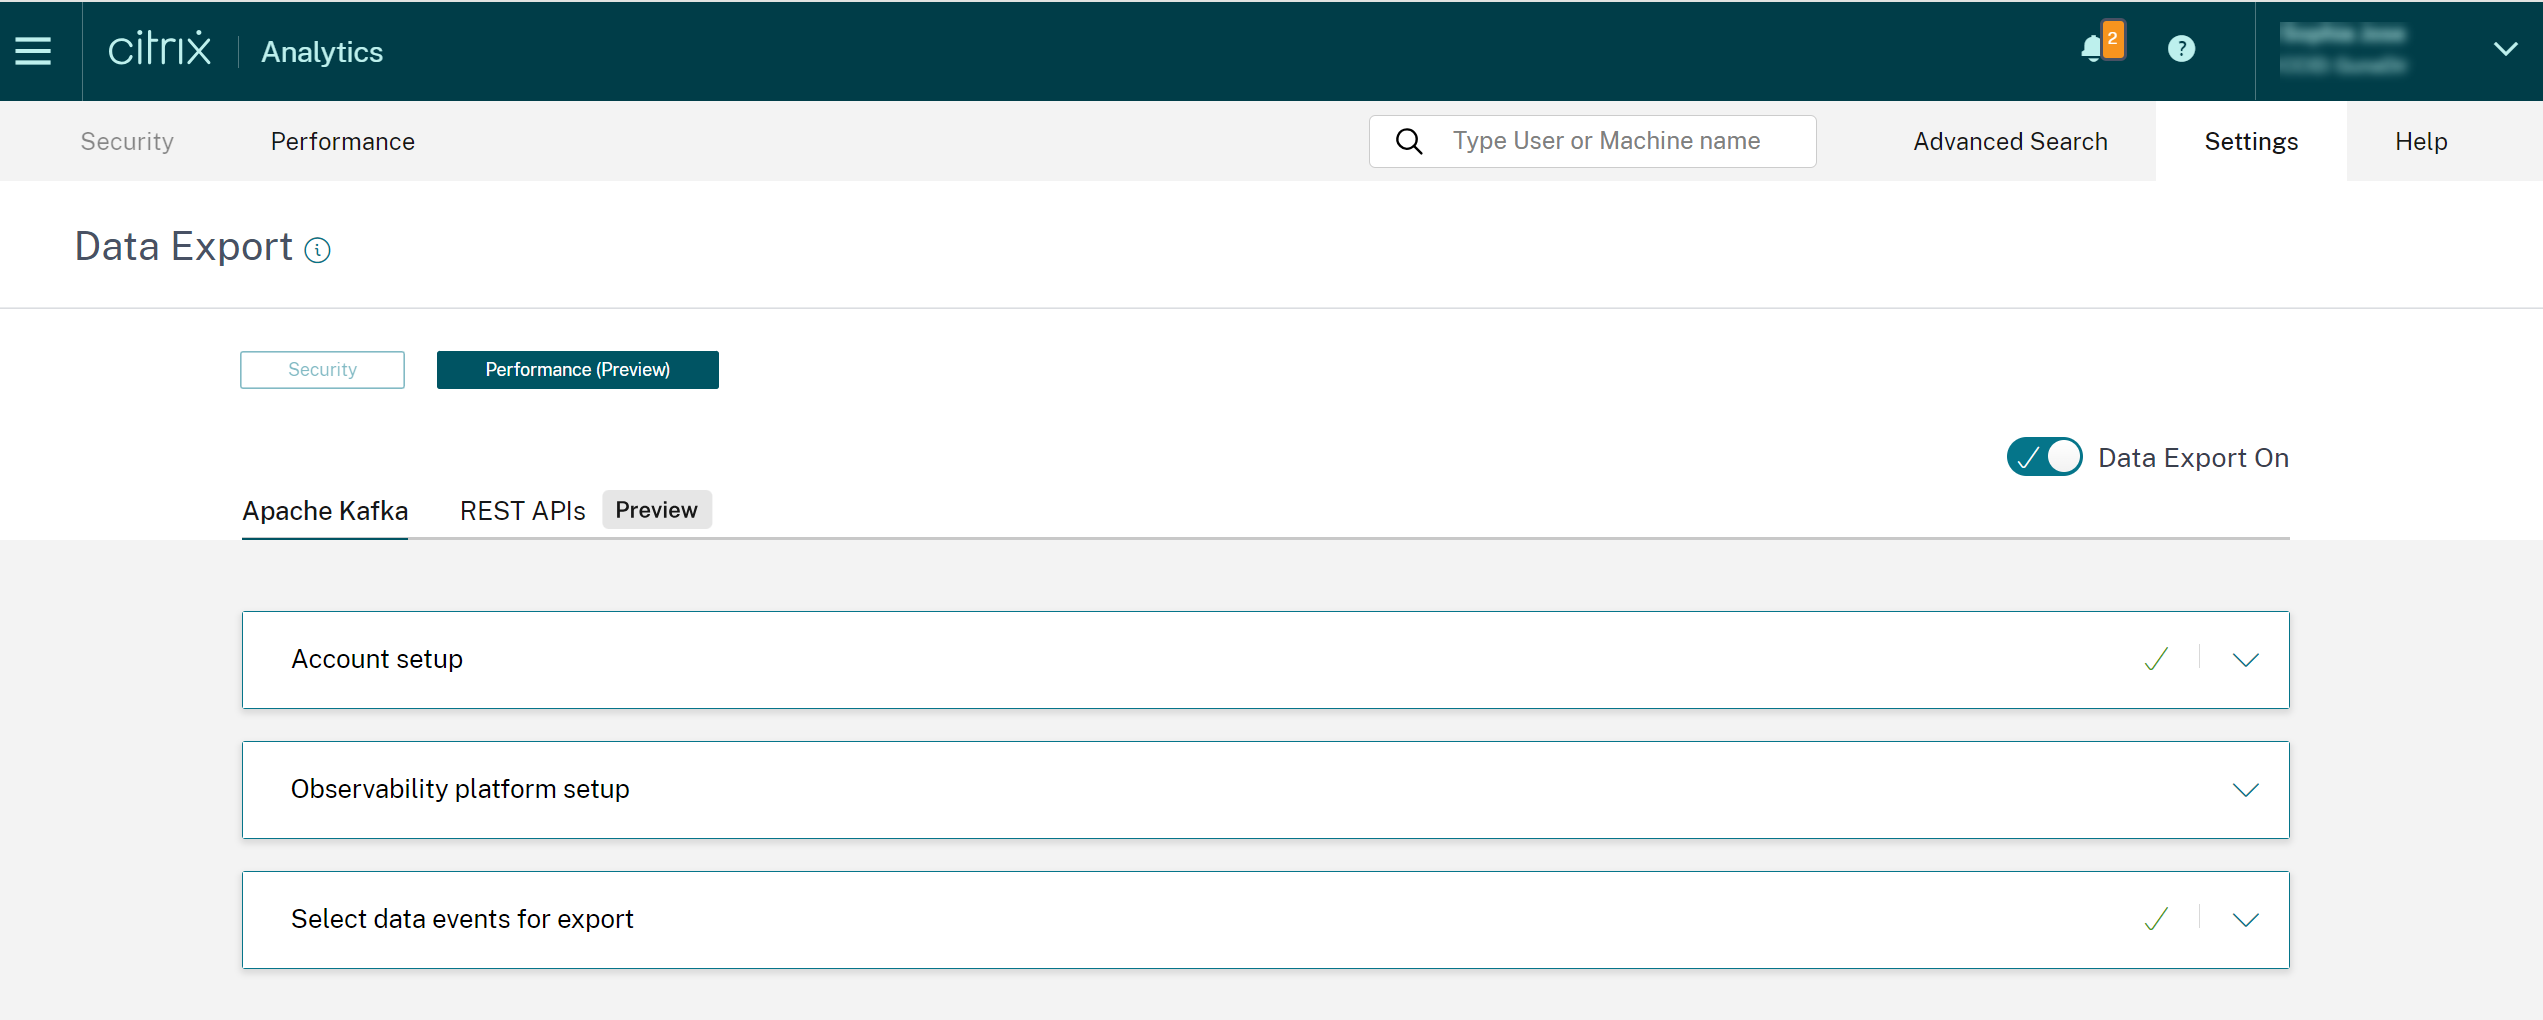
The Data Export feature can be accessed and configured from Citrix Analytics Service > Settings > Data Export > Performance. Data export to the Observability platform is turned on by default with the Data Export On toggle. You can toggle Data Export Off, to stop sending new data events.
Data Export is configured in the following steps. For more information, see the Splunk Integration and the Elasticsearch integration articles.
- Account setup - To create an account, specify a password. Once you configure your account, the Kafka details are generated. These details are used in the configuration with Splunk and Elasticsearch. Use this section to reset your password.
- Observability platform setup - Install and configure Citrix Analytics Add-On for Splunk, Elasticsearch, and Grafana using the Kafka details generated in the previous step.
- Select data events for export - This section lists the data exported to the Observability platform. You can select specific events you want to export from the Sessions and Machines data sources.