Elasticsearch integration
Note:
Contact CAS-PM-Ext@cloud.com to request assistance for the Elasticsearch integration, exporting data to Elasticsearch, or provide feedback.
You can integrate Citrix Analytics for Performance™ with Elasticsearch by using the Logstash engine. This integration enables you to export and correlate the users’ data from your Citrix IT environment to Elasticsearch and get deeper insights into your organization’s security posture.
For more information about the benefits of the integration and the type of processed data that is sent to your Observability platform, see Data Export.
Prerequisites
-
Turn on data processing for at least one data source. It helps Citrix Analytics for Performance to begin the Elasticsearch integration process.
-
Ensure that the following endpoint is in the allow list in your network.
Endpoint United States region European Union region Asia Pacific South region Kafka brokers casnb-0.citrix.com:9094casnb-eu-0.citrix.com:9094casnb-aps-0.citrix.com:9094casnb-1.citrix.com:9094casnb-eu-1.citrix.com:9094casnb-aps-1.citrix.com:9094casnb-2.citrix.com:9094casnb-eu-2.citrix.com:9094casnb-aps-2.citrix.com:9094casnb-3.citrix.com:9094
Integrate with Elasticsearch
-
Go to Settings > Data Exports.
-
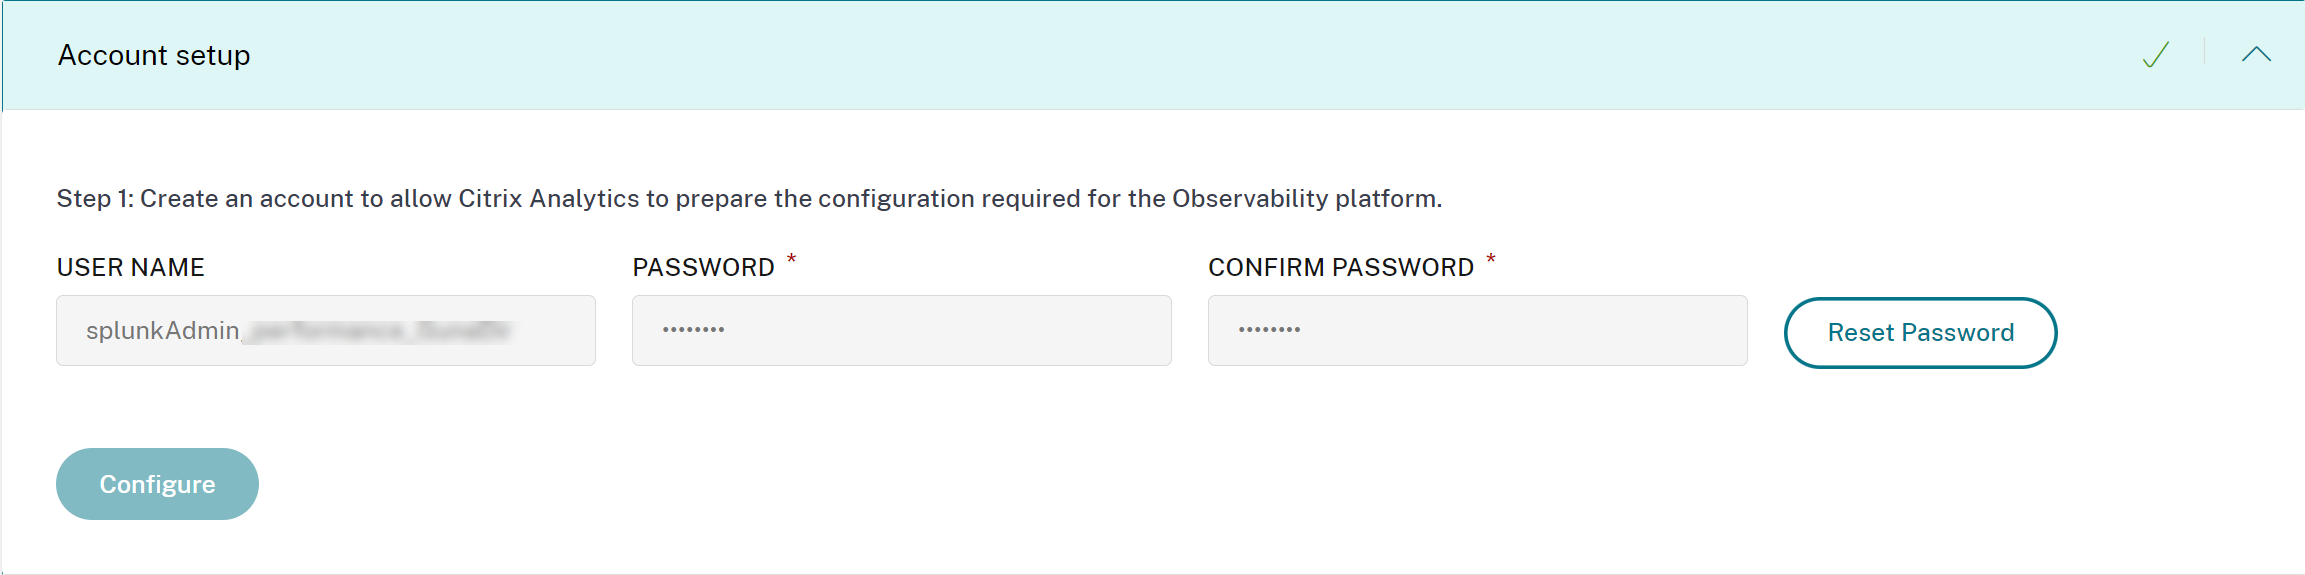
On the Account set up section, create an account by specifying the user name and a password. This account is used to prepare a configuration file, which is required for integration.
-
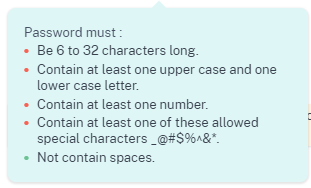
Ensure that the password meets the following conditions:
-
Click Configure to generate the Logstash configuration file.
-
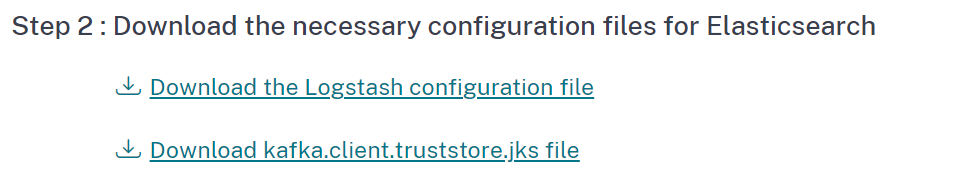
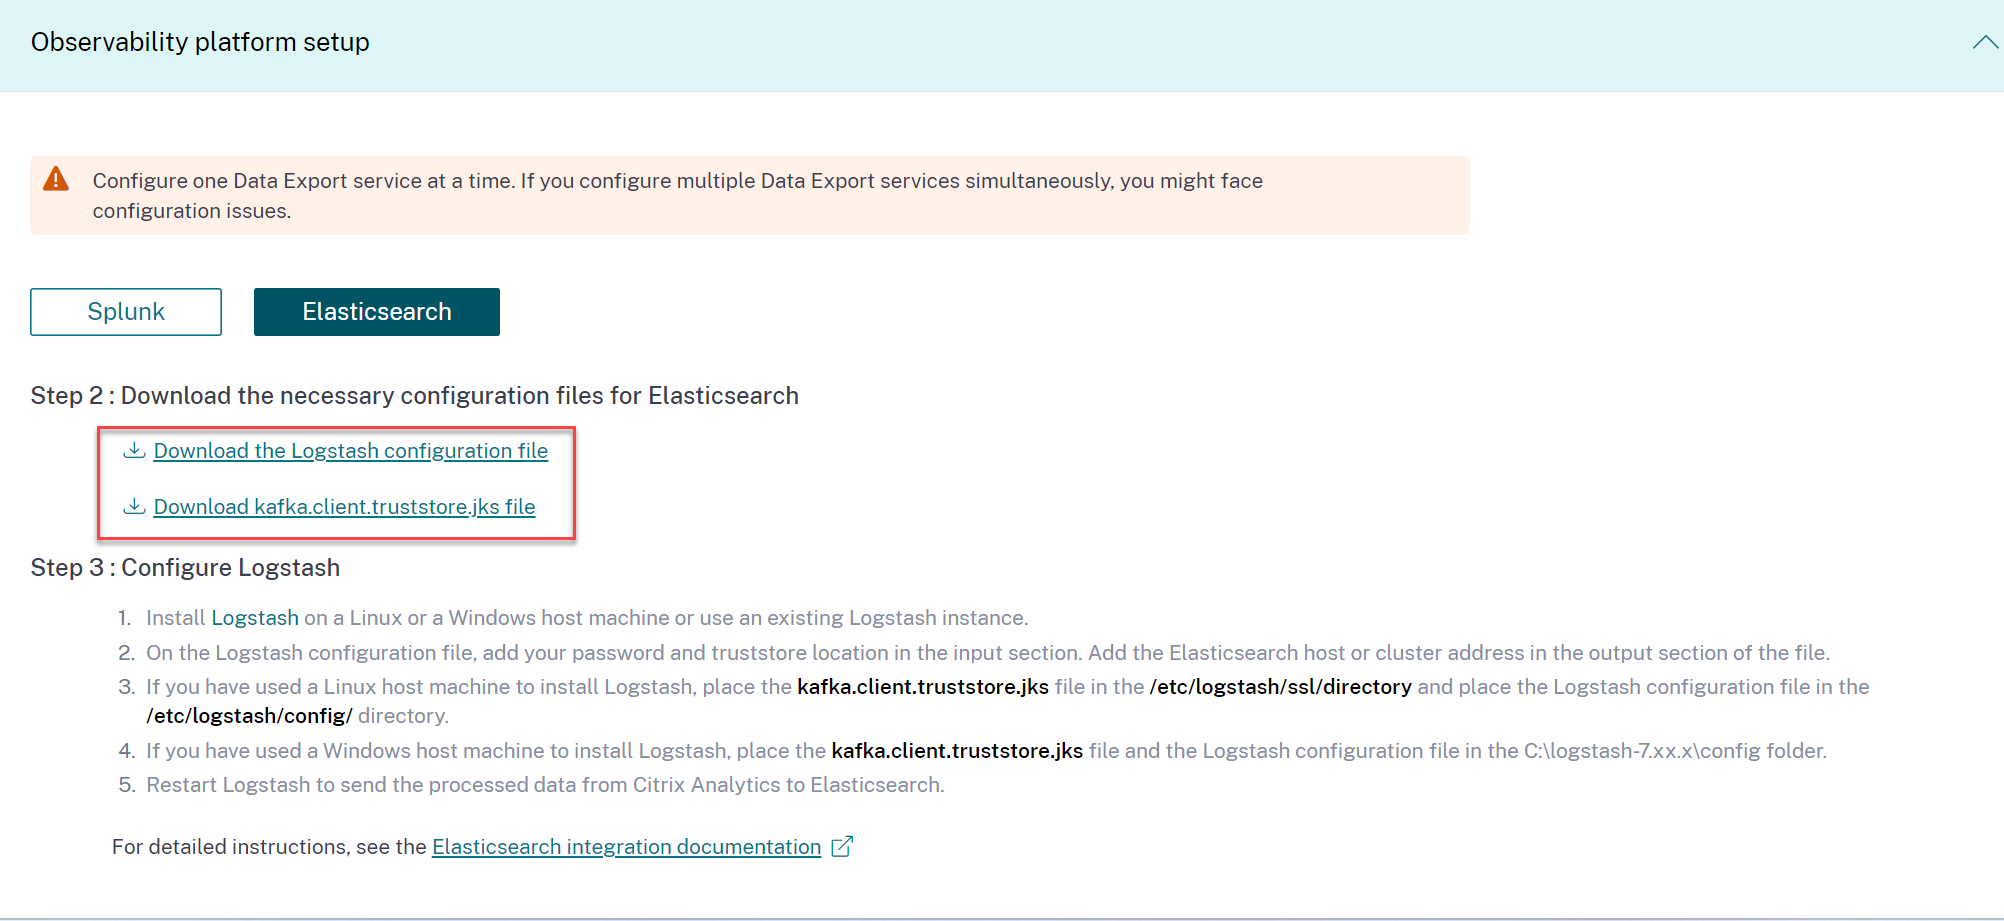
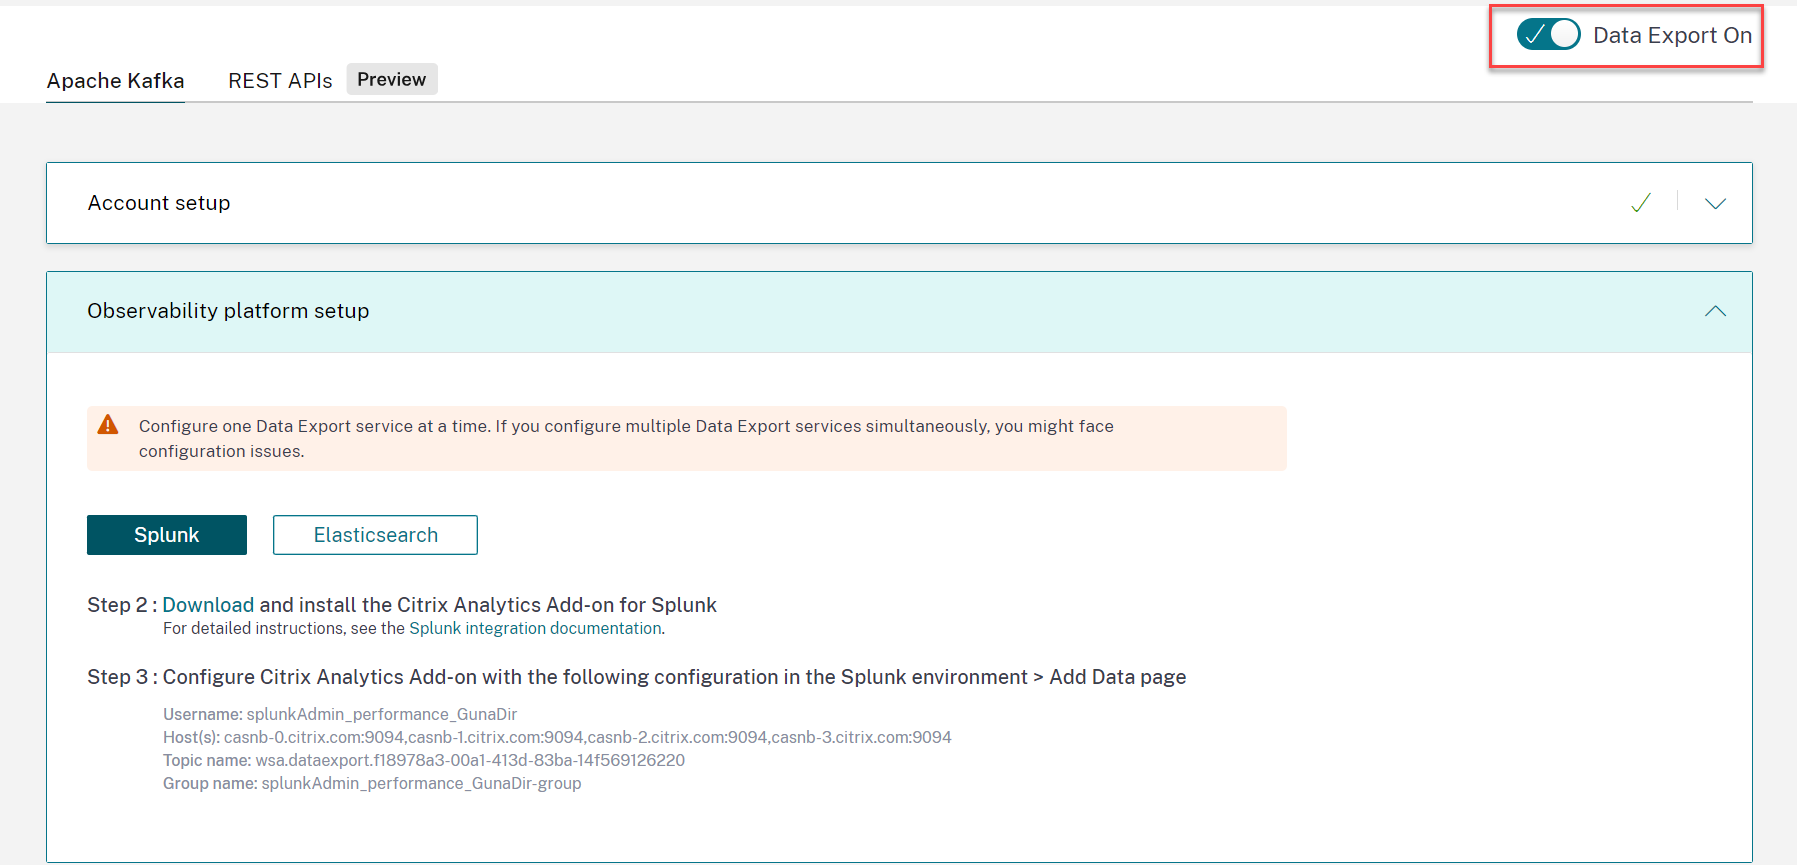
Select the Elastic Search tab from the Observability Platform section to download the configuration files:
-
Logstash config file: Contains the configuration data (input, filter, and output sections) for sending events from Citrix Analytics for Performance to Elasticsearch using the Logstash data collection engine. For information on the Logstash config file structure, see the Logstash documentation.
-
JKS file: Includes the certificates required for SSL connection.
Note
These files contain sensitive information. Keep them in a safe and secure location.
-
-
Configure Logstash:
-
On your Linux or Windows host machine, install Logstash. You can also use your existing Logstash instance.
-
On the host machine where you have installed Logstash, place the following files in the specified directory:
Host machine type File name Directory path Linux CAS_Elasticsearch_LogStash_Config.config For Debian and RPM packages: /etc/logstash/conf.d/For .zip and .tar.gz archives: {extract.path}/configkafka.client.truststore.jks For Debian and RPM packages: /etc/logstash/ssl/For .zip and .tar.gz archives: {extract.path}/sslWindows CAS_Elasticsearch_LogStash_Config.config C:\logstash-7.xx.x\configkafka.client.truststore.jks For information on the default directory structure of Logstash installation packages, see the Logstash documentation.
-
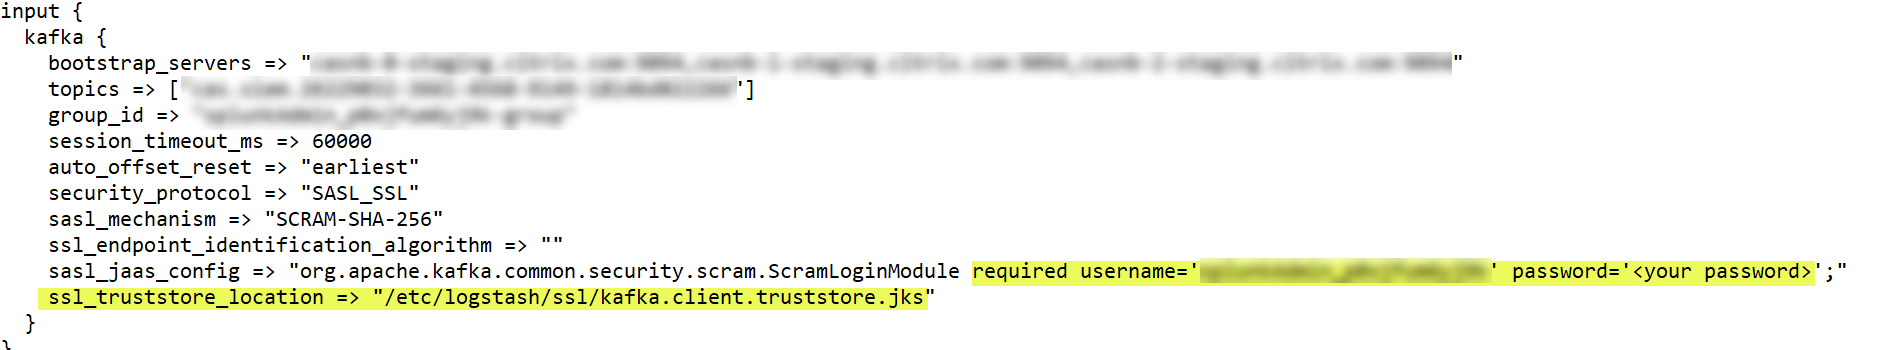
Open the Logstash config file and do the following:
-
In the input section of the file, enter the following information:
-
Password: The password of the account that you’ve created in Citrix Analytics for Performance to prepare the configuration file.
-
SSL truststore location: The location of your SSL client certificate. This is the location of the kafka.client.truststore.jks file in your host machine.
-
-
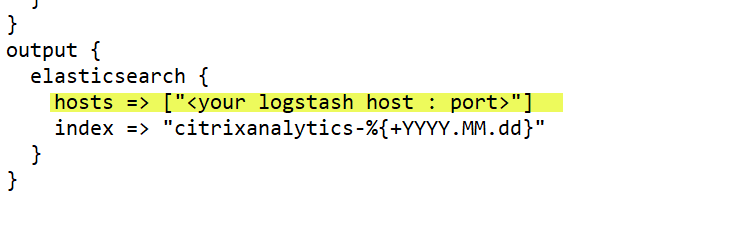
In the output section of the file, enter the address of your host machine or the cluster where Elasticsearch is running.
-
-
Restart your host machine to send processed data from Citrix Analytics for Performance to Elasticsearch.
-
After configuration is complete, verify that you can view the Citrix Analytics data in your Elasticsearch.
Logstash configuration
A sample Logstash configuration can be downloaded from the Citrix Analytics for Performance page.
The following is a small variation of the Logstash pipeline definition that can support the provided sample Kibana dashboards:
filter {
  json {
    source => "message"
    remove_field => ["message"]
  }
  date {
    match => [ "timestamp", "ISO8601", "yyyy-MM-dd HH:mm:ss" ]
    target => "@timestamp"
  }
}

filter {
  mutate {
    copy => ["eventType", "[@metadata][eventTypeIndex]"]
  }
}

filter {
  mutate {
    lowercase => ["[@metadata][eventTypeIndex]"]
  }
}

output {
  elasticsearch {
    hosts => ["<your logstash host : port>"]
    index => "citrixanalytics-%{[@metadata][eventTypeIndex]}-%{+YYYY.MM.dd}"
  }
}
<!--NeedCopy-->
Based on the previous configuration, Logstash uses the eventType field to separate Session and Machine events to separate indexes.
You can replace the “filter” and “output” sections of the default configuration file downloaded from the Citrix Analytics page with the preceding content and restart the Logstash service.
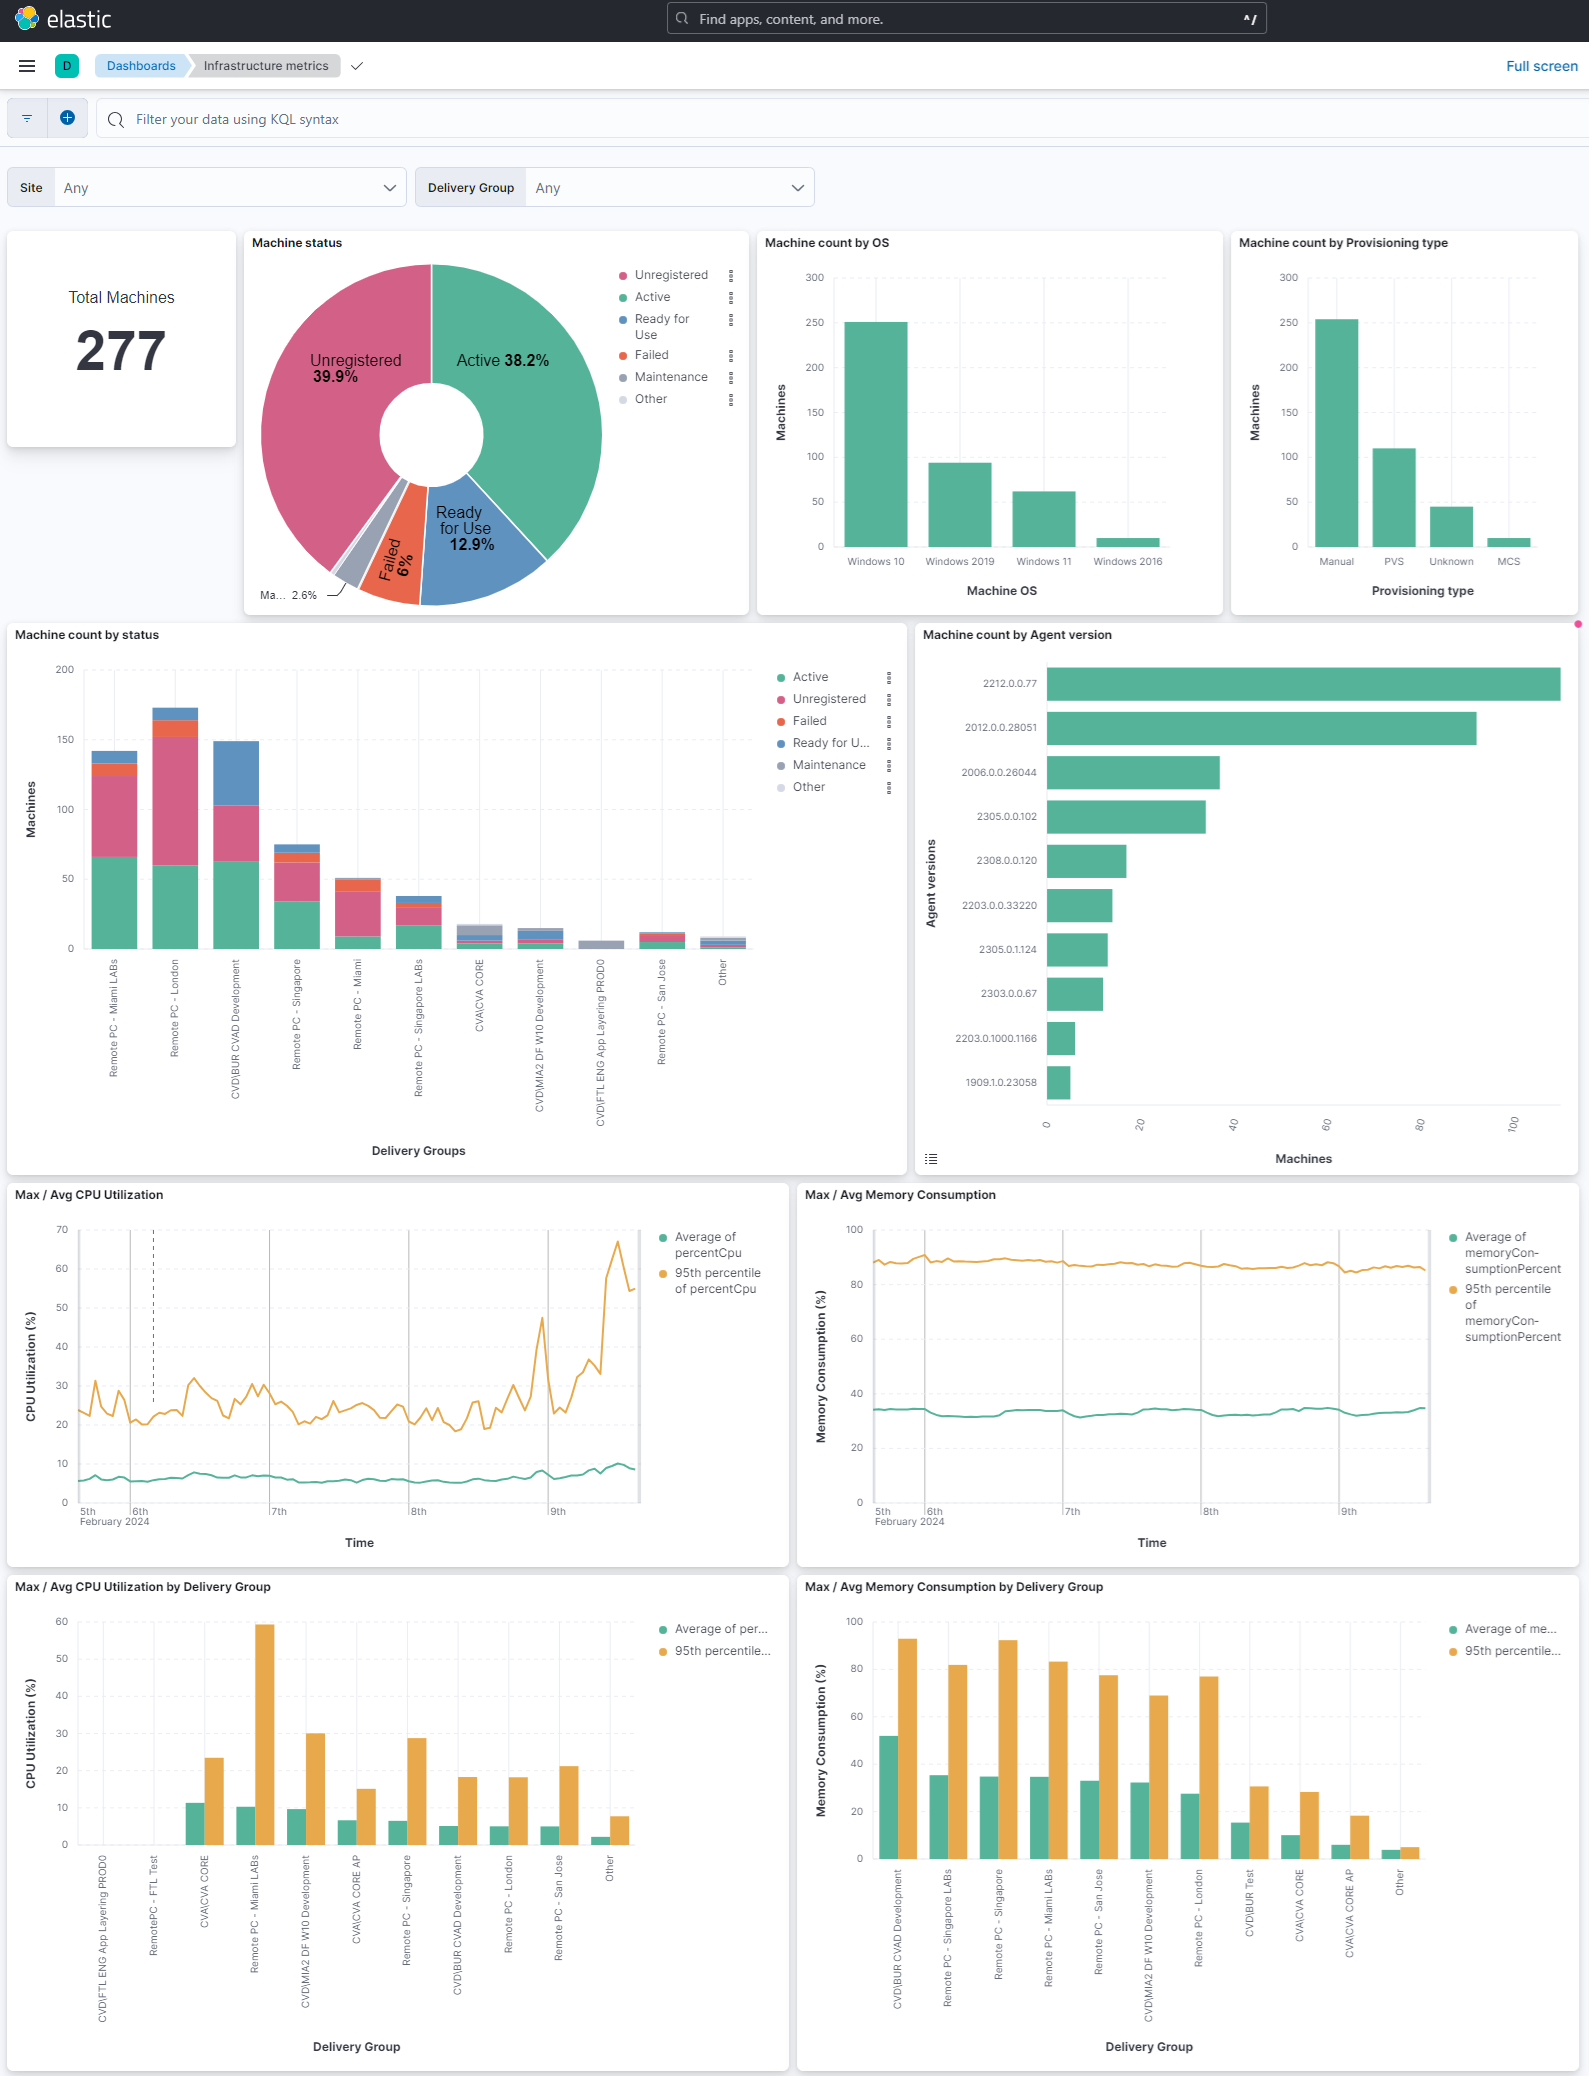
Kibana dashboard samples
You can import the sample Kibana dashboard provided by Citrix which includes:
- Metrics
- Time charts
- Other useful visualizations of session and infrastructure telemetry.
You can download the dashboard definitions (JSON files) from the Citrix Analytics downloads page.
You can import the dashboard files into your Kibana instance, either to a Elasticsearch cloud or enterprise account.
Before importing the dashboard, make sure you have properly configured your Logstash, Elasticsearch, and Kibana instances and are able to view citrixanalytics indexes in the Kibana Index Management page.
To import the dashboards and referenced data views, perform the following steps:
- Navigate to Management > Saved Object.
- Click Import and select the provided
ndjsonfile included in the given compressed file. - You can optionally select Create new objects with random IDs.
- Click Import.
After you complete the preceding steps, you can view the four new saved objects as displayed in the following image:
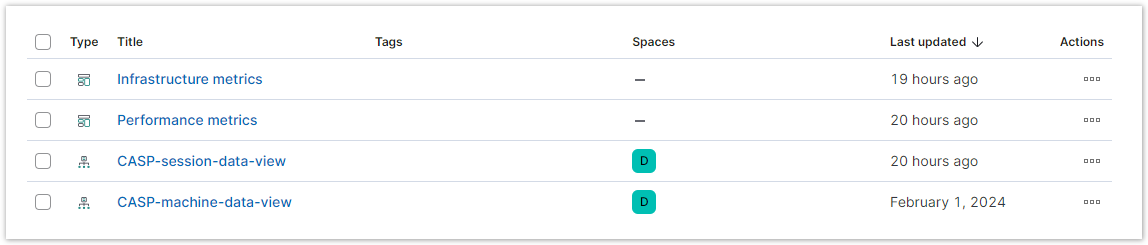
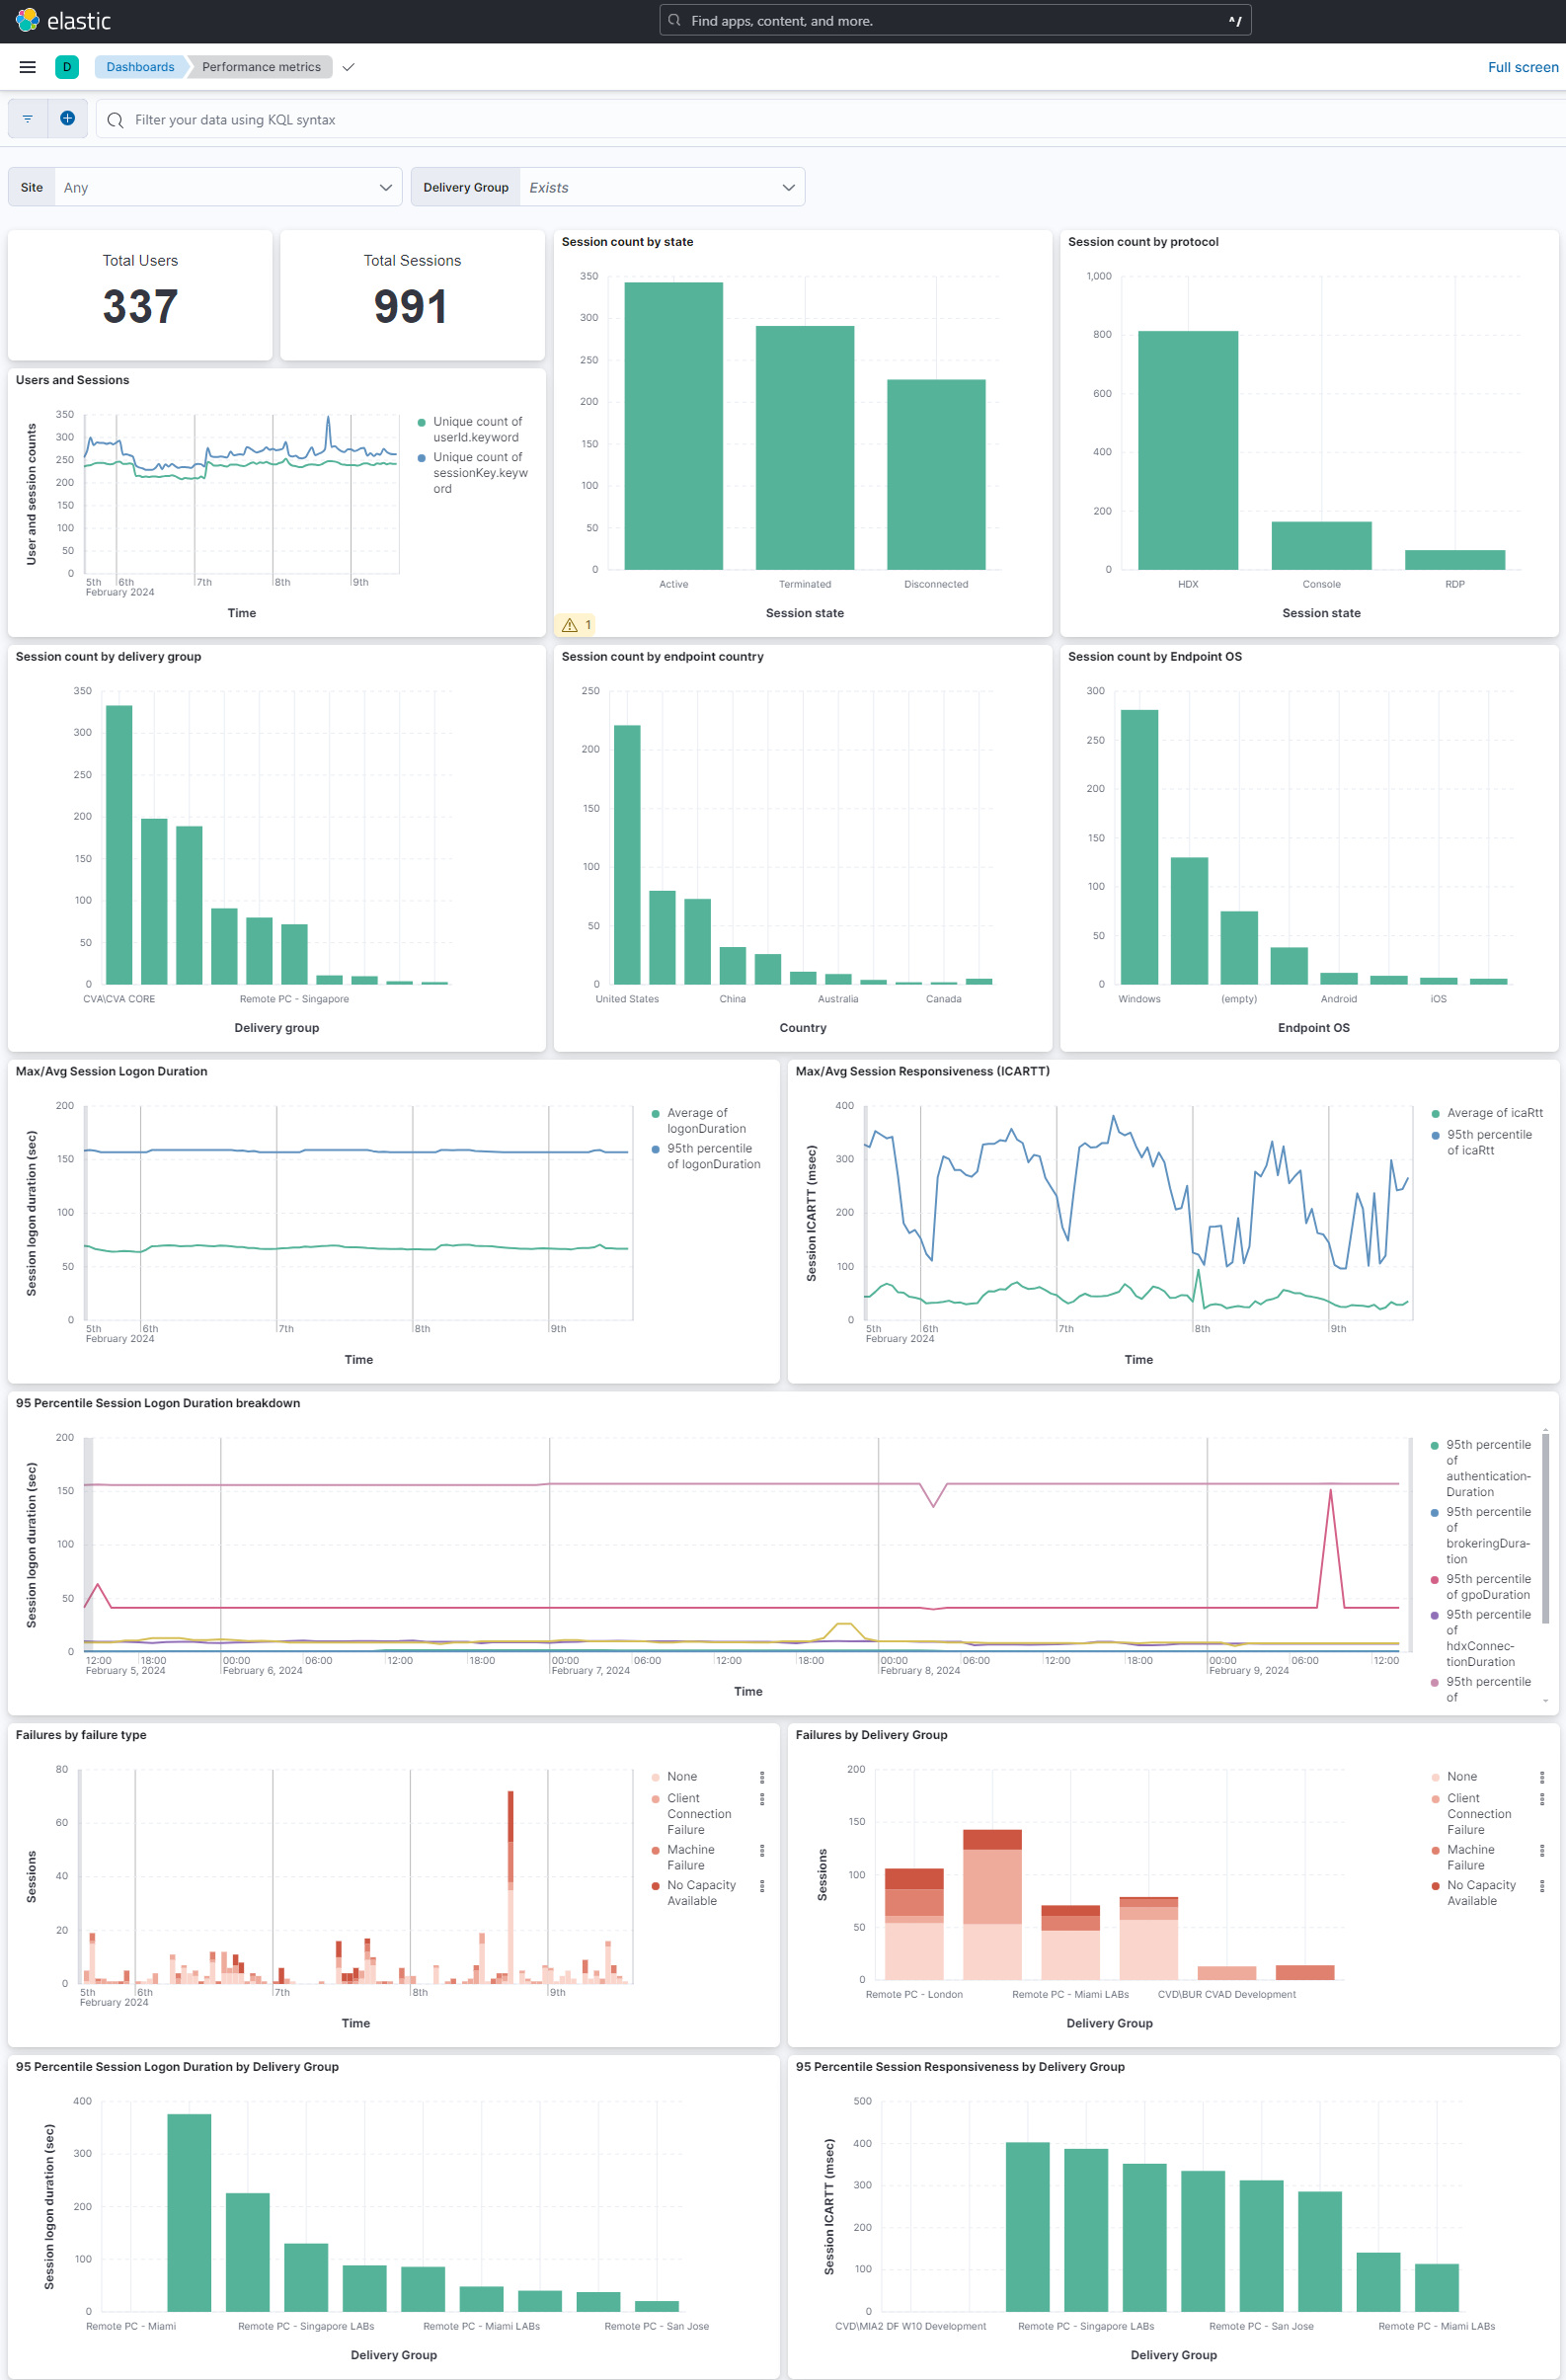
The data views are referenced by the dashboard visualizations and are referencing the indexes defined in the preceding Logstash configuration. You must be able to open the dashboards. The following are sample dashboards:
Turn on or off data transmission
After Citrix Analytics for Performance prepares the configuration file, data transmission is turned on for Elasticsearch.
To stop transmitting data from Citrix Analytics for Performance:
-
Go to Settings > Data Exports.
-
Turn off the toggle button to disable the data transmission. By default, the data transmission is always enabled.
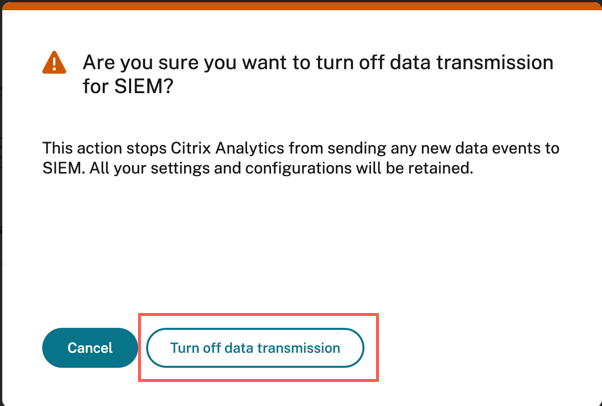
-
A warning window appears for your confirmation. Click Turn off data transmission to stop the transmission activity.
To enable data transmission again, turn on the toggle button.