Grafana integration
Note:
Contact CAS-PM-Ext@cloud.com to request assistance for the Grafana integration, exporting data to Grafana, or provide feedback.
You can integrate Citrix Analytics for Performance™ with Grafana by using the Promtail agent. This integration enables you to export and correlate the session and infrastructure data from your Citrix IT environment to Grafana. Also, get deeper insights into your organization’s security posture.
For more information about the following, see Data Export:
- Benefits of the integration
- The type of processed data that is sent to your Observability platform
Prerequisites
-
Turn on data processing for at least one data source. It helps Citrix Analytics for Performance to begin the Grafana integration process.
-
Ensure that the following endpoint is in the allow list in your network.
Endpoint United States region European Union region Asia Pacific South region Kafka brokers casnb-0.citrix.com:9094casnb-eu-0.citrix.com:9094casnb-aps-0.citrix.com:9094casnb-1.citrix.com:9094casnb-eu-1.citrix.com:9094casnb-aps-1.citrix.com:9094casnb-2.citrix.com:9094casnb-eu-2.citrix.com:9094casnb-aps-2.citrix.com:9094casnb-3.citrix.com:9094
Integrate with Grafana
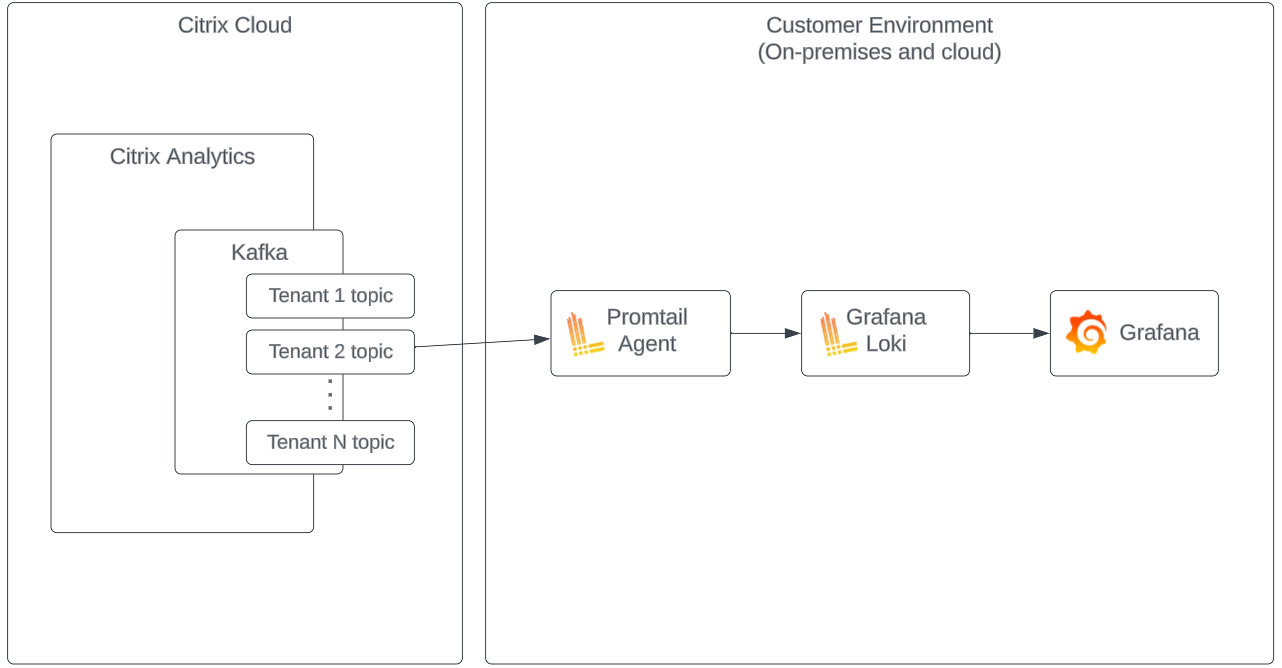
The following architecture diagram explains how data flows from Citrix Analytics for Performance to the Grafana observability platform:
Setup Data Export account
-
Go to Settings > Data Exports.
-
On the Account set up section, create an account by specifying the user name and a password. This account is used in the
Promtailconfiguration file, which is required for the integration.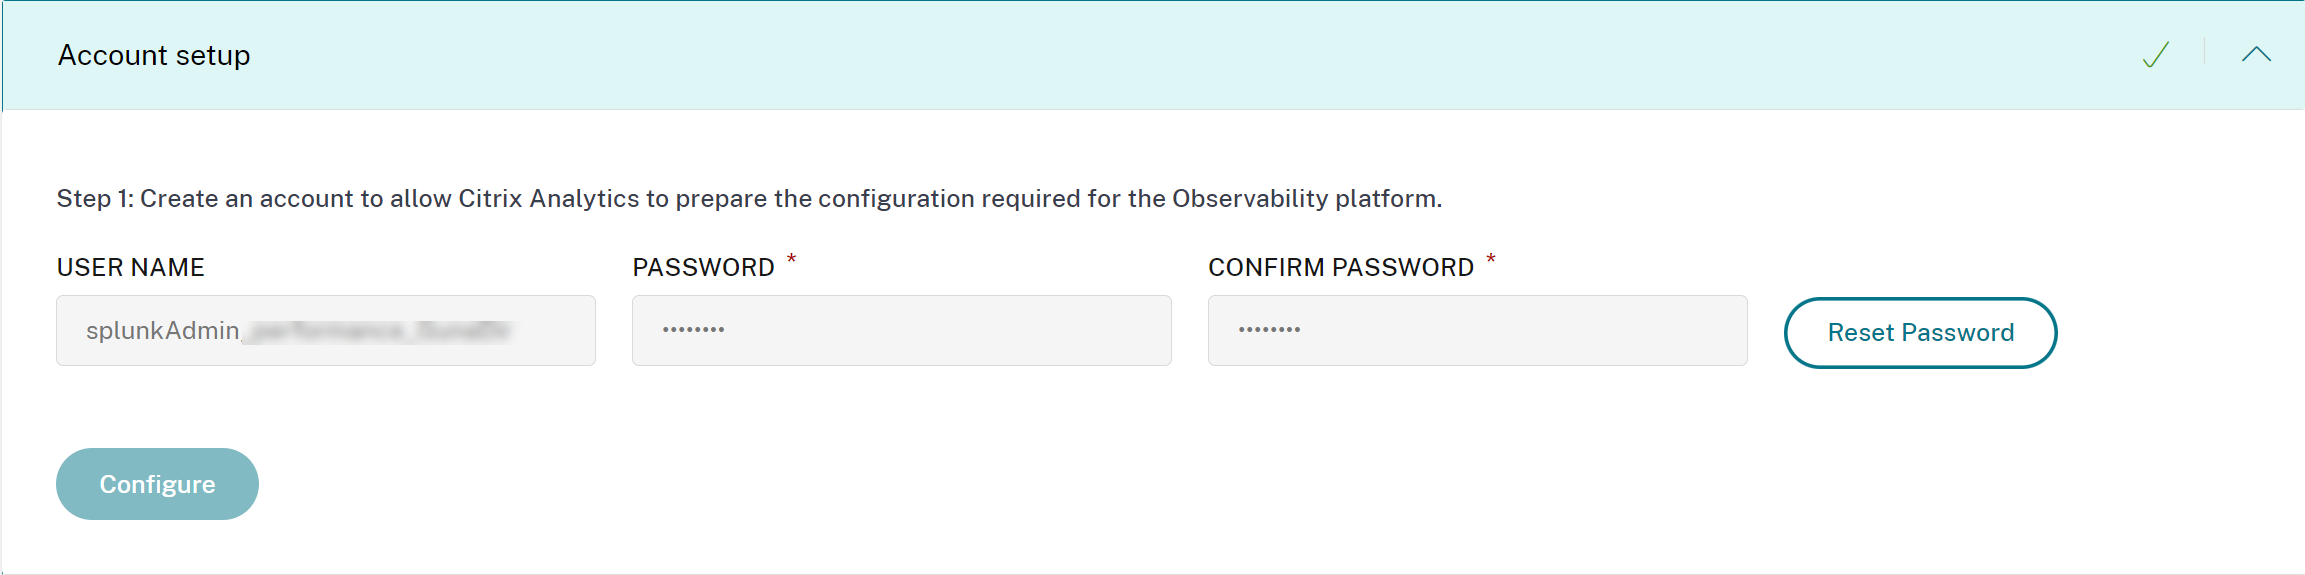
-
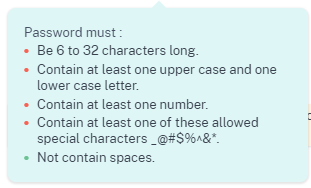
Ensure that the password meets the following conditions:
Promtail configuration
The Promtail is an agent which ships the contents of local logs to a private Grafana Loki instance or Grafana Cloud. You can install the Promtail Agent using Docker, Helm, apt, or even manually.
Promtail is configured in a YAML file, usually referred to as config.yaml. This YAML file contains information on the Promtail server, where positions are stored, and how to scrape logs from files.
The following is a sample Promtail scrape configuration for consuming records from the Citrix Analytics for Performance:
scrape_configs:
- job_name: kafka
  kafka:
    brokers:
      - [Citrix Analytics Kafka broker1]
      - [Citrix Analytics Kafka broker2]
      ...
    topics:
      - [Citrix Analytics for Performance Kafka topic]
    group_id: [Citrix Analytics Kafka group ID]
    authentication:
      type: sasl
      sasl_config:
        mechanism: SCRAM-SHA-256
        user: [Citrix Analytics Kafka account username]
        password: [Citrix Analytics Kafka account password]
        ca_file: [Path to the Citrix Analytics certificate file (.pem)]
        use_tls: true
        insecure_skip_verify: true
    labels:
      job: kafka_casp
  relabel_configs:
      - action: replace
        source_labels:
          - __meta_kafka_topic
        target_label: topic
  pipeline_stages:
  - match:
      selector: '{job = "kafka_casp"} |= "sessionKey"'
      stages:
      - json:
          expressions:
            eventType: eventType
            siteName: siteName
            deliveryGroupName: deliveryGroupName
            protocol: protocol
            timestamp: timestamp
      - timestamp:
          source: timestamp
          format: 2006-01-02T15:04:05Z
      - labels:
          eventType:
          siteName:
          deliveryGroupName:
          protocol:
  - match:
      selector: '{job = "kafka_casp"} != "sessionKey"'
      stages:
      - json:
          expressions:
            eventType: eventType
            siteName: siteName
            deliveryGroupName: deliveryGroupName
            machineName: machineName
            timestamp: timestamp
      - timestamp:
          source: timestamp
          format: 2006-01-02 15:04:05
      - labels:
          eventType:
          siteName:
          deliveryGroupName:
          machineName:

<!--NeedCopy-->
Based on the preceding configuration, Promtail connects to the Citrix Analytics brokers and consumes the Citrix Analytics for Performance records. TThe consumed Kafka topic includes Session and Machine records.
The Promtail separates the Session and Machine details using the eventType label, but also adds labels like the siteName and the deliveryGroupName. The event timestamp field is parsed and overrides the final time value of the logs stored in Loki.
You can download the certificate file referenced in the preceding configuration using the following steps:
- Go to Citrix Analytics > Settings > Data Exports > Security.
- Click the SIEM Environment Setup pane and select the Others option.
-
Download the PEM file and store it in the system that hosts the
Promtailagent.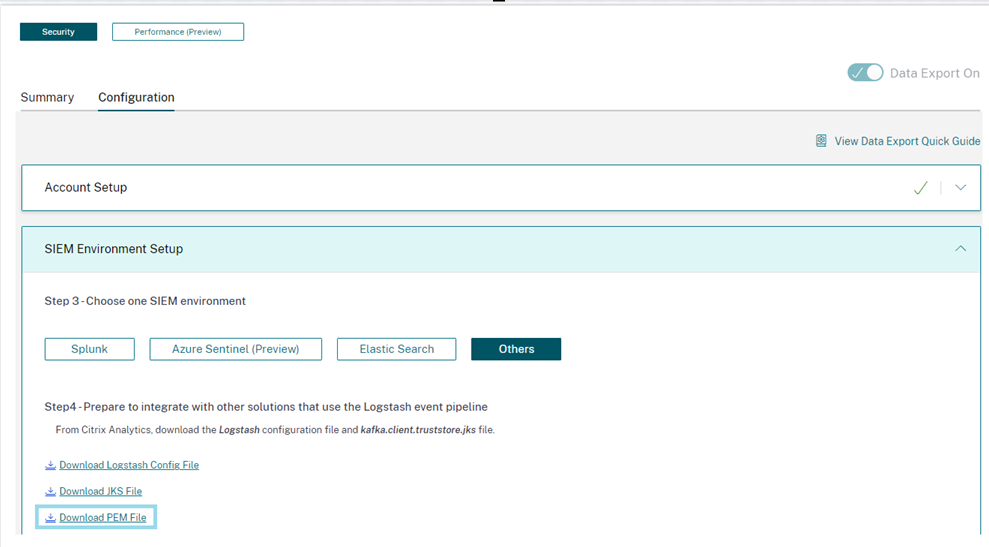
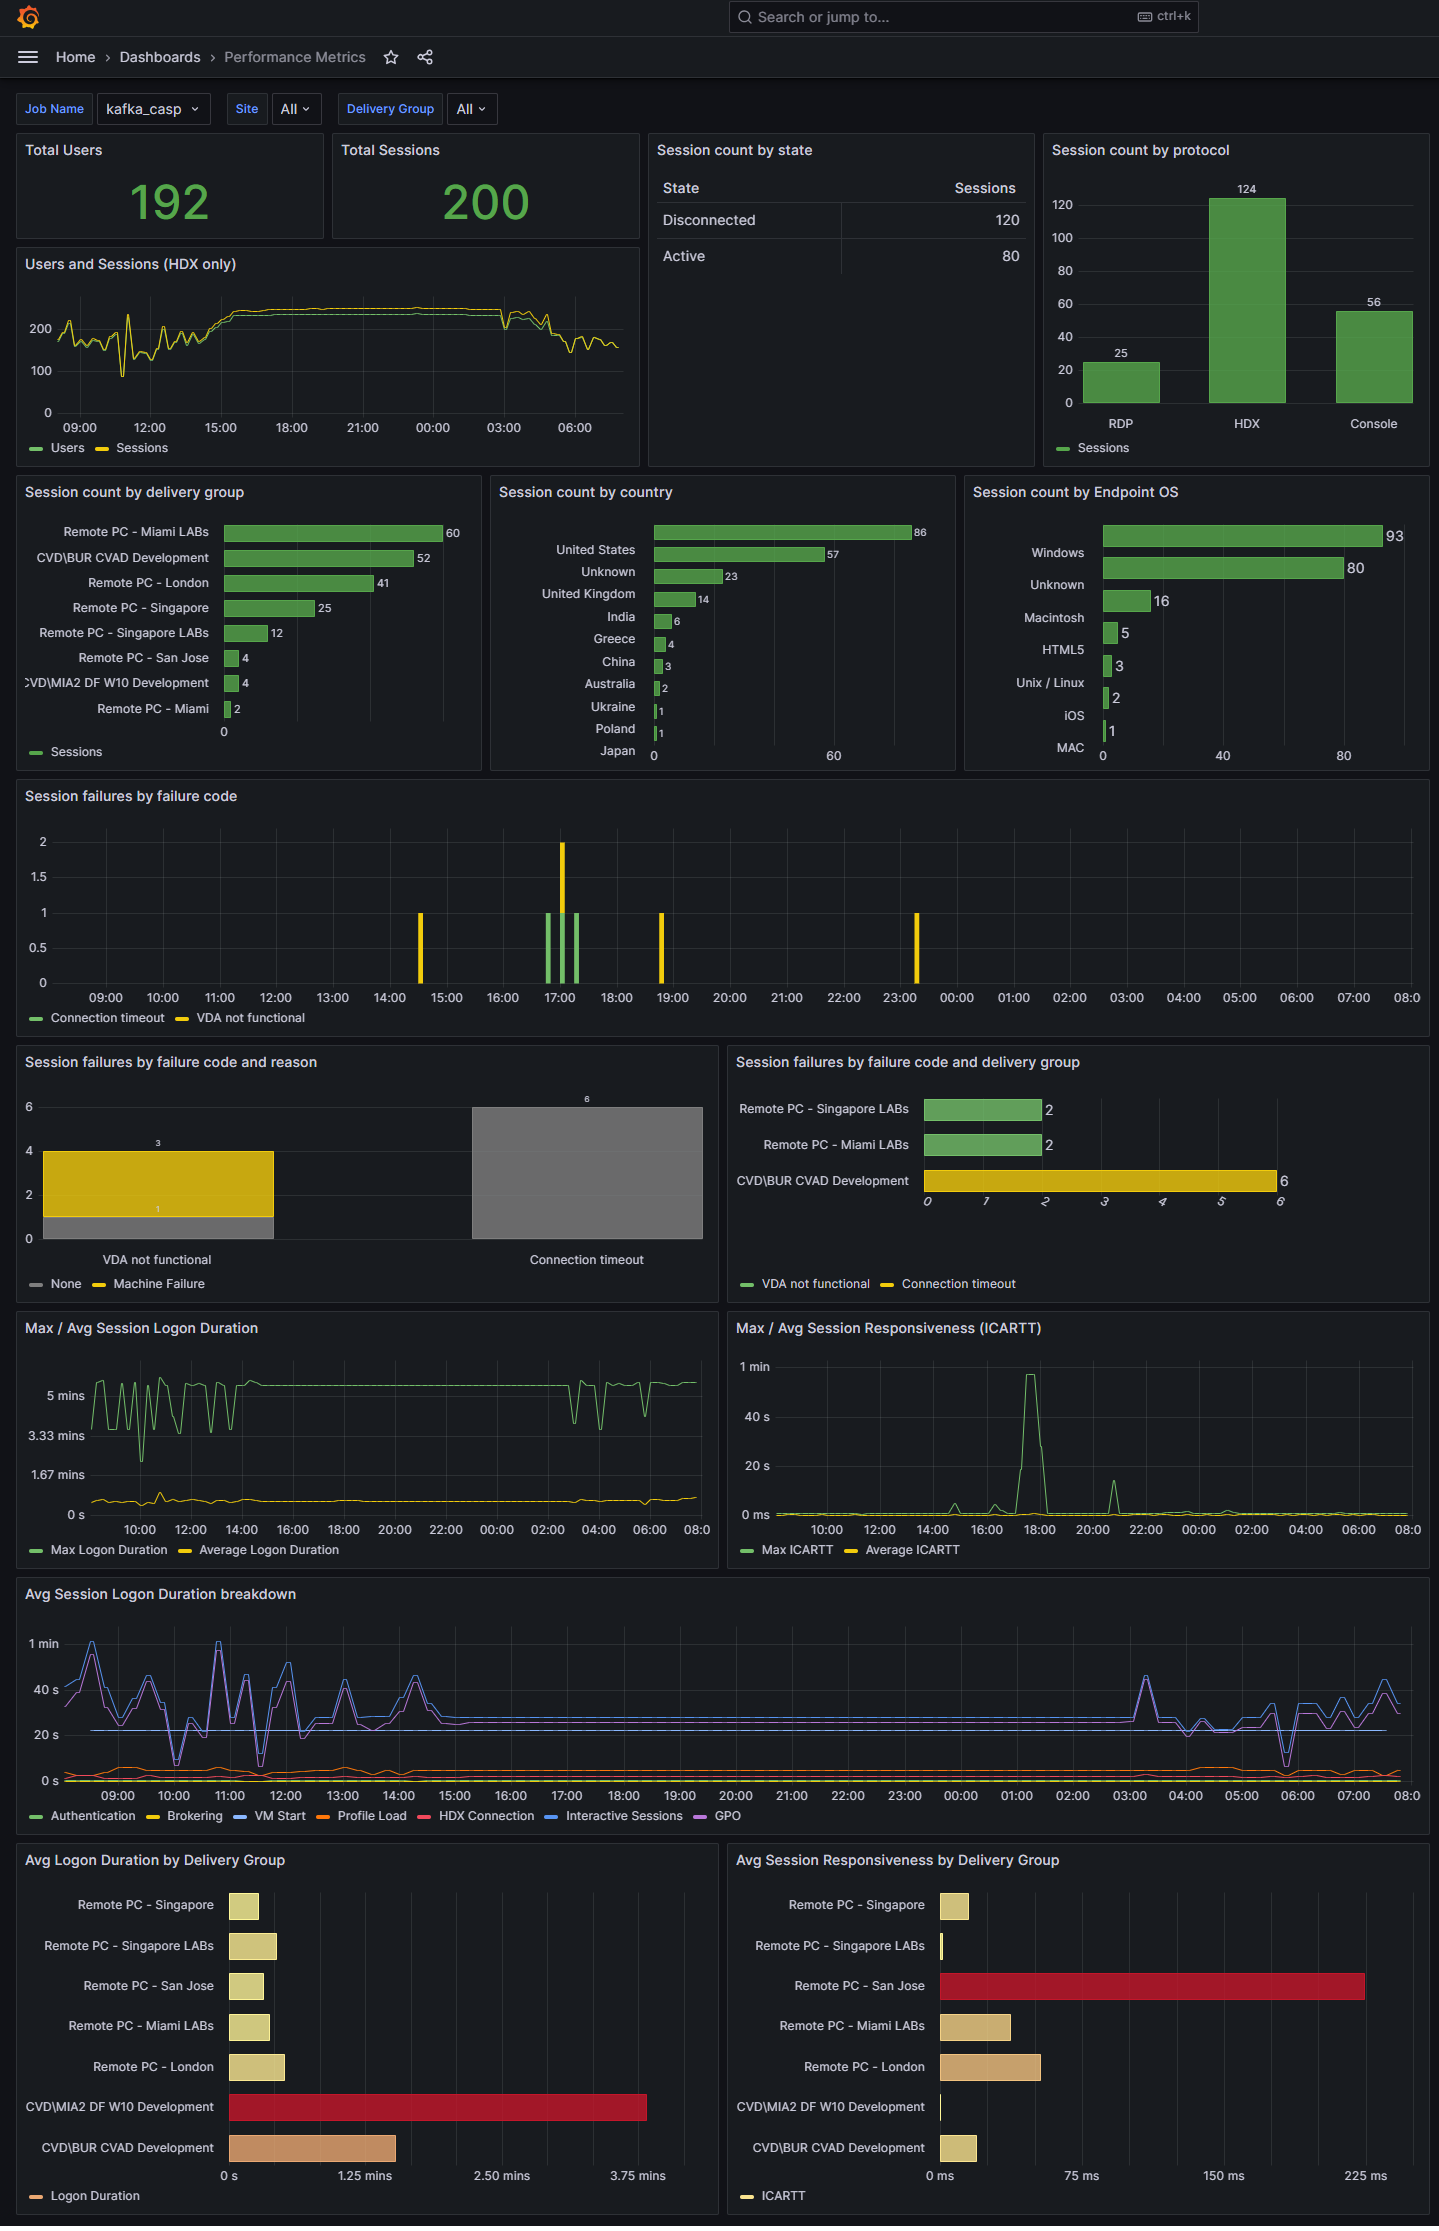
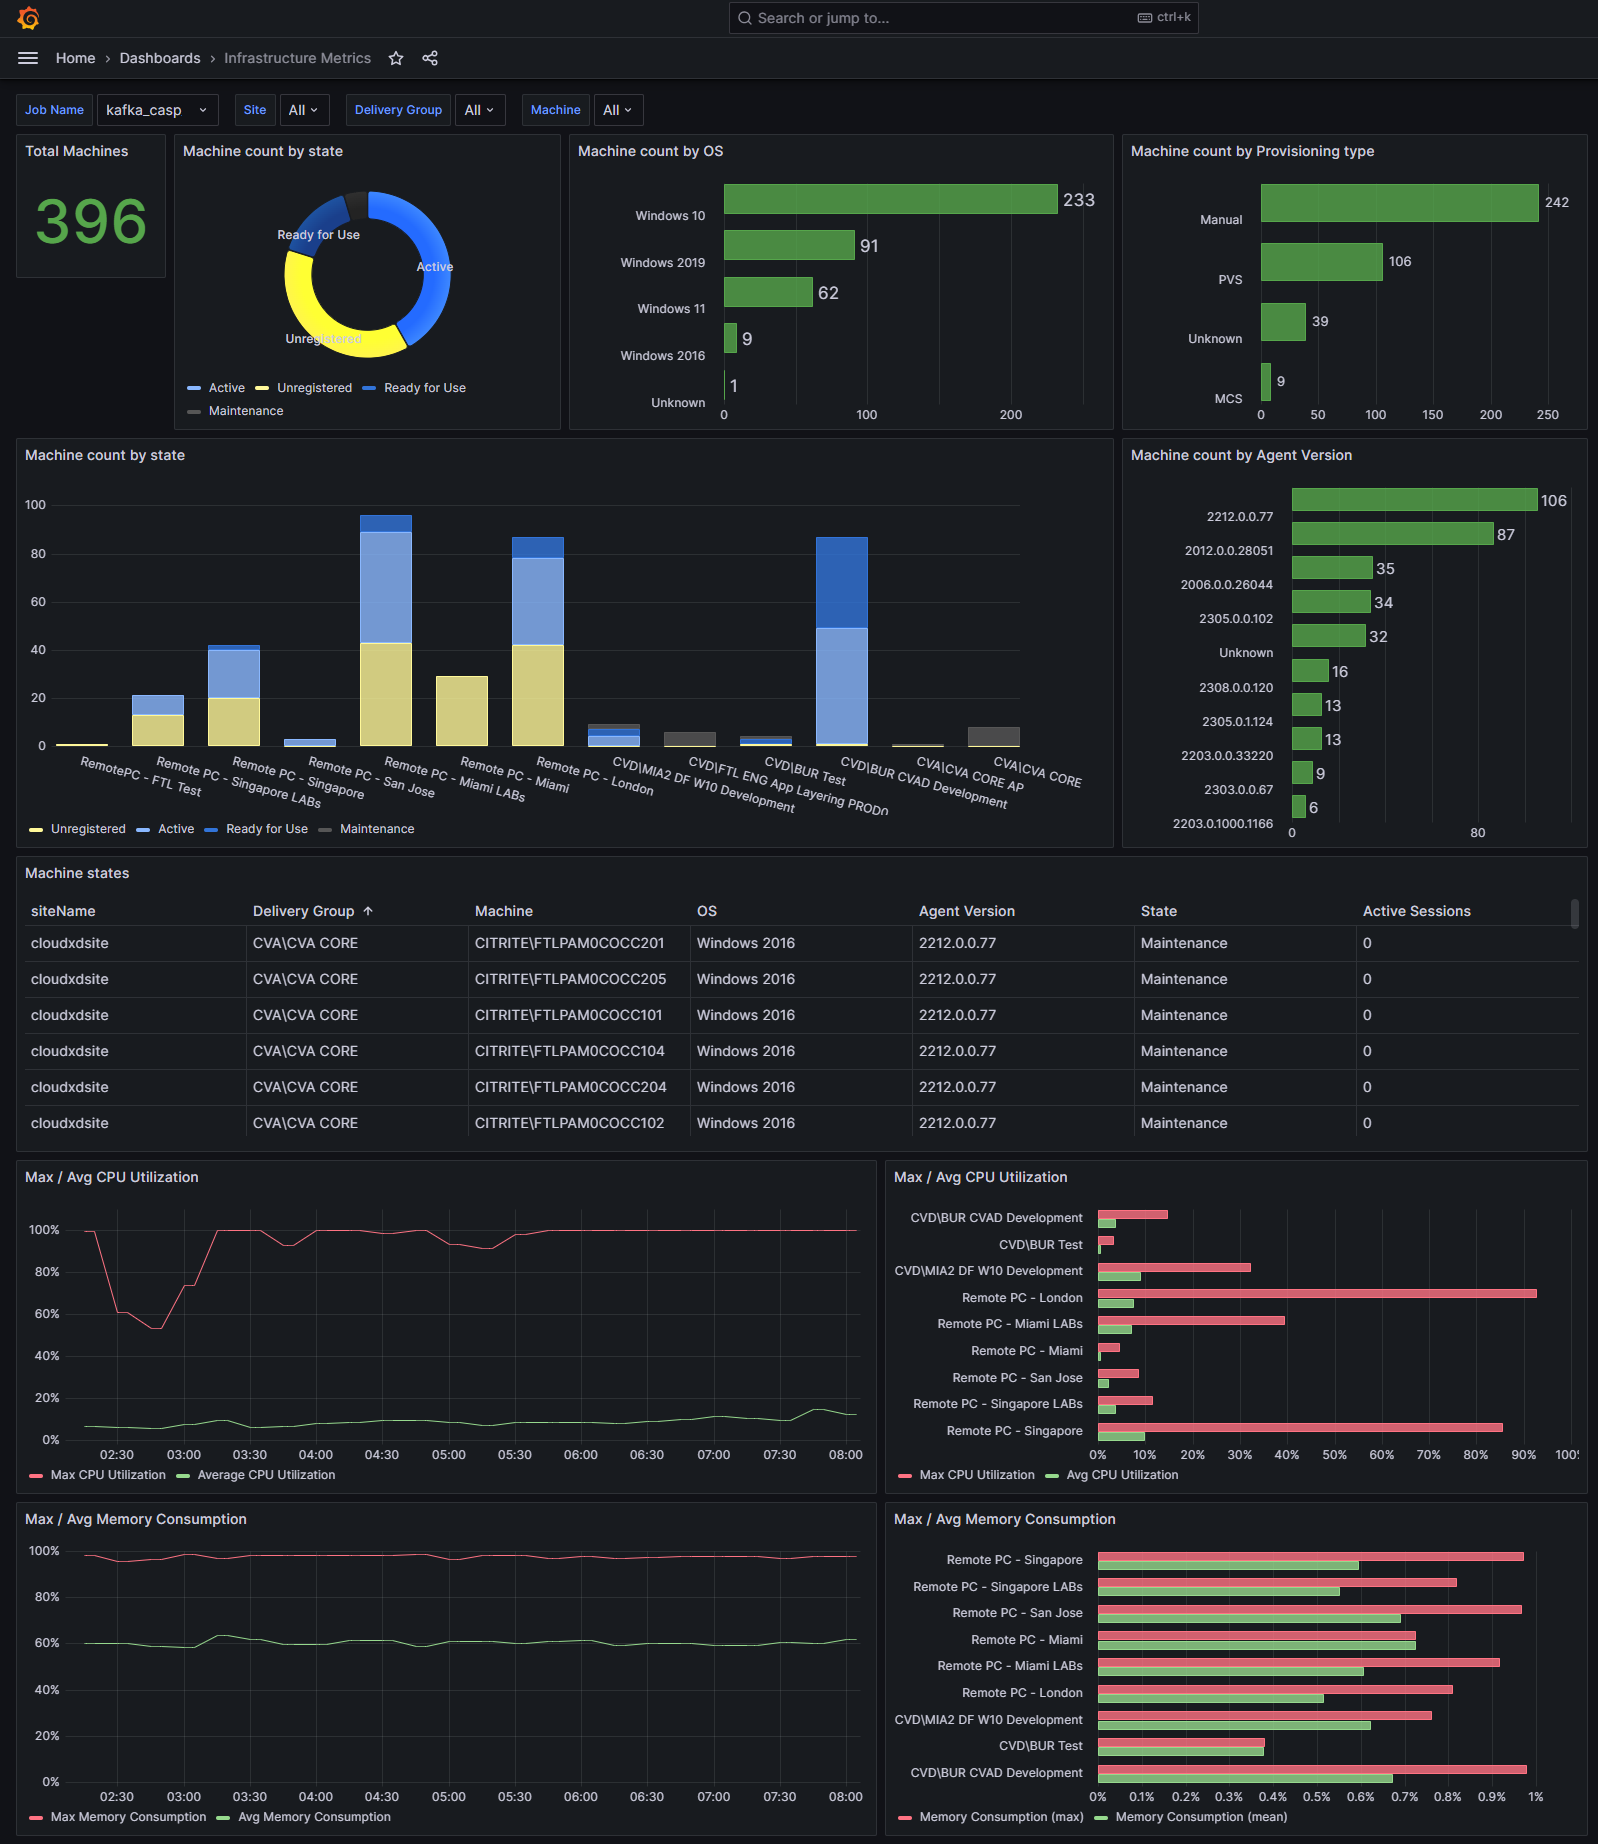
Grafana dashboard sample
You can import the sample Grafana dashboard provided by Citrix which includes:
- Metrics
- Time charts
- Other useful visualizations of session and infrastructure telemetry.
You can download the dashboard definitions (JSON files) from the Citrix Analytics downloads page.
You can import the dashboard files into your Grafana instance, either to a Grafana cloud or to an enterprise account.
Before importing the dashboard, make sure that you have properly configured your Loki data source in Grafana. During the dashboard importing, you’re prompted to select the Loki data source. After the dashboard is imported, you can view the dashboards on Grafana.
Following are the sample dashboards: