Leveraging Citrix Analytics SIEM Data Model for Threat Analysis and Data Correlation
This article explains the entity data relationship that’s exhibited by the events sent to a customer’s SIEM environment. To elucidate this, let’s take an example of a threat hunting scenario where the attributes - client IP and OS are the focal points. The following ways to correlate the said attributes to the user will be discussed:
- Using custom risk indicator insights
- Using data source events
Splunk is the SIEM environment chosen to be showcased in the following example. Similar data correlation can also be performed on Sentinel using workbook template by Citrix Analytics. To explore this further, refer Citrix Analytics workbook for Microsoft Sentinel.
Custom Risk Indicator Insights
As mentioned in Citrix Analytics data exports format for SIEM, indicator summary and event details insights are part of the default risk insights data set. For Citrix Virtual Apps and Desktops indicator dataset, client IP and OS get exported by default. Hence, if an administrator sets up a custom indicator with or without the condition including these fields, the said data points would flow into your Splunk environment.
Setting Custom Risk Indicator In Citrix Analytics
-
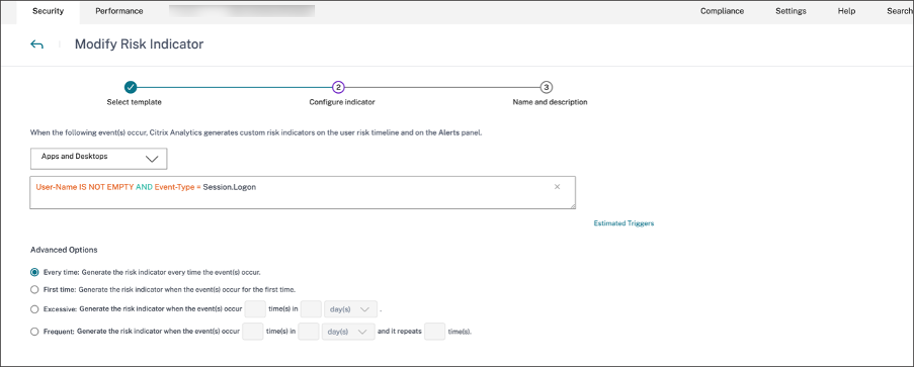
Navigate to Citrix Analytics for Security™ dashboard > Custom Risk Indicators > Create Indicator. You can create a custom risk indicator with any condition that assists you in monitoring the user’s behavior. After you have set up the custom indicator, all the users who trigger the associated condition are visible in your Splunk environment.
-
To view the created risk indicator occurrences on the Citrix Analytics for Security, navigate to Security > Users. Navigate to the bottom of the page and click the plus (+) icon.
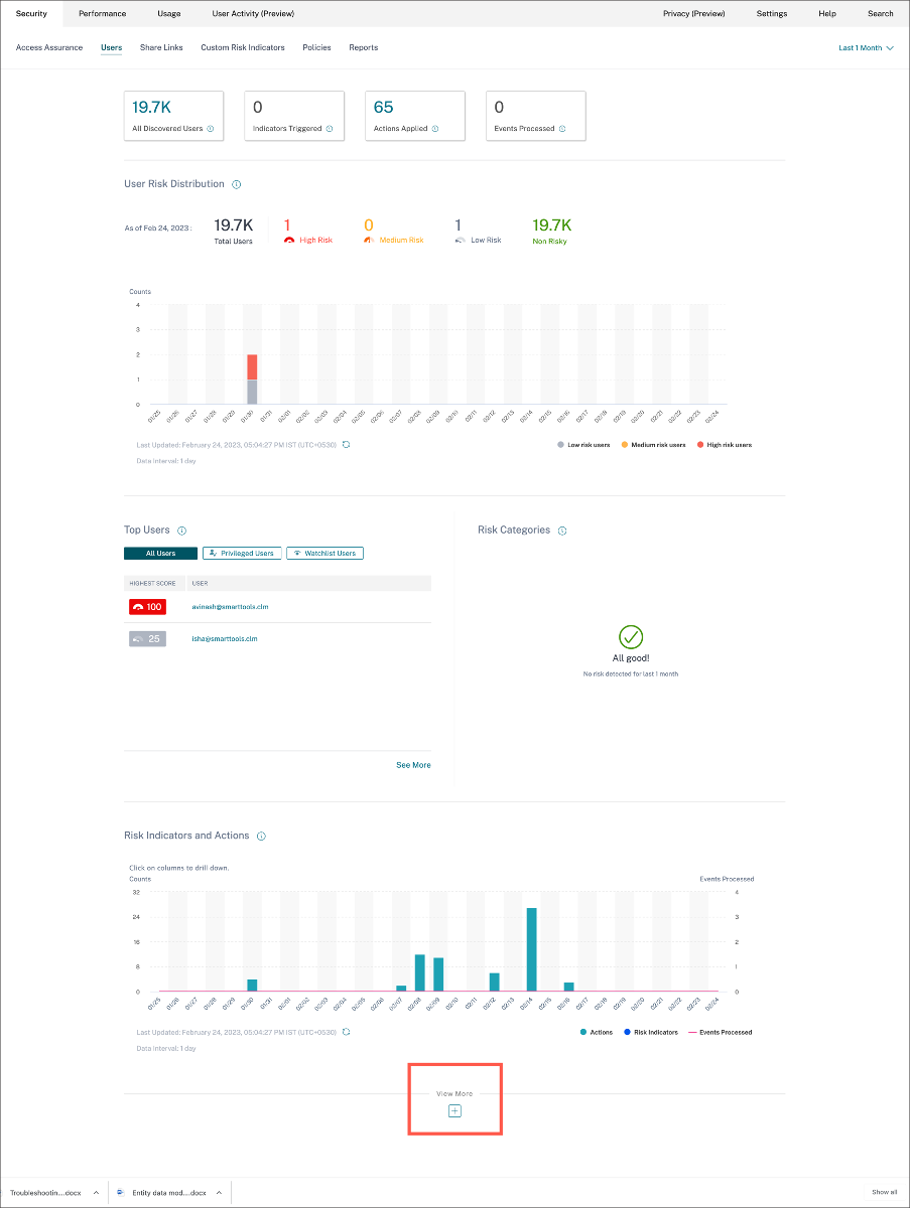
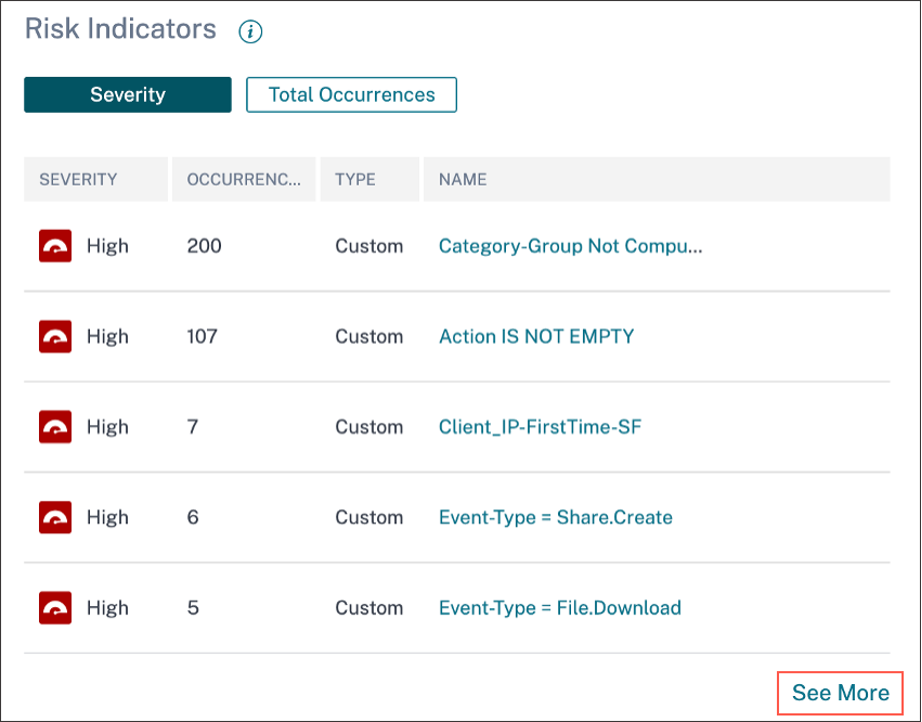
The Risk Indicators card appears. You can view the details of Risk Indicator, severity, and occurrence.
-
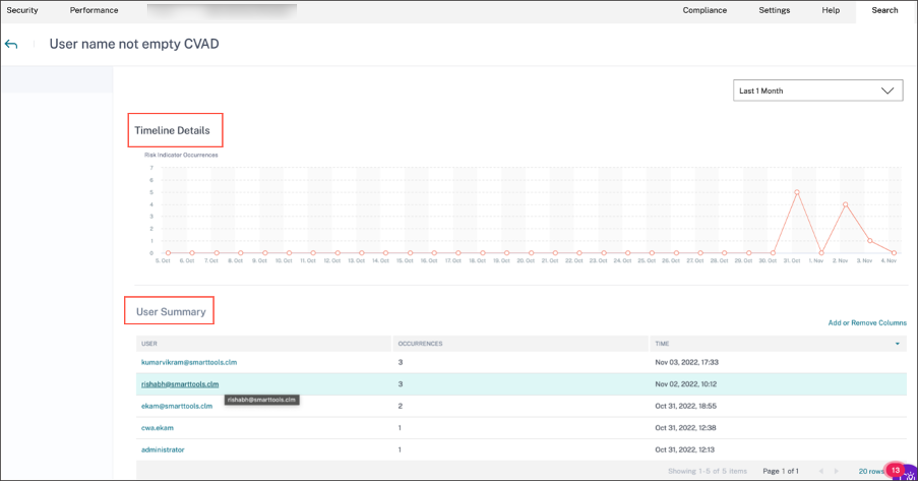
Click See More. The Risk Indicator Overview page appears.
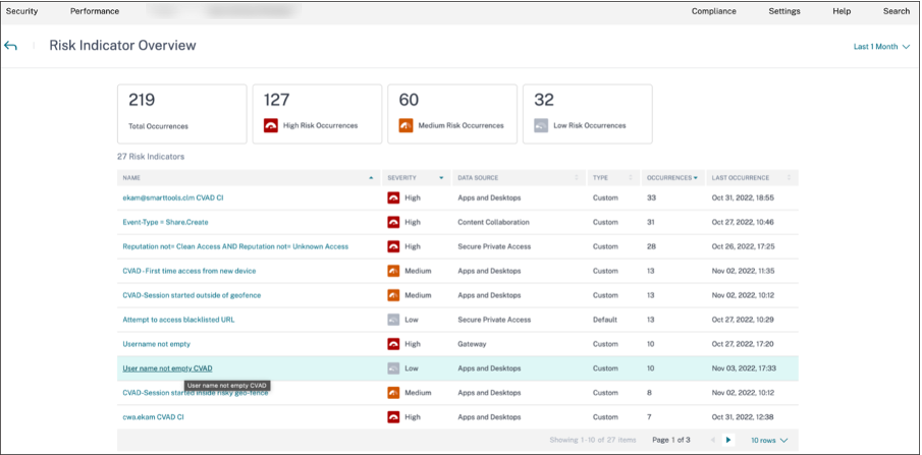
In the Risk Indicator Overview page, you can view the user’s details who have triggered the indicator with a detailed timeline view and user summary. To understand more about the timeline, see User risk timeline and profile.
Risk Indicator Occurrences on Splunk - Raw Queries
You can also get the client IP and OS information by using the index and source type that was used by the Splunk infrastructure administrator while setting up the data input on Splunk Enterprise for Citrix Analytics for Security Add-on.
-
Navigate to Splunk > New Search. In the search query, enter and run the following query:
index=<index configured by you> sourcetype=<sourcetype configured by you> AND "<tenant_id>" AND "<indicator name configured by you on CAS>" AND "<user you are interested in>"

<!--NeedCopy-->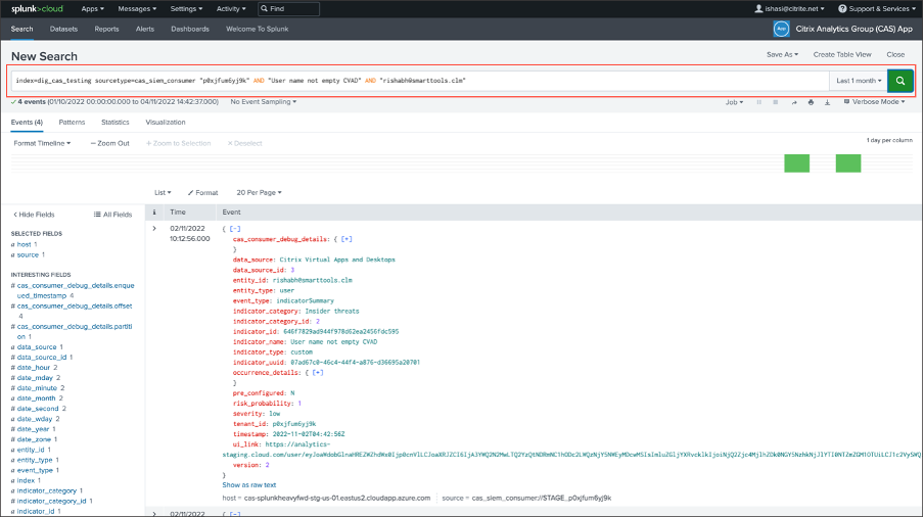
-
Pick up the indicator_uuid and run the following query:
index=<index configured by you> sourcetype=<sourcetype configured by you> "<tenant_id>" AND "<indicator_uuid>"

<!--NeedCopy-->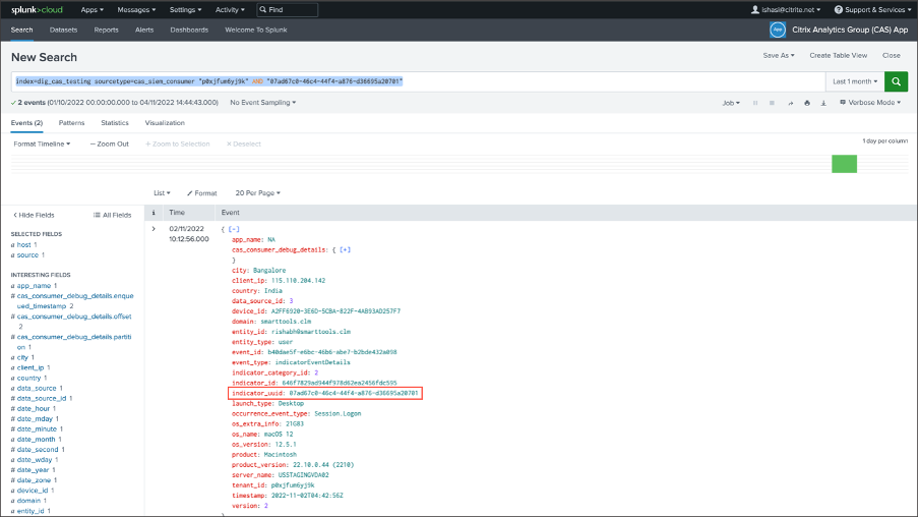
The event result contains the Indicator Event Summary and Indicator Event Details (the activity that is triggered by your indicator). The event detail contains the Client IP and OS information (name, version, extra information).
To understand more about the data format, refer Citrix Analytics data exports format for SIEM.
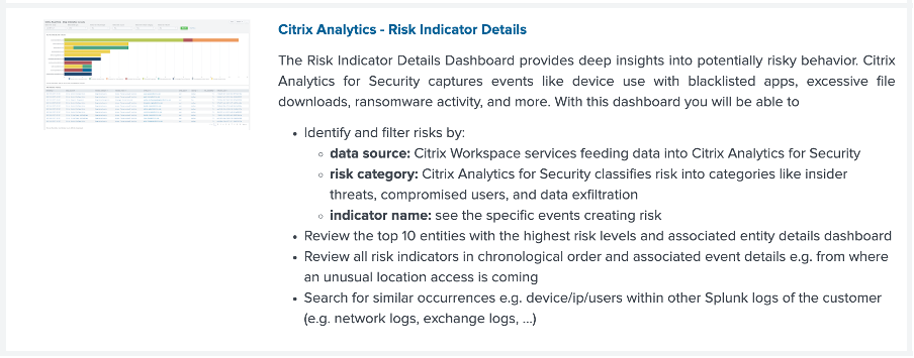
Risk Indicator Occurrences on Splunk - Dashboarding App
Refer the following articles for guidance on how to install Citrix Analytics App for Splunk:
-
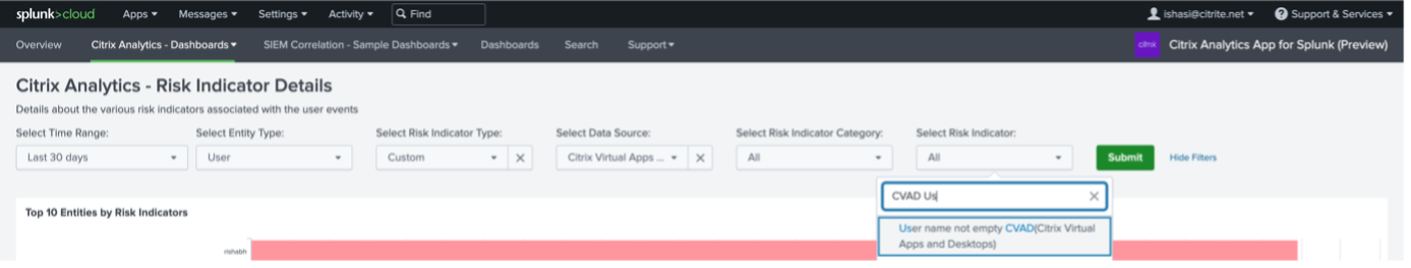
Click Citrix Analytics – Dashboard tab and select the Risk Indicator Details option from the drop-down list.
-
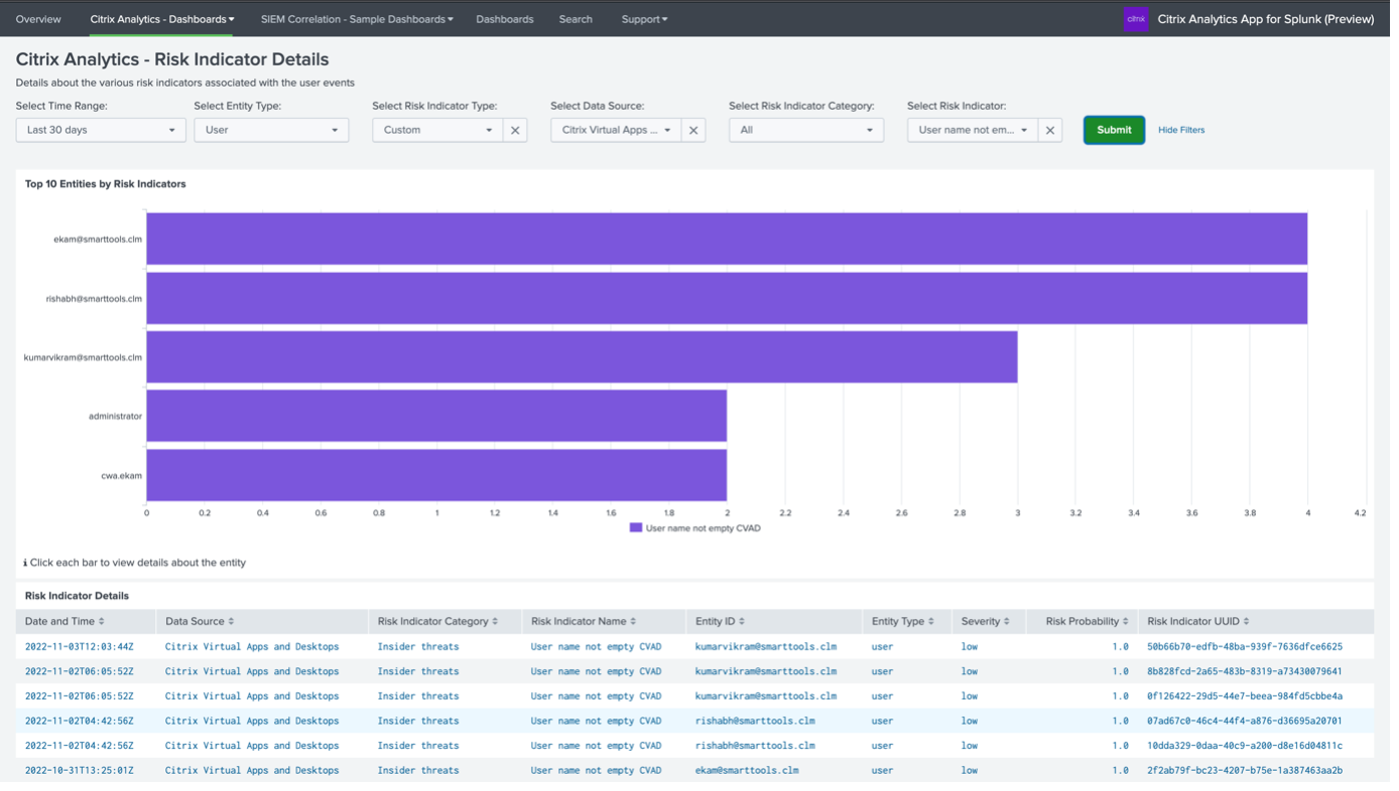
Filter the content appropriately from the drop-down list and click Submit.
-
Click the user instance to get the details.
-
You can view the Client IP and OS information (name, version, extra information) at the bottom of this page:
Data source events
Another method to get the Client IP and OS details in your Splunk environment is by configuring Data source events for export. This capability lets events present in the Self-Service Search view flow directly into your Splunk environment. For more information on how to configure event types for Virtual Apps and Desktops to be exported to SIEM, refer the following articles:
-
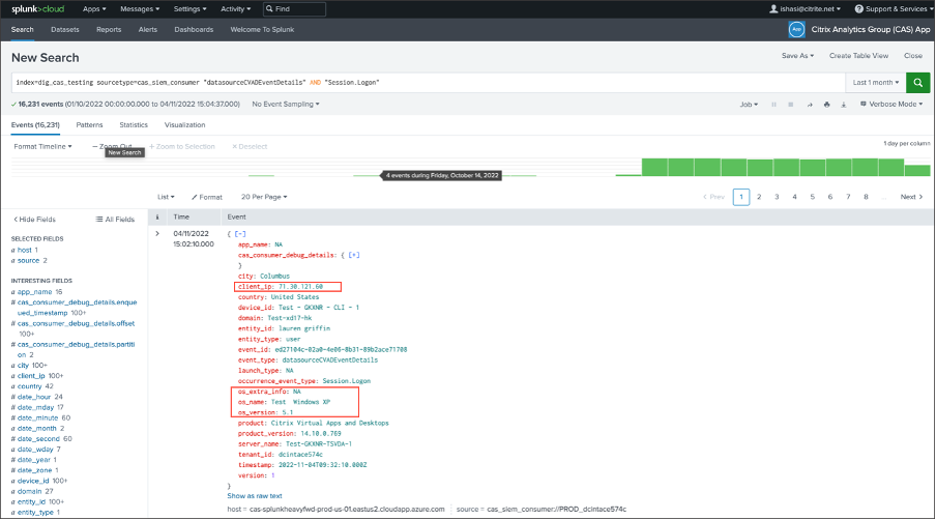
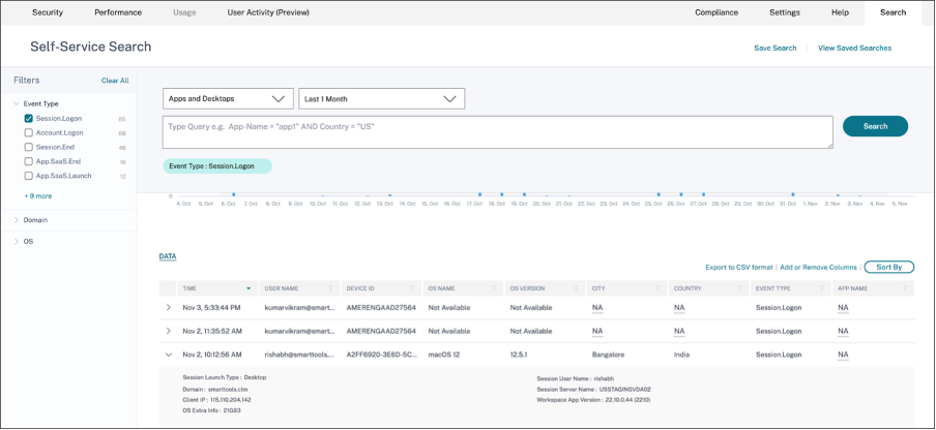
Navigate to Citrix Analytic for Security dashboard > Search. In this Self-Service Search page, all the event types and its related information are available. You can see the Session.Logon event type as an example in the following screenshot:
-
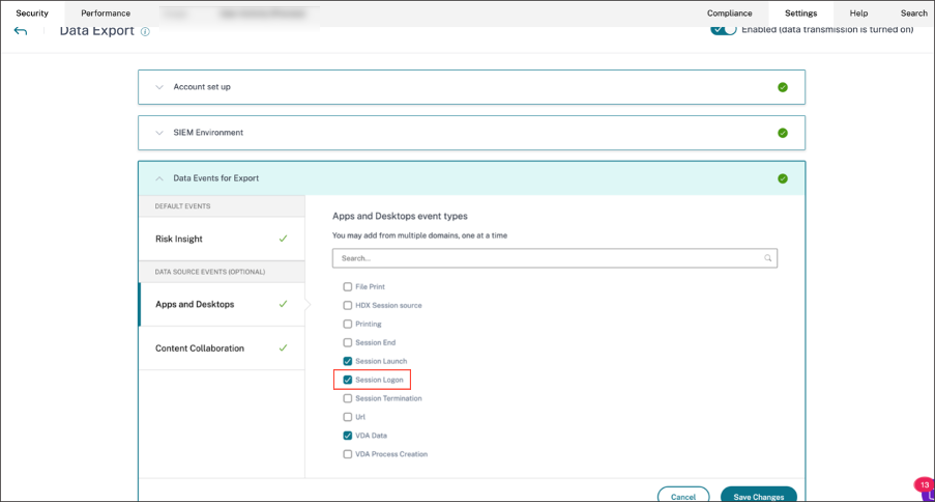
Configure Session.Logon in Data source events for Export and hit Save to let it flow into your Splunk environment.
-
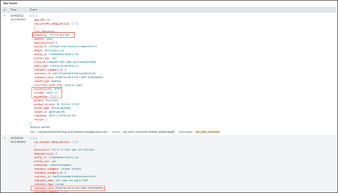
Go to Splunk then enter and run the following query:
index="<index you configured>" sourcetype="<sourcetype you configured>" "<tenant_id>" AND "datasourceCVADEventDetails" AND "Session.Logon"  AND "<user you’re interested in>"

<!--NeedCopy-->
The fields pertaining to Client IP and OS are highlighted.