Citrix Analytics data exports format for SIEM
Citrix Analytics for Security™ allows you to integrate with your Security Information and Event Management (SIEM) services. This integration enables Citrix Analytics for Security to send data to your SIEM services and helps you gain insight into your organization’s security risk posture.
Currently, you can integrate Citrix Analytics for Security with the following SIEM services:
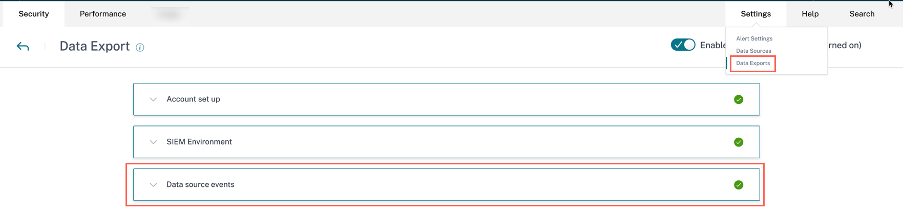
The Data Exports option is now globally available under Settings. To view the Data source events, navigate to Settings > Data Exports > Data source events.
The risk insights data sent by Citrix Analytics for Security to your SIEM service are of two types:
- Risk insights events (Default exports)
-
Data Source events (Optional exports)
Risk insights data for SIEM
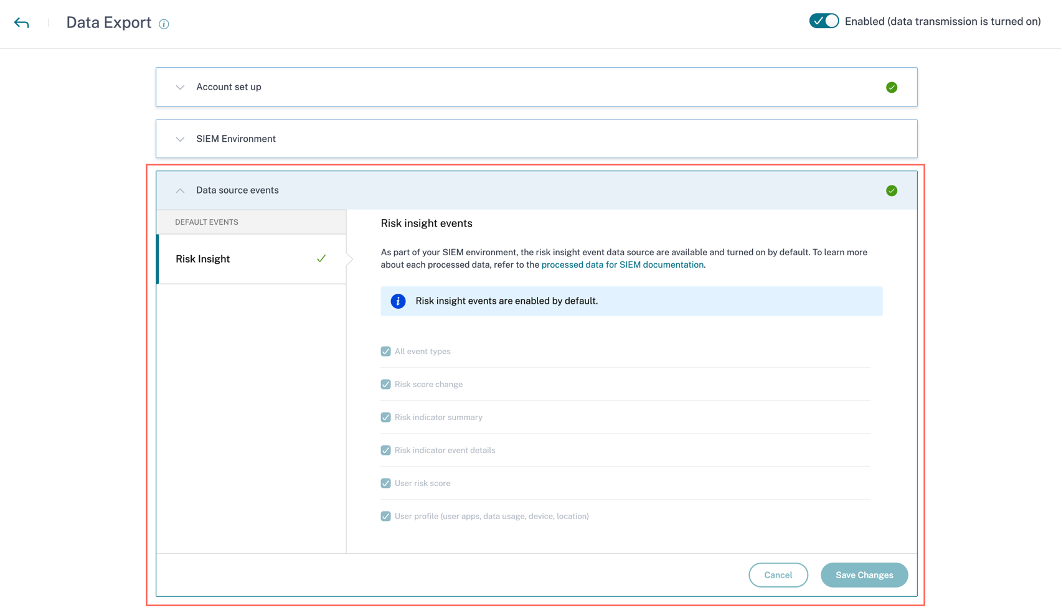
Once you have completed the account configuration and SIEM setup, default datasets (risk insights events) start flowing into your SIEM deployment. Risk insights datasets include user risk score events, user profile events, and risk indicator alerts. These are generated by Citrix Analytics machine learning algorithms and user behavior analysis, by leveraging user events.
The risk insights datasets of a user include the following:
- Risk score change: Indicates a change in the user’s risk score. When a user’s risk score change is equal to or more than 3 and this change increases at any rate or drops by more than 10%, the data is sent to the SIEM service.
- Risk indicator summary: The details of the risk indicator triggered for a user.
- Risk indicator event details: The user events associated with a risk indicator. Citrix Analytics sends a maximum of 1000 event details for each risk indicator occurrence to your SIEM service. These events are sent in chronological order of occurrence.
- User risk score event: The current risk score of a user. Citrix Analytics for Security sends this data to the SIEM service every 12 hours.
-
User profile: The user profile data can be categorized into:
- User apps: The applications that a user has launched and used. Citrix Analytics for Security retrieves this data from Citrix Virtual Apps™ and sends it to the SIEM service every 12 hours.
- User device: The devices associated with a user. Citrix Analytics for Security retrieves this data from Citrix Virtual Apps and Citrix Endpoint Management™ and sends it to SIEM service every 12 hours.
- User location: The city that a user was last detected in. Citrix Analytics for Security retrieves this data from Citrix Virtual Apps and Desktops™ and Citrix DaaS (formerly Citrix Virtual Apps and Desktops service). Citrix Analytics for Security sends this information to your SIEM service every 12 hours.
- User client IP: The client IP address of the user device. Citrix Analytics for Security retrieves this data from Citrix Virtual Apps and Desktops and Citrix DaaS™ (formerly Citrix Virtual Apps and Desktops service), and sends this information to your SIEM service every 12 hours.
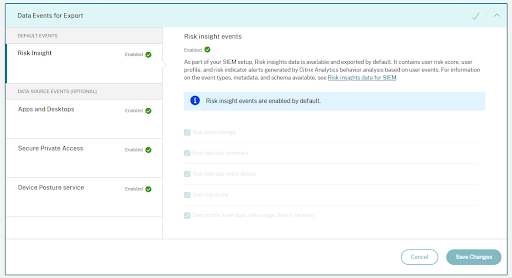
If you are only able to view but unable to configure data source event preferences, then you do not have the necessary administrator permissions. To learn more, see Manage Administrator roles for Security Analytics.
In the following example, the Save Changes button is disabled. The risk insight events are enabled by default.
Schema details of the risk insights events
The following section describes the schema of the processed data generated by Citrix Analytics for Security.
Note
The field values shown in the following schema samples are only for representational purposes. The actual field values vary based on the user profile, user events, and the risk indicator.
The following table describes the field names that are common across the schema for all user profile data, user risk score, and risk score change.
| Field name | Description |
|---|---|
entity_id |
The identity associated with the entity. In this case, the entity is the user. |
entity_type |
The entity at risk. In this case, the entity is the user. |
event_type |
The type of data sent to your SIEM service. For example: user’s location, user’s data usage, or user’s device access information. |
tenant_id |
The unique identity of the customer. |
timestamp |
The date and time of the recent user activity. |
version |
The schema version of the processed data. The current schema version is 2. |
User profile data schema
User location schema
{
  "tenant_id": "demo_tenant", "entity_id": "demo_user", "entity_type": "user", "timestamp": "2021-02-10T15:00:00Z", "event_type": "userProfileLocation", "country": "India", "city": "Bengaluru", "cnt": 4, "version": 2
  }

<!--NeedCopy-->
Field description for user location
| Field name | Description |
|---|---|
event_type |
The type of data sent to the SIEM service. In this case, the event type is the user’s location. |
country |
The country from where the user has logged in. |
city |
The city from where the user has logged in. |
cnt |
The number of times the location was accessed in the last 12 hours. |
User client IP schema
{
  "client_ip": "149.147.136.10",
  "cnt": 3,
  "entity_id": "r2_up_user_1",
  "entity_type": "user",
  "event_type": "userProfileClientIps",
  "tenant_id": "xaxddaily1",
  "timestamp": "2023-09-18T10:45:00Z",
  "version": 2
}


<!--NeedCopy-->
Field description for client IP
| Field name | Description |
|---|---|
client_ip |
The IP address of the user device. |
cnt |
The number of times the user has accessed the device in the last 12 hours. |
entity_id |
The identity associated with the entity. In this case, the entity is the user. |
entity_type |
The entity at risk. In this case, the event type is the user’s client IP. |
event_type |
The type of data sent to your SIEM service. For example: the user’s location, the user’s data usage, or the user’s device access information. |
tenant_id |
The unique identity of the customer. |
timestamp |
The date and time of the recent user activity.. |
version |
The schema version of the processed data. The current schema version is 2. |
User data usage schema
{
  "data_usage_bytes": 87555255, "deleted_file_cnt": 0, "downloaded_bytes": 87555255, "downloaded_file_cnt": 5, "entity_id": "demo@demo.com", "entity_type": "user", "event_type": "userProfileUsage", "shared_file_cnt": 0, "tenant_id": "demo_tenant", "timestamp": "2021-02-10T21:00:00Z", "uploaded_bytes": 0, "uploaded_file_cnt": 0, "version": 2
  }

<!--NeedCopy-->
Field description for user data usage
| Field name | Description |
|---|---|
data_usage_bytes |
The amount of data (in bytes) used by the user. It is the aggregate of the downloaded and uploaded volume for a user. |
deleted_file_cnt |
The number of files deleted by the user. |
downloaded_bytes |
The amount of data downloaded by the user. |
downloaded_file_count |
The number of files downloaded by the user. |
event_type |
The type of data sent to the SIEM service. In this case, the event type is the user’s usage profile. |
shared_file_count |
The number of files shared by the user. |
uploaded_bytes |
The amount of data uploaded by the user. |
uploaded_file_cnt |
The number of files uploaded by the user. |
User device schema
{
  "cnt": 2, "device": "user1612978536 (Windows)", "entity_id": "demo", "entity_type": "user", "event_type": "userProfileDevice", "tenant_id": "demo_tenant", "timestamp": "2021-02-10T21:00:00Z", "version": 2
  }

<!--NeedCopy-->
Field description for user device.
| Field name | Description |
|---|---|
cnt |
The number of times the device is accessed in the last 12 hours. |
device |
The name of the device. |
event_type |
The type of data sent to the SIEM service. In this case, the event type is the user’s device access information. |
User app schema
{
  "tenant_id": "demo_tenant", "entity_id": "demo", "entity_type": "user", "timestamp": "2021-02-10T21:00:00Z", "event_type": "userProfileApp", "version": 2, "session_domain": "99e38d488136f62f828d4823edd120b4f32d724396a7410e6dd1b0", "user_samaccountname": "testnameeikragz779", "app": "Chromeeikragz779", "cnt": 189
  }

<!--NeedCopy-->
Field description for user app.
| Field name | Description |
|---|---|
event_type |
The type of data sent to the SIEM service. In this case, the event type is the user’s device access information. |
session_domain |
The ID of the session that the user has logged on. |
user_samaccountname |
The logon name for clients and servers from a previous version of Windows such as Windows NT 4.0, Windows 95, Windows 98, and LAN Manager. This name is used to log on to Citrix StoreFront and also logon to a remote Windows machine. |
app |
The name of the application accessed by the user. |
cnt |
The number of times the application is accessed in the last 12 hours. |
User risk score schema
{
  "cur_riskscore": 7, "entity_id": "demo", "entity_type": "user", "event_type": "userProfileRiskscore", "last_update_timestamp": "2021-01-21T16:14:29Z", "tenant_id": "demo_tenant", "timestamp": "2021-02-10T20:45:00Z", "version": 2
  }

<!--NeedCopy-->
Field description for user risk score.
| Field name | Description |
|---|---|
cur_riskscore |
The current risk score assigned to the user. The risk score varies from 0 to 100 depending on the threat severity associated with the user’s activity. |
event_type |
The type of data sent to the SIEM service. In this case, the event type is the user’s risk score. |
last_update_timestamp |
The time when the risk score was last updated for a user. |
timestamp |
The time when the user risk score event is collected and sent to your SIEM service. This event is sent to your SIEM service after every 12 hours. |
Risk score change schema
Sample 1:
{
  "alert_message": "Large risk score drop percent since last check", "alert_type": "riskscore_large_drop_pct", "alert_value": -21.73913, "cur_riskscore": 18, "entity_id": "demo_user", "entity_type": "user", "event_type": "riskScoreChange", "tenant_id": "demo_tenant", "timestamp": "2021-02-11T05:45:00Z", "version": 2
  }

<!--NeedCopy-->
Sample 2:
{
  "alert_message": "Risk score increase since last check", "alert_type": "riskscore_increase", "alert_value": 39.0, "cur_riskscore": 76, "entity_id": "demo_user", "entity_type": "user", "event_type": "riskScoreChange", "tenant_id": "demo_tenant", "timestamp": "2021-02-11T03:45:00Z", "version": 2
  }

<!--NeedCopy-->
Field description for risk score change.
| Field name | Description |
|---|---|
alert_message |
The message displayed for the risk score change. |
alert_type |
Indicates whether the alert is for increase in risk score or significant drop in risk score percentage. When a user’s risk score change is equal to or more than three and this change increases at any rate or drops by more than 10%, the data is sent to the SIEM service. |
alert_value |
A numerical value assigned for the risk score change. The risk score change is the difference between the current risk score and the previous risk score for a user. The alert value varies from -100 to 100. |
cur_riskscore |
The current risk score assigned to the user. The risk score varies from 0 to 100 depending on the threat severity associated with the user’s activity. |
event_type |
The type of data sent to the SIEM service. In this case, the event type is the change in the user’s risk score. |
timestamp |
The date and time when the latest change in the risk score is detected for the user. |
Risk indicator schema
The risk indicator schema consists of two parts: indictor summary schema and indicator event details schema. Based on the risk indicator, the fields and their values in the schema change accordingly.
The following table describes the field names common across all indicator summary schema.
| Field name | Description |
|---|---|
data source |
The products that send data to Citrix Analytics for Security. For example: Citrix Secure Private Access™, Citrix Gateway, and Citrix Apps and Desktops. |
data_source_id |
The ID associated with a data source. ID 1 = Citrix Gateway, ID 2 = Citrix Endpoint Management, ID 3 = Citrix Apps and Desktops, ID 4 = Citrix Secure Private Access |
entity_type |
The entity at risk. It can be a user. |
entity_id |
The ID associated with the entity at risk. |
event_type |
The type of data sent to the SIEM service. In this case, the event type is the summary of the risk indicator. |
indicator_category |
Indicates the categories of risk indicators. The risk indicators are grouped into one of the risk categories- compromised endpoint, compromised users, data exfiltration, or insider threats. |
indicator_id |
The unique ID associated with the risk indicator. |
indicator_category_id |
The ID associated with a risk indicator category. ID 1 = Data exfiltration, ID 2 = Insider threats, ID 3 = Compromised users, ID 4 = Compromised endpoint |
indicator_name |
The name of the risk indicator. For a custom risk indicator, this name is defined while creating the indicator. |
indicator_type |
Indicates whether the risk indicator is default (built-in) or custom. |
indicator_uuid |
The unique ID associated with the risk indicator instance. |
indicator_vector_name |
Indicates the risk vector associated with a risk indicator. The risk vectors are Device-based Risk Indicators, Location-based Risk Indicators, Logon-failure-based Risk Indicators, IP-based Risk Indicators, Data-based Risk Indicators, File-based Risk Indicators, and Other Risk Indicators. |
indicator_vector_id |
The ID associated with a risk vector. ID 1 = Device-based Risk Indicators, ID 2 = Location-based Risk Indicators, ID 3 = Logon-failure-based Risk Indicators, ID 4 = IP-based Risk Indicators, ID 5 = Data-based Risk Indicators, ID 6 = File-based Risk Indicators, ID 7 = Other Risk Indicators, and ID 999 = Not available |
occurrence_details |
The details about the risk indicator triggering condition. |
risk_probability |
Indicates the chances of risk associated with the user event. The value varies from 0 to 1.0. For a custom risk indicator, the risk_probability is always 1.0 because it is a policy-based indicator. |
severity |
Indicates the severity of the risk. It can be low, medium, or high. |
tenant_id |
The unique identity of the customer. |
timestamp |
The date and the time when the risk indicator is triggered. |
ui_link |
The link to the user timeline view on the Citrix Analytics user interface. |
observation_start_time |
The time from which Citrix Analytics starts monitoring the user activity until the time stamp. If any anomalous behavior is detected in this time period, a risk indicator is triggered. |
The following table describes the field names common across all the indicator event details schema.
| Field name | Description |
|---|---|
data_source_id |
The ID associated with a data source. ID 1 = Citrix Gateway, ID 2 = Citrix Endpoint Management, ID 3 = Citrix Apps and Desktops, ID 4 = Citrix Secure Private Access |
indicator_category_id |
The ID associated with a risk indicator category. ID 1 = Data exfiltration, ID 2 = Insider threats, ID 3 = Compromised users, ID 4 = Compromised endpoint |
entity_id |
The ID associated with the entity at risk. |
entity_type |
The entity that is at risk. It can be user. |
event_type |
The type of data sent to the SIEM service. In this case, the event type is the details of the risk indicator event. |
indicator_id |
The unique ID associated with the risk indicator. |
indicator_uuid |
The unique ID associated with the risk indicator instance. |
indicator_vector_name |
Indicates the risk vector associated with a risk indicator. The risk vectors are Device-based Risk Indicators, Location-based Risk Indicators, Logon-failure-based Risk Indicators, IP-based Risk Indicators, Data-based Risk Indicators, File-based Risk Indicators, and Other Risk Indicators. |
indicator_vector_id |
The ID associated with a risk vector. ID 1 = Device-based Risk Indicators, ID 2 = Location-based Risk Indicators, ID 3 = Logon-failure-based Risk Indicators, ID 4 = IP-based Risk Indicators, ID 5 = Data-based Risk Indicators, ID 6 = File-based Risk Indicators, ID 7 = Other Risk Indicators, and ID 999 = Not available |
tenant_id |
The unique identity of the customer. |
timestamp |
The date and the time when the risk indicator is triggered. |
version |
The schema version of the processed data. The current schema version is 2. |
client_ip |
The IP address of the user’s device. |
Note
If an integer data type field value is unavailable, the value assigned is -999. For example,
"latitude": -999,"longitude": -999.If a string data type field value is unavailable, the value assigned is NA. For example,
"city": "NA","region": "NA".
Citrix Secure Private Access risk indicators schema
Attempt to access blacklisted URL risk indicator schema
Indicator summary schema
{
  "tenant_id": "demo_tenant",
  "indicator_id": 401,
  "indicator_uuid": "8f2a39bd-c7c2-5555-a86a-5cfe5b64dfef",
  "indicator_category_id": 2,
  "indicator_vector": {
    "name": "Other Risk Indicators",
    "id": 7 },
  "data_source_id": 4,
  "timestamp": "2018-03-15T10:59:58Z",
  "event_type": "indicatorSummary",
  "entity_type": "user",
  "entity_id": "demo_user",
  "version": 2,
  "risk_probability": 1,
  "indicator_category": "Insider threats",
  "indicator_name": "Attempt to access blacklisted URL",
  "severity": "low",
  "data_source": "Citrix Secure Private Access",
  "ui_link": "https://analytics.cloud.com/user/",
  "indicator_type": "builtin",
  "occurrence_details": {
    "observation_start_time": "2018-03-15T10:44:59Z",
    "relevant_event_type": "Blacklisted External Resource Access"
  }
}

<!--NeedCopy-->
Indicator event details schema
{
  "tenant_id": "demo_tenant",
  "indicator_id": 401,
  "indicator_uuid": "c421f3f8-33d8-59b9-ad47-715b9d4f65f4",
  "indicator_category_id": 2,
  "indicator_vector": {
    "name": "Other Risk Indicators",
    "id": 7 },
  "data_source_id": 4,
  "timestamp": "2018-03-15T10:57:21Z",
  "event_type": "indicatorEventDetails",
  "entity_type": "user",
  "entity_id": "demo_user",
  "version": 2,
  "domain_name": "googleads.g.doubleclick.net",
  "executed_action": "blocked",
  "reason_for_action": "URL Category match",
  "client_ip": "157.xx.xxx.xxx"
}

<!--NeedCopy-->
The following table describes the field names specific to the summary schema and the event details schema for Attempt to access the blacklisted URL.
| Field name | Description |
|---|---|
observation_start_time |
The time from which Citrix Analytics starts monitoring the user activity until the time stamp. If any anomalous behavior is detected in this time period, a risk indicator is triggered. |
executed_action |
The action applied on the blacklisted URL. The action includes Allow and Block. |
reason_for_action |
The reason for the applying the action for the URL. |
Excessive data downloads risk indicator schema
Indicator summary schema
{
  "tenant_id": "demo_tenant",
  "indicator_id": 403,
  "indicator_uuid": "67d21b81-a89a-531e-af0b-c5688c2e9d40",
  "indicator_category_id": 2,
  "indicator_vector": {
    "name": "Other Risk Indicators",
    "id": 7 },
  "data_source_id": 4,
  "timestamp": "2018-03-16T10:59:59Z",
  "event_type": "indicatorSummary",
  "entity_type": "user",
  "entity_id": "demo_user",
  "version": 2,
  "risk_probability": 1,
  "indicator_category": "Insider threats",
  "indicator_name": "Excessive data download",
  "severity": "low",
  "data_source": "Citrix Secure Private Access",
  "ui_link": "https://analytics.cloud.com/user/",
  "indicator_type": "builtin",
  "occurrence_details": {
    "observation_start_time": "2018-03-16T10:00:00Z",
    "data_volume_in_bytes": 24000,
    "relevant_event_type": "External Resource Access"
  }
}

<!--NeedCopy-->
Indicator event details schema
{
  "tenant_id": "demo_tenant",
  "indicator_id": 403,
  "indicator_uuid": "67d21b81-a89a-531e-af0b-c5688c2e9d40",
  "indicator_category_id": 2,
  "indicator_vector": {
    "name": "Other Risk Indicators",
    "id": 7 },
  "data_source_id": 4,
  "timestamp": "2018-03-16T10:30:00Z",
  "event_type": "indicatorEventDetails",
  "entity_type": "user",
  "entity_id": "demo_user",
  "version": 2,
  "domain_name": "www.facebook.com",
  "client_ip": "157.xx.xxx.xxx",
  "downloaded_bytes": 24000
}

<!--NeedCopy-->
The following table describes the field names specific to the summary schema and the event details schema for Excessive data downloads.
| Field name | Description |
|---|---|
observation_start_time |
The time from which Citrix Analytics starts monitoring the user activity until the time stamp. If any anomalous behavior is detected in this time period, a risk indicator is triggered. |
data_volume_in_bytes |
The amount of data in bytes that is downloaded. |
relevant_event_type |
Indicates the type of the user event. |
domain_name |
The name of the domain from which data is downloaded. |
downloaded_bytes |
The amount of data in bytes that is downloaded. |
Unusual upload volume risk indicator schema
Indicator summary schema
{
  "tenant_id": "demo_tenant",
  "indicator_id": 402,
  "indicator_uuid": "4f2a249c-9d05-5409-9c5f-f4c764f50e67",
  "indicator_category_id": 2,
  "indicator_vector": {
    "name": "Other Risk Indicators",
    "id": 7 },
  "data_source_id": 4,
  "timestamp": "2018-03-16T10:59:59Z",
  "event_type": "indicatorSummary",
  "entity_type": "user",
  "entity_id": "demo_user",
  "version": 2,
  "risk_probability": 1,
  "indicator_category": "Insider threats",
  "indicator_name": "Unusual upload volume",
  "severity": "low",
  "data_source": "Citrix Secure Private Access",
  "ui_link": "https://analytics.cloud.com/user/",
  "indicator_type": "builtin",
  "occurrence_details": {
    "observation_start_time": "2018-03-16T10:00:00Z",
    "data_volume_in_bytes": 24000,
    "relevant_event_type": "External Resource Access"
  }
}

<!--NeedCopy-->
Indicator event details schema
{
  "tenant_id": "demo_tenant",
  "indicator_id": 402,
  "indicator_uuid": "c6abf40c-9b62-5db4-84bc-5b2cd2c0ca5f",
  "indicator_category_id": 2,
  "indicator_vector": {
    "name": "Other Risk Indicators",
    "id": 7 },
  "data_source_id": 4,
  "timestamp": "2018-03-16T10:30:00Z",
  "event_type": "indicatorEventDetails",
  "entity_type": "user",
  "entity_id": "demo_user",
  "version": 2,
  "domain_name": "www.facebook.com",
  "client_ip": "157.xx.xxx.xxx",
  "uploaded_bytes": 24000
}

<!--NeedCopy-->
The following table describes the field names specific to the summary schema and the event details schema for Unusual upload volume.
| Field names | Description |
|---|---|
observation_start_time |
The time from which Citrix Analytics starts monitoring the user activity until the time stamp. If any anomalous behavior is detected in this time period, a risk indicator is triggered. |
data_volume_in_bytes |
The amount of data in bytes that is uploaded. |
relevant_event_type |
Indicates the type of the user event. |
domain_name |
The name of the domain in which the data is uploaded. |
uploaded_bytes |
The amount of data in bytes that is uploaded. |
Citrix Endpoint Management risk indicators schema
Jailbroken or rooted device detected indicators schema
Indicator summary schema
{
  "data_source": "Citrix Endpoint Management",
  "data_source_id": 2,
  "indicator_id": 200,
  "indicator_name": "Jailbroken / Rooted Device Detected",
  "entity_id": "demo_user",
  "entity_type": "user",
  "event_type": "indicatorSummary",
  "indicator_category": "Compromised endpoints",
  "indicator_category_id": 4,
  "indicator_vector": {
    "name": "Other Risk Indicators",
    "id": 7 },
  "indicator_type": "builtin",
  "indicator_uuid": "aa872f86-a991-4219-ad01-2a070b6e633d",
  "occurrence_details": {},
  "risk_probability": 1.0,
  "severity": "low",
  "tenant_id": "demo_tenant",
  "timestamp": "2021-04-13T17:49:05Z",
  "ui_link": "https://analytics.cloud.com/user/",
  "version": 2
}

<!--NeedCopy-->
Indicator event details schema
{
  "indicator_id": 200,
  "client_ip": "122.xx.xx.xxx",
  "data_source_id": 2,
  "entity_id": "demo_user",
  "entity_type": "user",
  "event_type": "indicatorEventDetails",
  "indicator_category_id": 4,
  "indicator_vector": {
    "name": "Other Risk Indicators",
    "id": 7 },
  "indicator_uuid": "9aaaa9e1-39ad-4daf-ae8b-2fa2caa60732",
  "tenant_id": "demo_tenant",
  "timestamp": "2021-04-09T17:50:35Z",
  "version": 2
}

<!--NeedCopy-->
Device with blacklisted apps detected
Indicator summary schema
{
  "data_source": "Citrix Endpoint Management",
  "data_source_id": 2,
  "indicator_id": 201,
  "indicator_name": "Device with Blacklisted Apps Detected",
  "entity_id": "demo_user",
  "entity_type": "user",
  "event_type": "indicatorSummary",
  "indicator_category": "Compromised endpoints",
  "indicator_category_id": 4,
  "indicator_vector": {
    "name": "Other Risk Indicators",
    "id": 7 },
  "indicator_type": "builtin",
  "indicator_uuid": "3ff7bd54-4319-46b6-8b98-58a9a50ae9a7",
  "occurrence_details": {},
  "risk_probability": 1.0,
  "severity": "low",
  "tenant_id": "demo_tenant",
  "timestamp": "2021-04-13T17:49:23Z",
  "ui_link": "https://analytics.cloud.com/user/",
  "version": 2
}

<!--NeedCopy-->
Indicator event details schema
{
  "indicator_id": 201,
  "client_ip": "122.xx.xx.xxx",
  "data_source_id": 2,
  "entity_id": "demo_user",
  "entity_type": "user",
  "event_type": "indicatorEventDetails",
  "indicator_category_id": 4,
  "indicator_vector": {
    "name": "Other Risk Indicators",
    "id": 7 },
  "indicator_uuid": "743cd13a-2596-4323-8da9-1ac279232894",
  "tenant_id": "demo_tenant",
  "timestamp": "2021-04-09T17:50:39Z",
  "version": 2
}

<!--NeedCopy-->
Unmanaged Device Detected
Indicator summary schema
{
  "data_source": "Citrix Endpoint Management",
  "data_source_id": 2,
  "indicator_id": 203,
  "indicator_name": "Unmanaged Device Detected",
  "entity_id": "demo_user",
  "entity_type": "user",
  "event_type": "indicatorSummary",
  "indicator_category": "Compromised endpoints",
  "indicator_category_id": 4,
  "indicator_vector": {
    "name": "Other Risk Indicators",
    "id": 7 },
  "indicator_type": "builtin",
  "indicator_uuid": "e28b8186-496b-44ff-9ddc-ae50e87bd757",
  "occurrence_details": {},
  "risk_probability": 1.0,
  "severity": "low",
  "tenant_id": "demo_tenant",
  "timestamp": "2021-04-13T12:56:30Z",
  "ui_link": "https://analytics.cloud.com/user/",
  "version": 2
}

<!--NeedCopy-->
Indicator event details schema
{
  "indicator_id": 203,
  "client_ip": "127.xx.xx.xxx",
  "data_source_id": 2,
  "entity_id": "demo_user",
  "entity_type": "user",
  "event_type": "indicatorEventDetails",
  "indicator_category_id": 4,
  "indicator_vector": {
    "name": "Other Risk Indicators",
    "id": 7 },
  "indicator_uuid": "dd280122-04f2-42b4-b9fc-92a715c907a0",
  "tenant_id": "demo_tenant",
  "timestamp": "2021-04-09T18:41:30Z",
  "version": 2
}

<!--NeedCopy-->
Citrix Gateway risk indicators schema
EPA scan failure risk indicator schema
Indicator summary schema
{
  "tenant_id": "demo_tenant",
  "indicator_id": 100,
  "indicator_uuid": "3c17454c-86f5-588a-a4ac-0342693d8a70",
  "indicator_category_id": 3,
  "indicator_vector": {
    "name": "Other Risk Indicators",
    "id": 7 },
  "data_source_id": 1,
  "timestamp": "2017-12-21T07:14:59Z",
  "event_type": "indicatorSummary",
  "entity_type": "user",
  "entity_id": "demo_user",
  "version": 2,
  "risk_probability": 1,
  "indicator_category": "Compromised users",
  "indicator_name": "EPA scan failure",
  "severity": "low",
  "data_source": "Citrix Gateway",
  "ui_link": "https://analytics.cloud.com/user/",
  "indicator_type": "builtin",
  "occurrence_details": {
    "event_description": "Post auth failed, no quarantine",
    "observation_start_time": "2017-12-21T07:00:00Z",
    "relevant_event_type": "EPA Scan Failure at Logon"
  }
}

<!--NeedCopy-->
Indicator event details schema
{
  "tenant_id": "demo_tenant",
  "indicator_id": 100,
  "indicator_uuid": "3c17454c-86f5-588a-a4ac-0342693d8a70",
  "indicator_category_id": 3,
  "indicator_vector": {
    "name": "Other Risk Indicators",
    "id": 7 },
  "data_source_id": 1,
  "timestamp": "2017-12-21T07:12:00Z",
  "event_type": "indicatorEventDetails",
  "entity_type": "user",
  "entity_id": "demo_user",
  "version": 2,
  "event_description": "Post auth failed, no quarantine",
  "gateway_domain_name": "10.102.xx.xx",
  "gateway_ip": "56.xx.xxx.xx",
  "policy_name": "postauth_act_1",
  "client_ip": "210.91.xx.xxx",
  "country": "United States",
  "city": "San Jose",
  "region": "California",
  "cs_vserver_name": "demo_vserver",
  "device_os": "Windows OS",
  "security_expression": "CLIENT.OS(Win12) EXISTS",
  "vpn_vserver_name": "demo_vpn_vserver",
  "vserver_fqdn": "10.xxx.xx.xx"
}
<!--NeedCopy-->
The table describes the field names specific to the summary schema and the event details schema for the EPA scan failure risk indicator.
| Field names | Description |
|---|---|
event_description |
Describes the reasons for EPA scan failure such as post authentication failed and no quarantine group. |
relevant_event_type |
Indicates the type of the EPA scan failure event. |
gateway_domain_name |
The domain name of Citrix Gateway. |
gateway_ip |
The IP address of Citrix Gateway. |
policy_name |
The EPA scan policy name configured on the Citrix Gateway. |
country |
The country from which the user activity has been detected. |
city |
The city from which the user activity has been detected. |
region |
The region from which the user activity has been detected. |
cs_vserver_name |
The name of the content switch virtual server. |
device_os |
The operating system of the user’s device. |
security_expression |
The security expression configured on the Citrix Gateway. |
vpn_vserver_name |
The name of the Citrix Gateway virtual server. |
vserver_fqdn |
The FQDN of the Citrix Gateway virtual server. |
Excessive authentication failure risk indicator schema
Indicator summary schema
{
  "tenant_id": "demo_tenant",
  "indicator_id": 101,
  "indicator_uuid": "4bc0f759-93e0-5eea-9967-ed69de9dd09a",
  "indicator_category_id": 3,
  "indicator_vector": {
    "name": "Logon-Failure-Based Risk Indicators",
    "id": 3 },
  "data_source_id": 1,
  "timestamp": "2017-12-21T07:14:59Z",
  "event_type": "indicatorSummary",
  "entity_type": "user",
  "entity_id": "demo_user",
  "version": 2,
  "risk_probability": 1,
  "indicator_category": "Compromised users",
  "indicator_name": "Excessive authentication failures",
  "severity": "medium",
  "data_source": "Citrix Gateway",
  "ui_link": "https://analytics.cloud.com/user/”,
  "indicator_type": "builtin",
  "occurrence_details": {
    "observation_start_time": "2017-12-21T07:00:00Z",
    "relevant_event_type": "Logon Failure"
  }
}
<!--NeedCopy-->
Indicator event details schema
{
  "tenant_id": "demo_tenant",
  "indicator_id": 101,
  "indicator_uuid": "a391cd1a-d298-57c3-a17b-01f159b26b99",
  "indicator_category_id": 3,
  "indicator_vector": {
    "name": "Logon-Failure-Based Risk Indicators",
    "id": 3 },
  "data_source_id": 1,
  "timestamp": "2017-12-21T07:10:00Z",
  "event_type": "indicatorEventDetails",
  "entity_type": "user",
  "entity_id": "demo-user",
  "version": 2,
  "event_description": "Bad (format) password passed to nsaaad",
  "authentication_stage": "Secondary",
  "authentication_type": "LDAP",
  "auth_server_ip": "10.xxx.x.xx",
  "client_ip": "24.xxx.xxx.xx",
  "gateway_ip": "24.xxx.xxx.xx",
  "vserver_fqdn": "demo-fqdn.citrix.com",
  "vpn_vserver_name": "demo_vpn_vserver",
  "cs_vserver_name": "demo_cs_vserver",
  "gateway_domain_name": "xyz",
  "country": "United States",
  "region": "California",
  "city": "San Jose",
  "nth_failure": 5
}

<!--NeedCopy-->
The following table describes the field names specific to the summary schema and the event details schema for Excessive authentication failure.
| Field names | Description |
|---|---|
relevant_event_type |
Indicates the type of event such as logon failure. |
event_description |
Describes the reason for the excessive authentication failure event such as an incorrect password. |
authentication_stage |
Indicates whether the authentication stage is primary, secondary, or tertiary. |
authentication_type |
Indicates the types of authentication such as LDAP, Local, or OAuth. |
auth_server_ip |
The IP address of the authentication server. |
gateway_domain_name |
The domain name of Citrix Gateway. |
gateway_ip |
The IP address of Citrix Gateway. |
cs_vserver_name |
The name of the content switch virtual server. |
vpn_vserver_name |
The name of the Citrix Gateway virtual server. |
vserver_fqdn |
The FQDN of the Citrix Gateway virtual server. |
nth_failure |
The number of times the user authentication has failed. |
country |
The country from which the user activity has been detected. |
city |
The city from which the user activity has been detected. |
region |
The region from which the user activity has been detected. |
Impossible travel risk indicator
Indicator summary schema
{
  "tenant_id": "demo_tenant",
  "indicator_id": "111",
  "indicator_uuid": "83d68a6d-6588-5b77-9118-8a9e6a5b462b",
  "indicator_category_id": 3,
  "indicator_vector": {
    "name": "Location-Based Risk Indicators",
    "id": 2
  },
  "data_source_id": 1,
  "timestamp": "2020-06-06T12:14:59Z",
  "event_type": "indicatorSummary",
  "entity_type": "user",
  "entity_id": "demo_user",
  "version": 2,
  "risk_probability": 1,
  "indicator_category": "Compromised users",
  "indicator_name": "Impossible travel",
  "severity": "medium",
  "data_source": "Citrix Gateway",
  "ui_link": "https://analytics.cloud.com/user/",
  "indicator_type": "builtin",
  "occurrence_details": {
    "relevant_event_type": "Impossible travel",
    "distance": 7480.44718,
    "observation_start_time": "2020-06-06T12:00:00Z",
    "historical_logon_locations": "[{\"country\":\"United States\",\"region\":\"Florida\",\"city\":\"Miami\",\"latitude\":25.7617,\"longitude\":-80.191,\"count\":28},{\"country\":\"United States\",\"latitude\":37.0902,\"longitude\":-95.7129,\"count\":2}]",
    "historical_observation_period_in_days": 30
  }
}

<!--NeedCopy-->
Indicator event details schema
{
  "tenant_id": "demo_tenant",
  "indicator_id": "111",
  "indicator_uuid": "83d68a6d-6588-5b77-9118-8a9e6a5b462b",
  "pair_id": 2,
  "indicator_category_id": 3,
  "indicator_vector": {
    "name": "Location-Based Risk Indicators",
    "id": 2
  },
  "data_source_id": 1,
  "timestamp": "2020-06-06T05:05:00Z",
  "event_type": "indicatorEventDetails",
  "entity_type": "user",
  "entity_id": "demo_user",
  "version": 2,
  "client_ip": "95.xxx.xx.xx",
  “ip_organization”: “global telecom ltd”,
  “ip_routing_type”: “mobile gateway”,
  "country": "Norway",
  "region": "Oslo",
  "city": "Oslo",
  "latitude": 59.9139,
  "longitude": 10.7522,
  "device_os": "Linux OS",
  "device_browser": "Chrome 62.0.3202.94"
}

<!--NeedCopy-->
The following table describes the field names specific to the summary schema and the event details schema for Impossible travel.
| Field name | Description |
|---|---|
distance |
The distance (km) between the events associated with impossible travel. |
historical_logon_locations |
The locations accessed by the user and the number of times each location has been accessed during the observation period. |
historical_observation_period_in_days |
Each location is monitored for 30 days. |
relevant_event_type |
Indicates the type of event such as logon. |
observation_start_time |
The time from which Citrix Analytics starts monitoring the user activity until the time stamp. If any anomalous behavior is detected in this time period, a risk indicator is triggered. |
country |
The country from which the user has logged on. |
city |
The city from which the user has logged on. |
region |
Indicates the region from which the user has logged on. |
latitude |
Indicates the latitude of the location from which the user has logged on. |
longitude |
Indicates the longitude of the location from which the user has logged on. |
device_browser |
The web browser used by the user. |
device_os |
The operating system of the user’s device. |
ip_organization |
Registering organization of the client IP address |
ip_routing_type |
Client IP routing type |
Logon from suspicious IP risk indicator schema
Indicator summary schema
{
  "tenant_id": "demo_tenant",
  "indicator_id": 102,
  "indicator_uuid": "0100e910-561a-5ff3-b2a8-fc556d199ba5",
  "indicator_category_id": 3,
  "indicator_vector": {
    "name": "IP-Based Risk Indicators",
    "id": 4 },
  "data_source_id": 1,
  "timestamp": "2019-10-10T10:14:59Z",
  "event_type": "indicatorSummary",
  "entity_type": "user",
  "entity_id": "demo_user",
  "version": 2,
  "risk_probability": 0.91,
  "indicator_category": "Compromised users",
  "indicator_name": "Logon from suspicious IP",
  "severity": "medium",
  "data_source": "Citrix Gateway",
  "ui_link": "https://analytics.cloud.com/user/",
  "indicator_type": "builtin",
  "occurrence_details": {
    "relevant_event_type": "Logon",
    "client_ip": "1.0.xxx.xx",
    "observation_start_time": "2019-10-10T10:00:00Z",
    "suspicion_reasons": "brute_force|external_threat"
  }
}
<!--NeedCopy-->
Indicator event details schema
{
  "tenant_id": "demo_tenant",
  "indicator_id": 102,
  "indicator_uuid": "4ba77b6c-bac0-5ad0-9b4a-c459a3e2ec33",
  "indicator_category_id": 3,
  "indicator_vector": {
    "name": "IP-Based Risk Indicators",
    "id": 4 },
  "data_source_id": 1,
  "timestamp": "2019-10-10T10:11:00Z",
  "event_type": "indicatorEventDetails",
  "entity_type": "user",
  "entity_id": "demo_user",
  "version": 2,
  "suspicion_reasons": "external_threat",
  "gateway_ip": "gIP1",
  "client_ip": "128.0.xxx.xxx",
  "country": "Sweden",
  "city": "Stockholm",
  "region": "Stockholm",
  "webroot_reputation": 14,
  "webroot_threat_categories": "Windows Exploits|Botnets|Proxy",
  "device_os": "Windows OS",
  "device_browser": "Chrome"
}

<!--NeedCopy-->
The following table describes the field names specific to the summary schema and the event details schema for Login from a suspicious IP.
| Field name | Description |
|---|---|
suspicious_reasons |
The reason for the IP address to be identified as suspicious. |
webroot_reputation |
The IP reputation index provided by the threat intelligence provider- Webroot. |
webroot_threat_categories |
The threat category identified for the suspicious IP by the threat intelligence provider- Webroot. |
device_os |
The operating system of the user device. |
device_browser |
The web browser used. |
country |
The country from which the user activity has been detected. |
city |
The city from which the user activity has been detected. |
region |
The region from which the user activity has been detected. |
Unusual authentication failure risk indicator schema
Indicator summary schema
{
  "tenant_id": "demo_tenant",
  "indicator_id": 109,
  "indicator_uuid": "dc0174c9-247a-5e48-a2ab-d5f92cd83d0f",
  "indicator_category_id": 3,
  "indicator_vector": {
    "name": "Logon-Failure-Based Risk Indicators",
    "id": 3 },
  "data_source_id": 1,
  "timestamp": "2020-04-01T06:44:59Z",
  "event_type": "indicatorSummary",
  "entity_type": "user",
  "entity_id": "demo_user",
  "version": 2,
  "risk_probability": 1,
  "indicator_category": "Compromised users",
  "indicator_name": "Unusual authentication failure",
  "severity": "medium",
  "data_source": "Citrix Gateway",
  "ui_link": "https://analytics.cloud.com/user/",
  "indicator_type": "builtin",
  "occurrence_details": {
    "relevant_event_type": "Logon Failure",
    "observation_start_time": "2020-04-01T05:45:00Z"
  }
}

<!--NeedCopy-->
Indicator event details schema
{
  "tenant_id": "demo_tenant",
  "indicator_id": 109,
  "indicator_uuid": "ef4b9830-39d6-5b41-bdf3-84873a77ea9a",
  "indicator_category_id": 3,
  "indicator_vector": {
    "name": "Logon-Failure-Based Risk Indicators",
    "id": 3 },
  "data_source_id": 1,
  "timestamp": "2020-04-01T06:42:00Z",
  "event_type": "indicatorEventDetails",
  "entity_type": "user",
  "entity_id": "demo_user",
  "version": 2,
  "event_description": "Success",
  "authentication_stage": "Secondary",
  "authentication_type": "LDAP",
  "client_ip": "99.xxx.xx.xx",
  "country": "United States",
  "city": "San Jose",
  "region": "California",
  "device_os": "Windows OS ",
  "device_browser": "Chrome",
  "is_risky": "false"
}

<!--NeedCopy-->
The following table describes the field names specific to the summary schema and the event details schema for Unusual authentication failure.
| Field names | Description |
|---|---|
relevant_event_type |
Indicates the type of event such as logon failure. |
event_description |
Indicates whether the logon is successful or unsuccessful |
authentication_stage |
Indicates whether the authentication stage is primary, secondary, or tertiary. |
authentication_type |
Indicates the types of authentication such as LDAP, Local, or OAuth. |
is_risky |
For a successful logon, the is_risky value is false. For an unsuccessful logon, the is_risky value is true. |
device_os |
The operating system of the user device. |
device_browser |
The web browser used by the user. |
country |
The country from which the user activity has been detected. |
city |
The city from which the user activity has been detected. |
region |
The region from which the user activity has been detected. |
Suspicious logon risk indicator
Indicator summary schema
{
  "tenant_id": "demo_tenant",
  "indicator_id": "110",
  "indicator_uuid": "67fd935-a6a3-5397-b596-636aa1588c",
  "indicator_category_id": 3,
  "indicator_vector": [
    {
      "name": "Location-Based Risk Indicators",
      "id": 2
    },
    {
      "name": "IP-Based Risk Indicators",
      "id": 4
    },
    {
      "name": "Other Risk Indicators",
      "id": 7
    }
  ],
  "data_source_id": 1,
  "timestamp": "2020-06-06T12:14:59Z",
  "event_type": "indicatorSummary",
  "entity_type": "user",
  "entity_id": "demo_user",
  "version": 2,
  "risk_probability": 0.71,
  "indicator_category": "Compromised users",
  "indicator_name": "Suspicious logon",
  "severity": "medium",
  "data_source": "Citrix Gateway",
  "ui_link": "https://analytics.cloud.com/user/",
  "indicator_type": "builtin",
  "occurrence_details": {
    "observation_start_time": "2020-06-06T12:00:00Z",
    "relevant_event_type": "Logon",
    "event_count": 1,
    "historical_observation_period_in_days": 30,
    "country": "United States",
    "region": "Florida",
    "city": "Miami",
    "historical_logon_locations": "[{\"country\":\"United States\",\"region\":\"New York\",\"city\":\"New York City\",\"latitude\":40.7128,\"longitude\":-74.0060,\"count\":9}]",
    "user_location_risk": 75,
    "device_id": "",
    "device_os": "Windows OS",
    "device_browser": "Chrome",
    "user_device_risk": 0,
    "client_ip": "99.xxx.xx.xx",
    "user_network_risk": 75,
    "webroot_threat_categories": "Phishing",
    "suspicious_network_risk": 89
  }
}


<!--NeedCopy-->
Indicator event details schema
{
  "tenant_id": "demo_tenant",
  "indicator_id": "110",
  "indicator_uuid": "67fd6935-a6a3-5397-b596-63856aa1588c",
  "indicator_category_id": 3,
  "indicator_vector": [
    {
      "name": "Location-Based Risk Indicators",
      "id": 2
    },
    {
      "name": "IP-Based Risk Indicators",
      "id": 4
    },
    {
      "name": "Other Risk Indicators",
      "id": 7
    }
  ],
  "data_source_id": 1,
  "timestamp": "2020-06-06T12:08:40Z",
  "event_type": "indicatorEventDetails",
  "entity_type": "user",
  "entity_id": "demo_user",
  "version": 2,
  "country": "United States",
  "region": "Florida",
  "city": "Miami",
  "latitude": 25.7617,
  "longitude": -80.1918,
  "device_browser": "Chrome",
  "device_os": "Windows OS",
  "device_id": "NA",
  "client_ip": "99.xxx.xx.xx"
}

<!--NeedCopy-->
The following table describes the field names specific to the summary schema and the event details schema for Suspicious logon.
| Field name | Description |
|---|---|
historical_logon_locations |
The locations accessed by the user and the number of times each location has been accessed during the observation period. |
historical_observation_period_in_days |
Each location is monitored for 30 days. |
relevant_event_type |
Indicates the type of event such as logon. |
observation_start_time |
The time from which Citrix Analytics starts monitoring the user activity until the time stamp. If any anomalous behavior is detected in this time period, a risk indicator is triggered. |
occurrence_event_type |
Indicates the user event type such as account logon. |
country |
The country from which the user has logged on. |
city |
The city from which the user has logged on. |
region |
Indicates the region from which the user has logged on. |
latitude |
Indicates the latitude of the location from which the user has logged on. |
longitude |
Indicates the longitude of the location from which the user has logged on. |
device_browser |
The web browser used by the user. |
device_os |
The operating system of the user’s device. |
device_id |
The name of the device used by the user. |
user_location_risk |
Indicates the suspicion level of the location from which the user has logged on. Low suspicion level: 0–69, Medium suspicion level: 70–89, and High suspicion level: 90–100 |
user_device_risk |
Indicates the suspicion level of the device from which the user has logged on. Low suspicion level: 0–69, Medium suspicion level: 70–89, and High suspicion level: 90–100 |
user_network_risk |
Indicates the suspicion level of the network or the subnet from which the user has logged on. Low suspicion level: 0–69, Medium suspicion level: 70–89, and High suspicion level: 90–100 |
suspicious_network_risk |
Indicates the IP threat level based on the Webroot IP threat intelligence feed. Low threat level: 0–69, Medium threat level: 70–89, and High threat level: 90–100 |
webroot_threat_categories |
Indicates the types of threat detected from the IP address based on the Webroot IP threat intelligence feed. The threat categories can be Spam Sources, Windows Exploits, Web Attacks, Botnets, Scanners, Denial of Service, Reputation, Phishing, Proxy, Unspecified, Mobile Threats, and Tor Proxy |
Citrix DaaS and Citrix Virtual Apps and Desktops risk indicators schema
Impossible travel risk indicator
Indicator summary schema
{
  "tenant_id": "demo_tenant",
  "indicator_id": "313",
  "indicator_uuid": "c78d1dd4-5e70-5642-ba6f-1cdf31bc6ab2",
  "indicator_category_id": 3,
  "indicator_vector": {
    "name": "Location-Based Risk Indicators",
    "id": 2
  },
  "data_source_id": 3,
  "timestamp": "2020-06-06T12:14:59Z",
  "event_type": "indicatorSummary",
  "entity_type": "user",
  "entity_id": "demo_user",
  "version": 2,
  "risk_probability": 1,
  "indicator_category": "Compromised users",
  "indicator_name": "Impossible travel",
  "severity": "medium",
  "data_source": "Apps and Desktops",
  "ui_link": "https://analytics.cloud.com/user/",
  "indicator_type": "builtin",
  "occurrence_details": {
    "relevant_event_type": "Impossible travel",
    "distance": 7480.44718,
    "observation_start_time": "2020-06-06T12:00:00Z",
    "historical_logon_locations": "[{\"country\":\"United States\",\"region\":\"Florida\",\"city\":\"Miami\",\"latitude\":25.7617,\"longitude\":-80.191,\"count\":28},{\"country\":\"United States\",\"latitude\":37.0902,\"longitude\":-95.7129,\"count\":2}]",
    "historical_observation_period_in_days": 30
  }
}

<!--NeedCopy-->
Indicator event details schema
{
  "tenant_id": "demo_tenant",
  "indicator_id": "313",
  "indicator_uuid": "c78d1dd4-5e70-5642-ba6f-1cdf31bc6ab2",
  "pair_id": 2,
  "indicator_category_id": 3,
  "indicator_vector": {
    "name": "Location-Based Risk Indicators",
    "id": 2
  },
  "data_source_id": 3,
  "timestamp": "2020-06-06T05:05:00Z",
  "event_type": "indicatorEventDetails",
  "entity_type": "user",
  "entity_id": "demo_user",
  "version": 2,
  "occurrence_event_type": "Account.Logon",
  "client_ip": "95.xxx.xx.xx",
  “ip_organization”: “global telecom ltd”,
  “ip_routing_type”: “mobile gateway”,
  "country": "Norway",
  "region": "Oslo",
  "city": "Oslo",
  "latitude": 59.9139,
  "longitude": 10.7522,
  "device_id": "device1",
  "receiver_type": "XA.Receiver.Linux",
  "os": "Linux OS",
  "browser": "Chrome 62.0.3202.94"
}

<!--NeedCopy-->
The following table describes the field names specific to the summary schema and the event details schema for Impossible travel.
| Field name | Description |
|---|---|
distance |
The distance (km) between the events associated with impossible travel. |
historical_logon_locations |
The locations accessed by the user and the number of times each location has been accessed during the observation period. |
historical_observation_period_in_days |
Each location is monitored for 30 days. |
relevant_event_type |
Indicates the type of event such as logon. |
observation_start_time |
The time from which Citrix Analytics starts monitoring the user activity until the time stamp. If any anomalous behavior is detected in this time period, a risk indicator is triggered. |
country |
The country from which the user has logged on. |
city |
The city from which the user has logged on. |
region |
Indicates the region from which the user has logged on. |
latitude |
Indicates the latitude of the location from which the user has logged on. |
longitude |
Indicates the longitude of the location from which the user has logged on. |
browser |
The web browser used by the user. |
os |
The operating system of the user’s device. |
device_id |
The name of the device used by the user. |
receiver_type |
The type of the Citrix Workspace™ app or Citrix Receiver™ installed on the user’s device. |
ip_organization |
Registering organization of the client IP address |
ip_routing_type |
Client IP routing type |
Potential data exfiltration risk indicator
Indicator summary schema
{
  "tenant_id": "demo_tenant",
  "indicator_id": 303,
  "indicator_uuid": "fb649ff7-5b09-5f48-8a04-12836b9eed85",
  "indicator_category_id": 1,
  "indicator_vector": {
    "name": "Data-Based Risk Indicators",
    "id": 5 },
  "data_source_id": 3,
  "timestamp": "2018-04-02T10:59:59Z",
  "event_type": "indicatorSummary",
  "entity_type": "user",
  "entity_id": "demo_user",
  "version": 2,
  "risk_probability": 1,
  "indicator_category": "Data exfiltration",
  "indicator_name": "Potential data exfiltration",
  "severity": "low",
  "data_source": "Citrix Apps and Desktops",
  "ui_link": "https://analytics.cloud.com/user/ ",
  "indicator_type": "builtin",
  "occurrence_details": {
    "relevant_event_type": "Download/Print/Copy",
    "observation_start_time": "2018-04-02T10:00:00Z",
    "exfil_data_volume_in_bytes": 1172000
  }
}

<!--NeedCopy-->
Indicator event details schema
{
  "tenant_id": "demo_tenant",
  "indicator_id": 303,
  "indicator_uuid": "fb649ff7-5b09-5f48-8a04-12836b9eed85",
  "indicator_category_id": 1,
  "indicator_vector": {
    "name": "Data-Based Risk Indicators",
    "id": 5 },
  "data_source_id": 3,
  "timestamp": "2018-04-02T10:57:36Z",
  "event_type": "indicatorEventDetails",
  "entity_type": "user",
  "entity_id": "demo_user",
  "version": 2,
  "occurrence_event_type": "App.SaaS.Clipboard",
  "file_size_in_bytes": 98000,
  "file_type": "text",
  "device_id": "dvc5",
  "receiver_type": "XA.Receiver.Windows",
  "app_url": "https://www.citrix.com",
  "client_ip": "10.xxx.xx.xxx",
  "entity_time_zone": "Pacific Standard Time"
}

<!--NeedCopy-->
The following table describes the fields specific to the summary schema and the event details schema for Potential data exfiltration.
| Field name | Description |
|---|---|
observation_start_time |
The time from which Citrix Analytics starts monitoring the user activity until the time stamp. If any anomalous behavior is detected in this time period, a risk indicator is triggered. |
relevant_event_type |
Indicates the user activity such as download, print, or copy the data. |
exfil_data_volume_in_bytes |
The amount of data exfiltration. |
occurrence_event_type |
Indicates how the data exfiltration has happened such as the clipboard operation in a SaaS app. |
file_size_in_bytes |
The size of the file. |
file_type |
The type of the file. |
device_id |
The ID of the user device. |
receiver_type |
The Citrix Workspace app or Citrix Receiver installed on the user device. |
app_url |
The URL of the application that is accessed by the user. |
entity_time_zone |
The time zone of the user. |
Suspicious logon risk indicator schema
Indicator summary schema
{
  "tenant_id": "tenant_1",
  "indicator_id": "312",
  "indicator_uuid": "1b97c3be-abcd-efgh-ijkl-1234567890",
  "indicator_category_id": 3,
  "indicator_vector":
  [
    {
      "name": "Other Risk Indicators",
      "id": 7
    },
    {
      "name":"Location-Based Risk Indicators",
      "id":2
    },
    {
      "name":"IP-Based Risk Indicators",
      "id":4
    },
    {
      "name": "Device-Based Risk Indicators",
      "id": 1
    },
  ],
  "data_source_id": 3,
  "timestamp": "2020-06-06T12:14:59Z",
  "event_type": "indicatorSummary",
  "entity_type": "user",
  "entity_id": "user2",
  "version": 2,
  "risk_probability": 0.78,
  "indicator_category": "Compromised users",
  "indicator_name": "Suspicious logon",
  "severity": "medium",
  "data_source": "Citrix Apps and Desktops",
  "ui_link": "https://analytics.cloud.com/user/ ",
  "indicator_type": "builtin",
  "occurrence_details":
  {
    "user_location_risk": 0,
    "city": "Some_city",
    "observation_start_time": "2020-06-06T12:00:00Z",
    "event_count": 1,
    "user_device_risk": 75,
    "country": "United States",
    "device_id": "device2",
    "region": "Some_Region",
    "client_ip": "99.xx.xx.xx",
    "webroot_threat_categories": "'Spam Sources', 'Windows Exploits', 'Web Attacks', 'Botnets', 'Scanners', 'Denial of Service'",
    "historical_logon_locations": "[{\"country\":\"United States\",\"latitude\":45.0,\"longitude\":45.0,\"count\":12},{\"country\":\"United States\",\"region\":\"Some_Region_A\",\"city\":\"Some_City_A\",\"latitude\":0.0,\"longitude\":0.0,\"count\":8}]",
    "relevant_event_type": "Logon",
    "user_network_risk": 100,
    "historical_observation_period_in_days": 30,
    "suspicious_network_risk": 0
  }
}

<!--NeedCopy-->
Indicator event details schema
{
  "tenant_id": "tenant_1",
  "indicator_id": "312",
  "indicator_uuid": "1b97c3be-abcd-efgh-ijkl-1234567890",
  "indicator_category_id": 3,
  "indicator_vector":
  [
    {
      "name": "Other Risk Indicators",
      "id": 7
    },
    {
      "name":"Location-Based Risk Indicators",
      "id":2
    },
    {
      "name":"IP-Based Risk Indicators",
      "id":4
    },
    {
      "name": "Device-Based Risk Indicators",
      "id": 1
    },
  ],
  "data_source_id": 3,
  "timestamp": "2020-06-06 12:02:30",
  "event_type": "indicatorEventDetails",
  "entity_type": "user",
  "entity_id": "user2",
  "version": 2,
  "occurrence_event_type": "Account.Logon",
  "city": "Some_city",
  "country": "United States",
  "region": "Some_Region",
  "latitude": 37.751,
  "longitude": -97.822,
  "browser": "Firefox 1.3",
  "os": "Windows OS",
  "device_id": "device2",
  "receiver_type": "XA.Receiver.Chrome",
  "client_ip": "99.xxx.xx.xx"
}

<!--NeedCopy-->
The following table describes the field names specific to the summary schema and the event details schema for Suspicious logon.
| Field name | Description |
|---|---|
historical_logon_locations |
The locations accessed by the user and the number of times each location has been accessed during the observation period. |
historical_observation_period_in_days |
Each location is monitored for 30 days. |
relevant_event_type |
Indicates the type of event such as logon. |
observation_start_time |
The time from which Citrix Analytics starts monitoring the user activity until the time stamp. If any anomalous behavior is detected in this time period, a risk indicator is triggered. |
occurrence_event_type |
Indicates the user event type such as account logon. |
country |
The country from which the user has logged on. |
city |
The city from which the user has logged on. |
region |
Indicates the region from which the user has logged on. |
latitude |
Indicates the latitude of the location from which the user has logged on. |
longitude |
Indicates the longitude of the location from which the user has logged on. |
browser |
The web browser used by the user. |
os |
The operating system of the user’s device. |
device_id |
The name of the device used by the user. |
receiver_type |
The type of the Citrix Workspace app or Citrix Receiver installed on the user’s device. |
user_location_risk |
Indicates the suspicion level of the location from which the user has logged on. Low suspicion level: 0–69, Medium suspicion level: 70–89, and High suspicion level: 90–100 |
user_device_risk |
Indicates the suspicion level of the device from which the user has logged on. Low suspicion level: 0–69, Medium suspicion level: 70–89, and High suspicion level: 90–100 |
user_network_risk |
Indicates the suspicion level of the network or the subnet from which the user has logged on. Low suspicion level: 0–69, Medium suspicion level: 70–89, and High suspicion level: 90–100 |
suspicious_network_risk |
Indicates the IP threat level based on the Webroot IP threat intelligence feed. Low threat level: 0–69, Medium threat level: 70–89, and High threat level: 90–100 |
webroot_threat_categories |
Indicates the types of threat detected from the IP address based on the Webroot IP threat intelligence feed. The threat categories can be Spam Sources, Windows Exploits, Web Attacks, Botnets, Scanners, Denial of Service, Reputation, Phishing, Proxy, Unspecified, Mobile Threats, and Tor Proxy |
Microsoft Active Directory Indicator
Indicator summary schema
{
  "data_source": "Microsoft Graph Security",
  "entity_id": "demo_user",
  "entity_type": "user",
  "event_type": "indicatorSummary",
  "indicator_category": "Compromised users",
  "indicator_id": 1000,
  "indicator_name": "MS Active Directory Indicator",
  "indicator_vector": {
    "name": "IP-Based Risk Indicators",
    "id": 4 },
  "indicator_type": "builtin",
  "indicator_uuid": "9880f479-9fbe-4ab0-8348-a613f9de5eba",
  "occurrence_details": {},
  "risk_probability": 1.0,
  "severity": "low",
  "tenant_id": "demo_tenant",
  "timestamp": "2021-01-27T16:03:46Z",
  "ui_link": "https://analytics-daily.cloud.com/user/",
  "version": 2
}

<!--NeedCopy-->
Indicator event details schema
{
  "entity_id": "demo_user",
  "entity_type": "user",
  "event_type": "indicatorEventDetails",
  "indicator_id": 1000,
  "indicator_vector": {
    "name": "IP-Based Risk Indicators",
    "id": 4 },
  "indicator_uuid": "9880f479-9fbe-4ab0-8348-a613f9de5eba",
  "tenant_id": "demo_tenant",
  "timestamp": "2021-01-27T16:03:46Z",
  "version": 2
}

<!--NeedCopy-->
Custom risk indicator schema
The following section describes the schema for the custom risk indicator.
Note
Currently, Citrix Analytics sends the data related to the custom risk indicators of Citrix DaaS and Citrix Virtual Apps and Desktops to your SIEM service.
The following table describes the field names for the custom risk indicator summary schema.
| Field name | Description |
|---|---|
data source |
The products that send data to Citrix Analytics for Security. For example: Citrix Secure Private Access, Citrix Gateway, and Citrix Apps and Desktops. |
data_source_id |
The ID associated with a data source. ID 1 = Citrix Gateway, ID 2 = Citrix Endpoint Management, ID 3 = Citrix Apps and Desktops, ID 4 = Citrix Secure Private Access |
entity_id |
The ID associated with the entity at risk. |
entity_type |
The entity at risk. In this case, the entity is a user. |
event_type |
The type of data sent to the SIEM service. In this case, the event type is the summary of the risk indicator. |
indicator_category |
Indicates the categories of risk indicators. The risk indicators are grouped into one of the risk categories- compromised endpoint, compromised users, data exfiltration, or insider threats. |
indicator_id |
The unique ID associated with the risk indicator. |
indicator_category_id |
The ID associated with the risk indicator category. ID 1 = Data exfiltration, ID 2 = Insider threats, ID 3 = Compromised users, ID 4 = Compromised endpoints |
indicator_name |
The name of the risk indicator. For a custom risk indicator, this name is defined while creating the indicator. |
indicator_type |
Indicates whether the risk indicator is default (built-in) or custom. |
indicator_uuid |
The unique ID associated with the risk indicator instance. |
occurrence_details |
The details about the risk indicator triggering condition. |
pre_configured |
Indicates whether the custom risk indicator is preconfigured. |
risk_probability |
Indicates the chances of risk associated with the user event. The value varies from 0 to 1.0. For a custom risk indicator, the risk_probability is always 1.0 because it is a policy-based indicator. |
severity |
Indicates the severity of the risk. It can be low, medium, or high. |
tenant_id |
The unique identity of the customer. |
timestamp |
The date and the time when the risk indicator is triggered. |
ui_link |
The link to the user timeline view on the Citrix Analytics user interface. |
version |
The schema version of the processed data. The current schema version is 2. |
The following table describes the field names common across the custom risk indicator event details schema.
| Field name | Description |
|---|---|
data_source_id |
The ID associated with a data source. ID 1 = Citrix Gateway, ID 2 = Citrix Endpoint Management, ID 3 = Citrix Apps and Desktops, ID 4 = Citrix Secure Private Access |
indicator_category_id |
The ID associated with the risk indicator category. ID 1 = Data exfiltration, ID 2 = Insider threats, ID 3 = Compromised users, ID 4 = Compromised endpoints |
event_type |
The type of data sent to the SIEM service. In this case, the event type is the details of the risk indicator event. |
tenant_id |
The unique identity of the customer. |
entity_id |
The ID associated with the entity at risk. |
entity_type |
The entity that is at risk. In this case, it is the user. |
indicator_id |
The unique ID associated with the risk indicator. |
indicator_uuid |
The unique ID associated with the risk indicator instance. |
timestamp |
The date and the time when the risk indicator is triggered. |
version |
The schema version of the processed data. The current schema version is 2. |
event_id |
The ID associated with the user event. |
occurrence_event_type |
Indicates the type of user event such as session logon, session launch, and account logon. |
product |
Indicates the type of Citrix Workspace app such as Citrix Workspace app for Windows. |
client_ip |
The IP address of the user’s device. |
session_user_name |
The user name associated with the Citrix Apps and Desktops session. |
city |
The name of the city from which the user activity is detected. |
country |
The name of the country from which the user activity is detected. |
device_id |
The name of the device used by the user. |
os_name |
The operating system that is installed on the user’s device. For more information, see Self-service search for Apps and Desktops. |
os_version |
The version of the operating system that is installed on the user’s device. For more information, see Self-service search for Apps and Desktops. |
os_extra_info |
The extra details associated with the operating system that is installed on the user’s device. For more information, see Self-service search for Apps and Desktops. |
Custom risk indicator for Citrix DaaS and Citrix Virtual Apps and Desktops
Indicator summary schema
{
  "data_source": " Citrix Apps and Desktops",
  "data_source_id": 3,
  "entity_id": "demo_user",
  "entity_type": "user",
  "event_type": "indicatorSummary",
  "indicator_category": "Compromised users",
  "indicator_category_id": 3,
  "indicator_id": "ca97a656ab0442b78f3514052d595936",
  "indicator_name": "Demo_user_usage",
  "indicator_type": "custom",
  "indicator_uuid": "8e680e29-d742-4e09-9a40-78d1d9730ea5",
  "occurrence_details": {
    "condition": "User-Name ~ demo_user", "happen": 0, "new_entities": "", "repeat": 0, "time_quantity": 0, "time_unit": "", "type": "everyTime"},
  "pre_configured": "N",
  "risk_probability": 1.0,
  "severity": "low",
  "tenant_id": "demo_tenant",
  "timestamp": "2021-02-10T14:47:25Z",
  "ui_link": "https://analytics.cloud.com/user/ ",
  "version": 2
}

<!--NeedCopy-->
Indicator event details schema for the session logon event
{
  "event_type": "indicatorEventDetails",
  "data_source_id": 3,
  "indicator_category_id": 3,
  "tenant_id": "demo_tenant",
  "entity_id": "demo_user",
  "entity_type": "user",
  "indicator_id": "9033b2f6a8914a9282937b35ce497bcf",
  "timestamp": "2021-03-19T10:08:05Z",
  "indicator_uuid": "e0abfcb4-fd41-4612-ad59-ef7567508ac0",
  "version": 2,
  "event_id": "8fc3dd5e-d049-448a-ab70-0fc4d554e41e",
  "occurrence_event_type": "Session.Logon",
  "product": "XA.Receiver.Windows",
  "client_ip": "103.xx.xxx.xxx",
  "session_user_name": "user01",
  "city": "Mumbai",
  "country": "India",
  "device_id": "5-Synthetic_device",
  "os_name": "Windows NT 6.1",
  "os_version": "7601",
  "os_extra_info": "Service Pack 1",
  "app_name": "notepad",
  "launch_type": "Application",
  "domain": "test_domain",
  "server_name": "SYD04-MS1-S102",
  "session_guid": "f466e318-9065-440c-84a2-eec49d978a96",
}

<!--NeedCopy-->
The following table describes the field names specific to the event details schema for the session logon event.
| Field name | Description |
|---|---|
app_name |
Name of an application or desktop launched. |
launch_type |
Indicates either application or desktop. |
domain |
The domain name of the server that sent the request. |
server_name |
Name of the server. |
session_guid |
The GUID of the active session. |
Indicator event details schema for the session launch event
{
  "event_type": "indicatorEventDetails",
  "data_source_id": 3,
  "indicator_category_id": 3,
  "tenant_id": "demo_tenant",
  "entity_id": "demo_user",
  "entity_type": "user",
  "indicator_id": "9033b2f6a8914a9282937b35ce497bcf",
  "timestamp": "2021-03-19T10:08:05Z",
  "indicator_uuid": "e0abfcb4-fd41-4612-ad59-ef7567508ac0",
  "version": 2,
  "event_id": "8fc3dd5e-d049-448a-ab70-0fc4d554e41e",
  "occurrence_event_type": "Session.Launch",
  "product": "XA.Receiver.Windows",
  "client_ip": "103.xx.xxx.xxx",
  "session_user_name": "user01",
  "city": "Mumbai",
  "country": "India",
  "device_id": "5-Synthetic_device",
  "os_name": "Windows NT 6.1",
  "os_version": "7601",
  "os_extra_info": "Service Pack 1",
  "app_name": "notepad",
  "launch_type": "Application",
}

<!--NeedCopy-->
The following table describes the field names specific to the event details schema for the session launch event.
| Field name | Description |
|---|---|
app_name |
Name of an application or desktop launched. |
launch_type |
Indicates either application or desktop. |
Indicator event details schema for the account logon event
{
  "event_type": "indicatorEventDetails",
  "data_source_id": 3,
  "indicator_category_id": 3,
  "tenant_id": "demo_tenant",
  "entity_id": "demo_user",
  "entity_type": "user",
  "indicator_id": "9033b2f6a8914a9282937b35ce497bcf",
  "timestamp": "2021-03-19T10:08:05Z",
  "indicator_uuid": "e0abfcb4-fd41-4612-ad59-ef7567508ac0",
  "version": 2,
  "event_id": "8fc3dd5e-d049-448a-ab70-0fc4d554e41e",
  "occurrence_event_type": "Account.Logon",
  "product": "XA.Receiver.Windows",
  "client_ip": "103.xx.xxx.xxx",
  "session_user_name": "user01",
  "city": "Mumbai",
  "country": "India",
  "device_id": "5-Synthetic_device",
  "os_name": "Windows NT 6.1",
  "os_version": "7601",
  "os_extra_info": "Service Pack 1",
  "app_name": "notepad",
}

<!--NeedCopy-->
The following table describes the field names specific to the event details schema for the account logon event.
| Field name | Description |
|---|---|
app_name |
Name of an application or desktop launched. |
Indicator event details schema for the session end event
{
  "event_type": "indicatorEventDetails",
  "data_source_id": 3,
  "indicator_category_id": 3,
  "tenant_id": "demo_tenant",
  "entity_id": "demo_user",
  "entity_type": "user",
  "indicator_id": "9033b2f6a8914a9282937b35ce497bcf",
  "timestamp": "2021-03-19T10:08:05Z",
  "indicator_uuid": "e0abfcb4-fd41-4612-ad59-ef7567508ac0",
  "version": 2,
  "event_id": "8fc3dd5e-d049-448a-ab70-0fc4d554e41e",
  "occurrence_event_type": "Session.End",
  "product": "XA.Receiver.Windows",
  "client_ip": "103.xx.xxx.xxx",
  "session_user_name": "user01",
  "city": "Mumbai",
  "country": "India",
  "device_id": "5-Synthetic_device",
  "os_name": "Windows NT 6.1",
  "os_version": "7601",
  "os_extra_info": "Service Pack 1",
  "app_name": "notepad",
  "launch_type": "Application",
  "domain": "test_domain",
  "server_name": "test_server",
  "session_guid": "f466e318-9065-440c-84a2-eec49d978a96",
}

<!--NeedCopy-->
The following table describes the field names specific to the event details schema for the session end event.
| Field name | Description |
|---|---|
app_name |
Name of an application or desktop launched. |
launch_type |
Indicates either application or desktop. |
domain |
The domain name of the server that sent the request. |
server_name |
Name of the server. |
session_guid |
The GUID of the active session. |
Indicator event details schema for the app start event
{
  "event_type": "indicatorEventDetails",
  "data_source_id": 3,
  "indicator_category_id": 3,
  "tenant_id": "demo_tenant",
  "entity_id": "demo_user",
  "entity_type": "user",
  "indicator_id": "9033b2f6a8914a9282937b35ce497bcf",
  "timestamp": "2021-03-19T10:08:05Z",
  "indicator_uuid": "e0abfcb4-fd41-4612-ad59-ef7567508ac0",
  "version": 2,
  "event_id": "8fc3dd5e-d049-448a-ab70-0fc4d554e41e",
  "occurrence_event_type": "App.Start",
  "product": "XA.Receiver.Windows",
  "client_ip": "103.xx.xxx.xxx",
  "session_user_name": "user01",
  "city": "Mumbai",
  "country": "India",
  "device_id": "5-Synthetic_device",
  "os_name": "Windows NT 6.1",
  "os_version": "7601",
  "os_extra_info": "Service Pack 1",
  "app_name": "notepad",
  "launch_type": "Application",
  "domain": "test_domain",
  "server_name": "test_server",
  "session_guid": "f466e318-9065-440c-84a2-eec49d978a96",
  "module_file_path": "/root/folder1/folder2/folder3"
}

<!--NeedCopy-->
The following table describes the field names specific to the event details schema for the app start event.
| Field name | Description |
|---|---|
app_name |
Name of an application or desktop launched. |
launch_type |
Indicates either application or desktop. |
domain |
The domain name of the server that sent the request. |
server_name |
Name of the server. |
session_guid |
The GUID of the active session. |
module_file_path |
The path of the application that is being used. |
Indicator event details schema for the app end event
{
  "event_type": "indicatorEventDetails",
  "data_source_id": 3,
  "indicator_category_id": 3,
  "tenant_id": "demo_tenant",
  "entity_id": "demo_user",
  "entity_type": "user",
  "indicator_id": "9033b2f6a8914a9282937b35ce497bcf",
  "timestamp": "2021-03-19T10:08:05Z",
  "indicator_uuid": "e0abfcb4-fd41-4612-ad59-ef7567508ac0",
  "version": 2,
  "event_id": "8fc3dd5e-d049-448a-ab70-0fc4d554e41e",
  "occurrence_event_type": "App.End",
  "product": "XA.Receiver.Windows",
  "client_ip": "103.xx.xxx.xxx",
  "session_user_name": "user01",
  "city": "Mumbai",
  "country": "India",
  "device_id": "5-Synthetic_device",
  "os_name": "Windows NT 6.1",
  "os_version": "7601",
  "os_extra_info": "Service Pack 1",
  "app_name": "notepad",
  "launch_type": "Application",
  "domain": "test_domain",
  "server_name": "test_server",
  "session_guid": "f466e318-9065-440c-84a2-eec49d978a96",
  "module_file_path": "/root/folder1/folder2/folder3"
}

<!--NeedCopy-->
The following table describes the field names specific to the event details schema for the app end event.
| Field name | Description |
|---|---|
app_name |
Name of an application or desktop launched. |
launch_type |
Indicates either application or desktop. |
domain |
The domain name of the server that sent the request. |
server_name |
Name of the server. |
session_guid |
The GUID of the active session. |
module_file_path |
The path of the application that is being used. |
Indicator event details schema for the file download event
{
  "event_type": "indicatorEventDetails",
  "data_source_id": 3,
  "indicator_category_id": 3,
  "tenant_id": "demo_tenant",
  "entity_id": "demo_user",
  "entity_type": "user",
  "indicator_id": "9033b2f6a8914a9282937b35ce497bcf",
  "timestamp": "2021-03-19T10:08:05Z",
  "indicator_uuid": "e0abfcb4-fd41-4612-ad59-ef7567508ac0",
  "version": 2,
  "event_id": "8fc3dd5e-d049-448a-ab70-0fc4d554e41e",
  "occurrence_event_type": "File.Download",
  "product": "XA.Receiver.Windows",
  "client_ip": "103.xx.xxx.xxx",
  "session_user_name": "user01",
  "city": "Mumbai",
  "country": "India",
  "device_id": "5-Synthetic_device",
  "os_name": "Windows NT 6.1",
  "os_version": "7601",
  "os_extra_info": "Service Pack 1",
  "file_download_file_name": "File5.txt",
  "file_download_file_path": "/root/folder1/folder2/folder3",
  "file_size_in_bytes": 278,
  "launch_type": "Desktop",
  "domain": "test_domain",
  "server_name": "test_server",
  "session_guid": "f466e318-9065-440c-84a2-eec49d978a96",
  "device_type": "USB"
}

<!--NeedCopy-->
The following table describes the field names specific to the event details schema for the file download event.
| Field name | Description |
|---|---|
file_download_file_name |
Name of the download file. |
file_download_file_path |
The destination path where the file is downloaded. |
launch_type |
Indicates either application or desktop. |
domain |
The domain name of the server that sent the request. |
server_name |
Name of the server. |
session_guid |
The GUID of the active session. |
device_type |
Indicates the type of the device where the file is downloaded. |
Indicator event details schema for the printing event
{
  "event_type": "indicatorEventDetails",
  "data_source_id": 3,
  "indicator_category_id": 3,
  "tenant_id": "demo_tenant",
  "entity_id": "demo_user",
  "entity_type": "user",
  "indicator_id": "9033b2f6a8914a9282937b35ce497bcf",
  "timestamp": "2021-03-19T10:08:05Z",
  "indicator_uuid": "e0abfcb4-fd41-4612-ad59-ef7567508ac0",
  "version": 2,
  "event_id": "8fc3dd5e-d049-448a-ab70-0fc4d554e41e",
  "occurrence_event_type": "Printing",
  "product": "XA.Receiver.Windows",
  "client_ip": "103.xx.xxx.xxx",
  "session_user_name": "user01",
  "city": "Mumbai",
  "country": "India",
  "device_id": "5-Synthetic_device",
  "os_name": "Windows NT 6.1",
  "os_version": "7601",
  "os_extra_info": "Service Pack 1",
  "printer_name": "Test-printer",
  "launch_type": "Desktop",
  "domain": "test_domain",
  "server_name": "test_server",
  "session_guid": "f466e318-9065-440c-84a2-eec49d978a96",
  "job_details_size_in_bytes": 454,
  "job_details_filename": "file1.pdf",
  "job_details_format": "PDF"
}

<!--NeedCopy-->
The following table describes the field names specific to the event details schema for the printing event.
| Field name | Description |
|---|---|
printer_name |
Name of the printer used for the printing job. |
launch_type |
Indicates either application or desktop. |
domain |
The domain name of the server that sent the request. |
server_name |
Name of the server. |
session_guid |
The GUID of the active session. |
job_details_size_in_bytes |
The size of the printed job such as file or folder. |
job_details_filename |
Name of the printed file. |
job_details_format |
The format of the printed job. |
Indicator event details schema for the app SaaS launch event
{
  "event_type": "indicatorEventDetails",
  "data_source_id": 3,
  "indicator_category_id": 3,
  "tenant_id": "demo_tenant",
  "entity_id": "demo_user",
  "entity_type": "user",
  "indicator_id": "9033b2f6a8914a9282937b35ce497bcf",
  "timestamp": "2021-03-19T10:08:05Z",
  "indicator_uuid": "e0abfcb4-fd41-4612-ad59-ef7567508ac0",
  "version": 2,
  "event_id": "8fc3dd5e-d049-448a-ab70-0fc4d554e41e",
  "occurrence_event_type": "App.SaaS.Launch",
  "product": "XA.Receiver.Windows",
  "client_ip": "103.xx.xxx.xxx",
  "session_user_name": "user01",
  "city": "Mumbai",
  "country": "India",
  "device_id": "5-Synthetic_device",
  "os_name": "Windows NT 6.1",
  "os_version": "7601",
  "os_extra_info": "Service Pack 1",
  "launch_type": "Desktop",
}

<!--NeedCopy-->
The following table describes the field names specific to the event details schema for the app SaaS launch event.
| Field name | Description |
|---|---|
launch_type |
Indicates either application or desktop. |
Indicator event details schema for the app SaaS end event
{
  "event_type": "indicatorEventDetails",
  "data_source_id": 3,
  "indicator_category_id": 3,
  "tenant_id": "demo_tenant",
  "entity_id": "demo_user",
  "entity_type": "user",
  "indicator_id": "9033b2f6a8914a9282937b35ce497bcf",
  "timestamp": "2021-03-19T10:08:05Z",
  "indicator_uuid": "e0abfcb4-fd41-4612-ad59-ef7567508ac0",
  "version": 2,
  "event_id": "8fc3dd5e-d049-448a-ab70-0fc4d554e41e",
  "occurrence_event_type": "App.SaaS.End",
  "product": "XA.Receiver.Windows",
  "client_ip": "103.xx.xxx.xxx",
  "session_user_name": "user01",
  "city": "Mumbai",
  "country": "India",
  "device_id": "5-Synthetic_device",
  "os_name": "Windows NT 6.1",
  "os_version": "7601",
  "os_extra_info": "Service Pack 1",
  "launch_type": "Desktop",
}

<!--NeedCopy-->
The following table describes the field names specific to the event details schema for the app SaaS end event.
| Field name | Description |
|---|---|
launch_type |
Indicates either application or desktop. |
Data source events
Additionally, you can configure the Data exports feature to export user events from your Citrix Analytics for Security enabled product data sources. When you perform any activity in the Citrix environment, the data source events are generated. The exported events are unprocessed real-time user and product usage data as available in the self-service view. The metadata contained in these events can further be used for deeper threat analysis, creating new dashboards, and co-related with other non-Citrix data source events across your security and IT infra.
Currently, Citrix Analytics for Security sends user events to your SIEM for the Citrix Virtual Apps and Desktops data source.
Schema details of the data source events
Citrix Virtual Apps and Desktops events
The user events are received in real-time in Citrix Analytics for Security when users use virtual apps or virtual desktops. For more information, see Citrix Virtual Apps and Desktops and Citrix DaaS data source. You can view the following user events associated with Citrix Virtual Apps and Desktops in your SIEM:
- All event types
- Account logon
- App (start, launch, end)
- Clipboard
- File (print, download)
- HDX™ session source
- Printing
- Session (logon, launch, end, termination)
- VDA data
- VDA process creation
For more information about the events and their attributes, see Self-service search for Virtual Apps and Desktops.
You can review what event types are enabled and flowing to SIEM. You can configure or remove the event type that is applicable for a tenant and click the Save Changes button to save your settings.
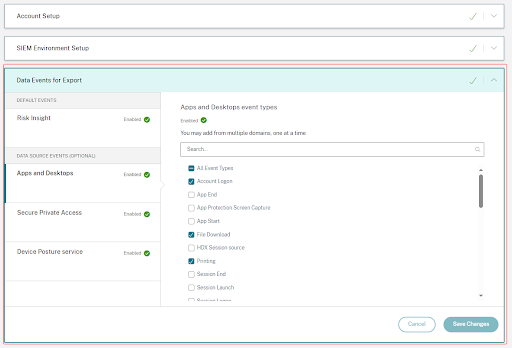
Secure Private Access events
The user events are received in real-time in Citrix Analytics for Security when users access applications through Citrix Secure Private Access, such as Citrix Workspace App, Citrix Secure Access clients, or Citrix Enterprise Browser. You can view the following user events associated with Secure Private Access in your SIEM:
- All event types
- Account logon
- App (connect, launch, end, error)
- File (print, download)
- Policy Evaluation
- Clipboard
- Session (connect, launch)
- Url
- User Login
- SPA Service Logs
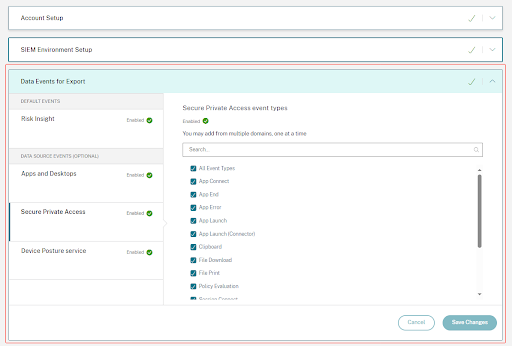
Device Posture service events
The user events are generated when the Citrix Endpoint Analysis (EPA) client performs a posture check on a device attempting to access Citrix Virtual Apps and Desktops or Citrix Secure Private Access resources. You can view the following user events associated with Device Posture service in your SIEM:
- All event types
- Device Posture Evaluation
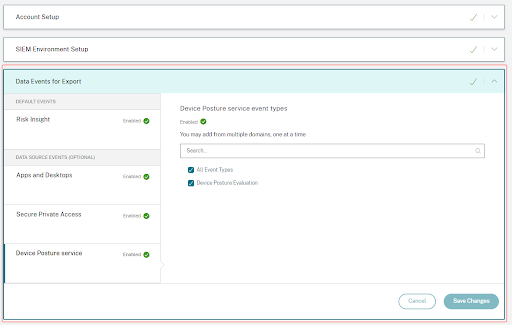
You can review the event types enabled for your tenant and ensure they are flowing to the SIEM. You can configure or remove applicable event types and click the Save Changes button to apply your settings.