Citrix Analyticsのデータエクスポート形式(SIEM向け)
Citrix Analytics for Security™ は、セキュリティ情報およびイベント管理 (SIEM) サービスとの統合を可能にします。この統合により、Citrix Analytics for Security は SIEM サービスにデータを送信し、組織のセキュリティリスク状況に関する洞察を得るのに役立ちます。
現在、Citrix Analytics for Security は以下の SIEM サービスと統合できます。
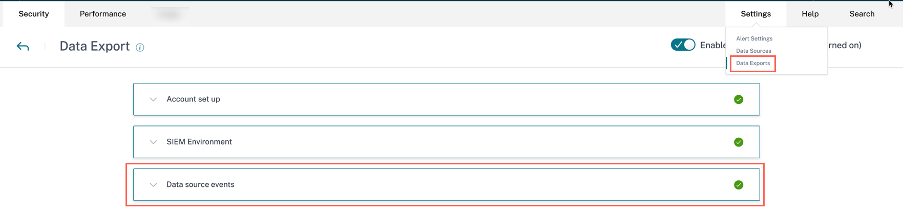
データエクスポートオプションは、設定の下でグローバルに利用できるようになりました。データソースイベントを表示するには、設定 > データエクスポート > データソースイベントに移動します。
Citrix Analytics for Security から SIEM サービスに送信されるリスクインサイトデータには、次の2種類があります。
- リスクインサイトイベント(デフォルトエクスポート)
-
データソースイベント(オプションエクスポート)
SIEM向けリスクインサイトデータ
アカウント設定とSIEMセットアップが完了すると、デフォルトのデータセット(リスクインサイトイベント)がSIEM展開に流れ始めます。リスクインサイトデータセットには、ユーザーリスクスコアイベント、ユーザープロファイルイベント、およびリスクインジケーターアラートが含まれます。これらは、ユーザーイベントを活用して、Citrix Analyticsの機械学習アルゴリズムとユーザー行動分析によって生成されます。
ユーザーのリスクインサイトデータセットには、次のものが含まれます。
- リスクスコアの変更: ユーザーのリスクスコアの変更を示します。ユーザーのリスクスコアの変更が3以上で、この変更が任意の割合で増加するか、10%以上減少した場合、データはSIEMサービスに送信されます。
- リスクインジケーターの概要: ユーザーに対してトリガーされたリスクインジケーターの詳細。
- リスクインジケーターイベントの詳細: リスクインジケーターに関連付けられたユーザーイベント。Citrix Analyticsは、各リスクインジケーターの発生につき最大1000件のイベント詳細をSIEMサービスに送信します。これらのイベントは、発生の時系列順に送信されます。
- ユーザーリスクスコアイベント: ユーザーの現在のリスクスコア。Citrix Analytics for Securityは、このデータを12時間ごとにSIEMサービスに送信します。
-
ユーザープロファイル: ユーザープロファイルデータは、次のように分類できます。
- ユーザーアプリ: ユーザーが起動して使用したアプリケーション。Citrix Analytics for Securityは、Citrix Virtual Apps™ からこのデータを取得し、12時間ごとにSIEMサービスに送信します。
- ユーザーデバイス: ユーザーに関連付けられたデバイス。Citrix Analytics for Securityは、Citrix Virtual AppsおよびCitrix Endpoint Management™ からこのデータを取得し、12時間ごとにSIEMサービスに送信します。
- ユーザーロケーション: ユーザーが最後に検出された都市。Citrix Analytics for Securityは、Citrix Virtual Apps and Desktops™ およびCitrix DaaS(旧Citrix Virtual Apps and Desktopsサービス)からこのデータを取得します。Citrix Analytics for Securityは、この情報を12時間ごとにSIEMサービスに送信します。
- ユーザークライアントIP: ユーザーデバイスのクライアントIPアドレス。Citrix Analytics for Securityは、Citrix Virtual Apps and DesktopsおよびCitrix DaaS™(旧Citrix Virtual Apps and Desktopsサービス)からこのデータを取得し、この情報を12時間ごとにSIEMサービスに送信します。
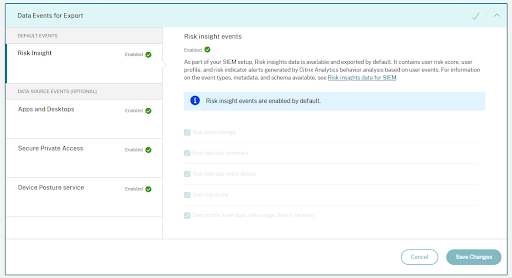
データソースイベントの環境設定を表示できるが構成できない場合は、必要な管理者権限がありません。 詳細については、「Security Analyticsの管理者ロールの管理」を参照してください。
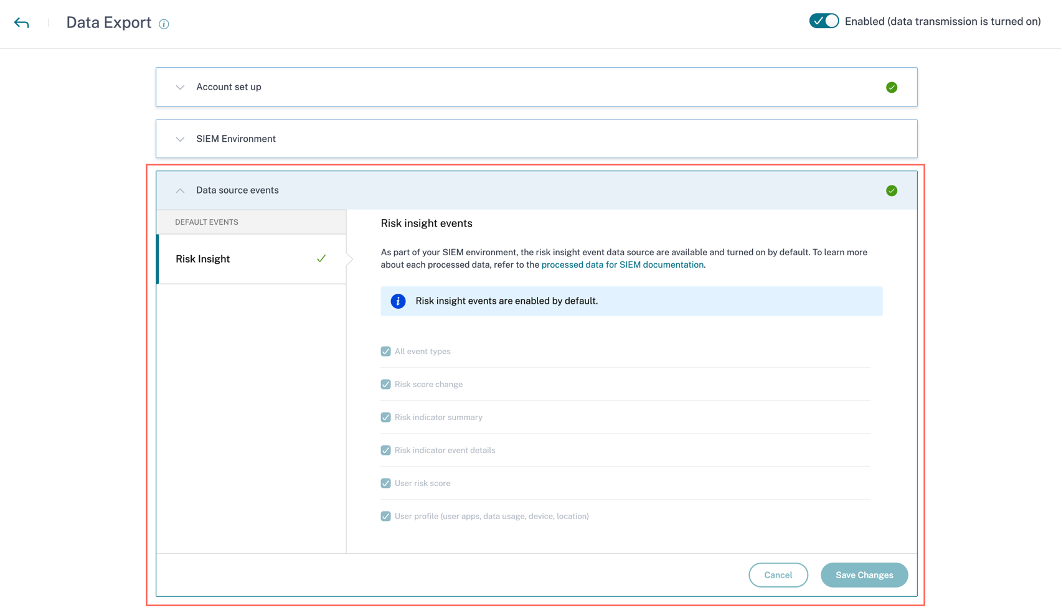
次の例では、変更を保存ボタンが無効になっています。リスクインサイトイベントはデフォルトで有効になっています。
リスクインサイトイベントのスキーマ詳細
次のセクションでは、Citrix Analytics for Securityによって生成される処理済みデータのスキーマについて説明します。
注
次のスキーマサンプルに示されているフィールド値は、表現上の目的のみを意図しています。実際のフィールド値は、ユーザープロファイル、ユーザーイベント、およびリスクインジケーターに基づいて異なります。
次の表は、すべてのユーザープロファイルデータ、ユーザーリスクスコア、およびリスクスコア変更のスキーマに共通するフィールド名を示しています。
| Field name | Description |
|---|---|
entity_id |
エンティティに関連付けられたID。この場合、エンティティはユーザーです。 |
entity_type |
リスクのあるエンティティ。この場合、エンティティはユーザーです。 |
event_type |
SIEMサービスに送信されるデータの種類。例:ユーザーの場所、ユーザーのデータ使用量、またはユーザーのデバイスアクセス情報。 |
tenant_id |
顧客の一意のID。 |
timestamp |
最近のユーザーアクティビティの日時。 |
version |
処理されたデータのスキーマバージョン。現在のスキーマバージョンは2です。 |
ユーザープロファイルデータスキーマ
ユーザーロケーションスキーマ
{
  "tenant_id": "demo_tenant", "entity_id": "demo_user", "entity_type": "user", "timestamp": "2021-02-10T15:00:00Z", "event_type": "userProfileLocation", "country": "India", "city": "Bengaluru", "cnt": 4, "version": 2
  }

<!--NeedCopy-->
ユーザーロケーションのフィールド説明
| Field name | Description |
|---|---|
event_type |
SIEMサービスに送信されるデータの種類。この場合、イベントタイプはユーザーの場所です。 |
country |
ユーザーがログインした国。 |
city |
ユーザーがログインした都市。 |
cnt |
過去12時間でロケーションにアクセスされた回数。 |
ユーザークライアントIPスキーマ
{
  "client_ip": "149.147.136.10",
  "cnt": 3,
  "entity_id": "r2_up_user_1",
  "entity_type": "user",
  "event_type": "userProfileClientIps",
  "tenant_id": "xaxddaily1",
  "timestamp": "2023-09-18T10:45:00Z",
  "version": 2
}


<!--NeedCopy-->
クライアントIPのフィールド説明
| Field name | Description |
|---|---|
client_ip |
ユーザーデバイスのIPアドレス。 |
cnt |
過去12時間でユーザーがデバイスにアクセスした回数。 |
entity_id |
エンティティに関連付けられたID。この場合、エンティティはユーザーです。 |
entity_type |
リスクのあるエンティティ。この場合、イベントタイプはユーザーのクライアントIPです。 |
event_type |
SIEMサービスに送信されるデータの種類。例:ユーザーの場所、ユーザーのデータ使用量、またはユーザーのデバイスアクセス情報。 |
tenant_id |
顧客の一意のID。 |
timestamp |
最近のユーザーアクティビティの日時。 |
version |
処理されたデータのスキーマバージョン。現在のスキーマバージョンは2です。 |
ユーザーデータ使用量スキーマ
{
  "data_usage_bytes": 87555255, "deleted_file_cnt": 0, "downloaded_bytes": 87555255, "downloaded_file_cnt": 5, "entity_id": "demo@demo.com", "entity_type": "user", "event_type": "userProfileUsage", "shared_file_cnt": 0, "tenant_id": "demo_tenant", "timestamp": "2021-02-10T21:00:00Z", "uploaded_bytes": 0, "uploaded_file_cnt": 0, "version": 2
  }

<!--NeedCopy-->
ユーザーデータ使用量のフィールド説明
| Field name | Description |
|---|---|
data_usage_bytes |
ユーザーが使用したデータ量(バイト単位)。これは、ユーザーのダウンロードおよびアップロード量の合計です。 |
deleted_file_cnt |
ユーザーが削除したファイルの数。 |
downloaded_bytes |
ユーザーがダウンロードしたデータ量。 |
downloaded_file_count |
ユーザーがダウンロードしたファイルの数。 |
event_type |
SIEMサービスに送信されるデータの種類。この場合、イベントタイプはユーザーの使用状況プロファイルです。 |
shared_file_count |
ユーザーが共有したファイルの数。 |
uploaded_bytes |
ユーザーがアップロードしたデータ量。 |
uploaded_file_cnt |
ユーザーがアップロードしたファイルの数。 |
ユーザーデバイススキーマ
{
  "cnt": 2, "device": "user1612978536 (Windows)", "entity_id": "demo", "entity_type": "user", "event_type": "userProfileDevice", "tenant_id": "demo_tenant", "timestamp": "2021-02-10T21:00:00Z", "version": 2
  }

<!--NeedCopy-->
ユーザーデバイスのフィールド説明。
| Field name | Description |
|---|---|
cnt |
過去12時間でデバイスにアクセスされた回数。 |
device |
デバイスの名前。 |
event_type |
SIEMサービスに送信されるデータの種類。この場合、イベントタイプはユーザーのデバイスアクセス情報です。 |
ユーザーアプリスキーマ
{
  "tenant_id": "demo_tenant", "entity_id": "demo", "entity_type": "user", "timestamp": "2021-02-10T21:00:00Z", "event_type": "userProfileApp", "version": 2, "session_domain": "99e38d488136f62f828d4823edd120b4f32d724396a7410e6dd1b0", "user_samaccountname": "testnameeikragz779", "app": "Chromeeikragz779", "cnt": 189
  }

<!--NeedCopy-->
ユーザーアプリのフィールド説明。
| Field name | Description |
|---|---|
event_type |
SIEMサービスに送信されるデータの種類。この場合、イベントタイプはユーザーのデバイスアクセス情報です。 |
session_domain |
ユーザーがログオンしたセッションのID。 |
user_samaccountname |
Windows NT 4.0、Windows 95、Windows 98、LAN Managerなどの以前のバージョンのWindowsのクライアントおよびサーバーのログオン名。この名前は、Citrix StoreFrontへのログオン、およびリモートWindowsマシンへのログオンに使用されます。 |
app |
ユーザーがアクセスしたアプリケーションの名前。 |
cnt |
過去12時間でアプリケーションにアクセスされた回数。 |
ユーザーリスクスコアスキーマ
{
  "cur_riskscore": 7, "entity_id": "demo", "entity_type": "user", "event_type": "userProfileRiskscore", "last_update_timestamp": "2021-01-21T16:14:29Z", "tenant_id": "demo_tenant", "timestamp": "2021-02-10T20:45:00Z", "version": 2
  }

<!--NeedCopy-->
ユーザーリスクスコアのフィールド説明。
| Field name | Description |
|---|---|
cur_riskscore |
ユーザーに割り当てられた現在のリスクスコア。リスクスコアは、ユーザーのアクティビティに関連する脅威の重大度に応じて0から100まで変化します。 |
event_type |
SIEMサービスに送信されるデータの種類。この場合、イベントタイプはユーザーのリスクスコアです。 |
last_update_timestamp |
ユーザーのリスクスコアが最後に更新された時刻。 |
timestamp |
ユーザーリスクスコアイベントが収集され、SIEMサービスに送信された時刻。このイベントは12時間ごとにSIEMサービスに送信されます。 |
リスクスコア変更スキーマ
サンプル1:
{
  "alert_message": "Large risk score drop percent since last check", "alert_type": "riskscore_large_drop_pct", "alert_value": -21.73913, "cur_riskscore": 18, "entity_id": "demo_user", "entity_type": "user", "event_type": "riskScoreChange", "tenant_id": "demo_tenant", "timestamp": "2021-02-11T05:45:00Z", "version": 2
  }

<!--NeedCopy-->
サンプル2:
{
  "alert_message": "Risk score increase since last check", "alert_type": "riskscore_increase", "alert_value": 39.0, "cur_riskscore": 76, "entity_id": "demo_user", "entity_type": "user", "event_type": "riskScoreChange", "tenant_id": "demo_tenant", "timestamp": "2021-02-11T03:45:00Z", "version": 2
  }

<!--NeedCopy-->
リスクスコア変更のフィールド説明。
| Field name | Description |
|---|---|
alert_message |
リスクスコア変更に対して表示されるメッセージ。 |
alert_type |
アラートがリスクスコアの増加、またはリスクスコアの割合の著しい低下のいずれであるかを示します。ユーザーのリスクスコアの変更が3以上で、この変更が任意の割合で増加するか、10%以上減少した場合、データはSIEMサービスに送信されます。 |
alert_value |
リスクスコア変更に割り当てられた数値。リスクスコア変更は、ユーザーの現在のリスクスコアと以前のリスクスコアの差です。アラート値は-100から100まで変化します。 |
cur_riskscore |
ユーザーに割り当てられた現在のリスクスコア。リスクスコアは、ユーザーのアクティビティに関連する脅威の重大度に応じて0から100まで変化します。 |
event_type |
SIEMサービスに送信されるデータの種類。この場合、イベントタイプはユーザーのリスクスコアの変更です。 |
timestamp |
ユーザーのリスクスコアの最新の変更が検出された日時。 |
リスクインジケーターのスキーマ
リスクインジケーターのスキーマは、インジケーターの概要スキーマとインジケーターイベントの詳細スキーマの2つの部分で構成されています。リスクインジケーターに基づいて、スキーマ内のフィールドとその値はそれに応じて変化します。
次の表は、すべてのインジケーター概要スキーマに共通するフィールド名を示しています。
| Field name | Description |
|---|---|
data source |
Citrix Analytics for Securityにデータを送信する製品。例:Citrix Secure Private Access™、Citrix Gateway、Citrix Apps and Desktops。 |
data_source_id |
データソースに関連付けられたID。ID 1 = Citrix Gateway、ID 2 = Citrix Endpoint Management、ID 3 = Citrix Apps and Desktops、ID 4 = Citrix Secure Private Access |
entity_type |
リスクのあるエンティティ。ユーザーである可能性があります。 |
entity_id |
リスクのあるエンティティに関連付けられたID。 |
event_type |
SIEMサービスに送信されるデータの種類。この場合、イベントタイプはリスクインジケーターの概要です。 |
indicator_category |
リスクインジケーターのカテゴリを示します。リスクインジケーターは、侵害されたエンドポイント、侵害されたユーザー、データ漏洩、または内部脅威のいずれかのリスクカテゴリにグループ化されます。 |
indicator_id |
リスクインジケーターに関連付けられた一意のID。 |
indicator_category_id |
リスクインジケーターカテゴリに関連付けられたID。ID 1 = データ漏洩、ID 2 = 内部脅威、ID 3 = 侵害されたユーザー、ID 4 = 侵害されたエンドポイント |
indicator_name |
リスクインジケーターの名前。カスタムリスクインジケーターの場合、この名前はインジケーターの作成時に定義されます。 |
indicator_type |
リスクインジケーターがデフォルト(組み込み)かカスタムかを示します。 |
indicator_uuid |
リスクインジケーターインスタンスに関連付けられた一意のID。 |
indicator_vector_name |
リスクインジケーターに関連付けられたリスクベクトルを示します。リスクベクトルは、デバイスベースのリスクインジケーター、ロケーションベースのリスクインジケーター、ログオン失敗ベースのリスクインジケーター、IPベースのリスクインジケーター、データベースのリスクインジケーター、ファイルベースのリスクインジケーター、およびその他のリスクインジケーターです。 |
indicator_vector_id |
リスクベクトルに関連付けられたID。ID 1 = デバイスベースのリスクインジケーター、ID 2 = ロケーションベースのリスクインジケーター、ID 3 = ログオン失敗ベースのリスクインジケーター、ID 4 = IPベースのリスクインジケーター、ID 5 = データベースのリスクインジケーター、ID 6 = ファイルベースのリスクインジケーター、ID 7 = その他のリスクインジケーター、ID 999 = 利用不可 |
occurrence_details |
リスクインジケーターのトリガー条件に関する詳細。 |
risk_probability |
ユーザーイベントに関連するリスクの可能性を示します。値は0から1.0まで変化します。カスタムリスクインジケーターの場合、ポリシーベースのインジケーターであるため、risk_probabilityは常に1.0です。 |
severity |
リスクの重大度を示します。低、中、高のいずれかです。 |
tenant_id |
顧客の一意のID。 |
timestamp |
リスクインジケーターがトリガーされた日時。 |
ui_link |
Citrix Analyticsユーザーインターフェイスのユーザータイムラインビューへのリンク。 |
observation_start_time |
Citrix Analyticsがユーザーアクティビティの監視を開始する時刻からタイムスタンプまでの時間。この期間中に異常な動作が検出された場合、リスクインジケーターがトリガーされます。 |
次の表は、すべてのインジケーターイベント詳細スキーマに共通するフィールド名を示しています。
| Field name | Description |
|---|---|
data_source_id |
データソースに関連付けられたID。ID 1 = Citrix Gateway、ID 2 = Citrix Endpoint Management、ID 3 = Citrix Apps and Desktops、ID 4 = Citrix Secure Private Access |
indicator_category_id |
リスクインジケーターカテゴリに関連付けられたID。ID 1 = データ漏洩、ID 2 = 内部脅威、ID 3 = 侵害されたユーザー、ID 4 = 侵害されたエンドポイント |
entity_id |
リスクのあるエンティティに関連付けられたID。 |
entity_type |
リスクのあるエンティティ。ユーザーである可能性があります。 |
event_type |
SIEMサービスに送信されるデータの種類。この場合、イベントタイプはリスクインジケーターイベントの詳細です。 |
indicator_id |
リスクインジケーターに関連付けられた一意のID。 |
indicator_uuid |
リスクインジケーターインスタンスに関連付けられた一意のID。 |
indicator_vector_name |
リスクインジケーターに関連付けられたリスクベクトルを示します。リスクベクトルは、デバイスベースのリスクインジケーター、ロケーションベースのリスクインジケーター、ログオン失敗ベースのリスクインジケーター、IPベースのリスクインジケーター、データベースのリスクインジケーター、ファイルベースのリスクインジケーター、およびその他のリスクインジケーターです。 |
indicator_vector_id |
リスクベクトルに関連付けられたID。ID 1 = デバイスベースのリスクインジケーター、ID 2 = ロケーションベースのリスクインジケーター、ID 3 = ログオン失敗ベースのリスクインジケーター、ID 4 = IPベースのリスクインジケーター、ID 5 = データベースのリスクインジケーター、ID 6 = ファイルベースのリスクインジケーター、ID 7 = その他のリスクインジケーター、ID 999 = 利用不可 |
tenant_id |
顧客の一意のID。 |
timestamp |
リスクインジケーターがトリガーされた日時。 |
version |
処理されたデータのスキーマバージョン。現在のスキーマバージョンは2です。 |
client_ip |
ユーザーデバイスのIPアドレス。 |
注
整数データ型フィールドの値が利用できない場合、割り当てられる値は-999です。例:
"latitude": -999、"longitude": -999。文字列データ型フィールドの値が利用できない場合、割り当てられる値はNAです。例:
"city": "NA"、"region": "NA"。
Citrix Secure Private Accessリスクインジケーターのスキーマ
ブラックリストに登録されたURLへのアクセス試行リスクインジケーターのスキーマ
インジケーター概要スキーマ
{
  "tenant_id": "demo_tenant",
  "indicator_id": 401,
  "indicator_uuid": "8f2a39bd-c7c2-5555-a86a-5cfe5b64dfef",
  "indicator_category_id": 2,
  "indicator_vector": {
    "name": "Other Risk Indicators",
    "id": 7 },
  "data_source_id": 4,
  "timestamp": "2018-03-15T10:59:58Z",
  "event_type": "indicatorSummary",
  "entity_type": "user",
  "entity_id": "demo_user",
  "version": 2,
  "risk_probability": 1,
  "indicator_category": "Insider threats",
  "indicator_name": "Attempt to access blacklisted URL",
  "severity": "low",
  "data_source
<!--NeedCopy-->